GBPUSD Will Go Down! Sell!
Here is our detailed technical review for GBPUSD.
Time Frame: 6h
Current Trend: Bearish
Sentiment: Overbought (based on 7-period RSI)
Forecast: Bearish
The market is on a crucial zone of supply 1.336.
The above-mentioned technicals clearly indicate the dominance of sellers on the market. I recommend shorting the instrument, aiming at 1.326 level.
P.S
Overbought describes a period of time where there has been a significant and consistent upward move in price over a period of time without much pullback.
Like and subscribe and comment my ideas if you enjoy them!
Short

EUR/NZD BEST PLACE TO SELL FROM|SHORT
Hello, Friends!
It makes sense for us to go short on EUR/NZD right now from the resistance line above with the target of 1.988 because of the confluence of the two strong factors which are the general downtrend on the previous 1W candle and the overbought situation on the lower TF determined by it’s proximity to the upper BB band.
Disclosure: I am part of Trade Nation's Influencer program and receive a monthly fee for using their TradingView charts in my analysis.
✅LIKE AND COMMENT MY IDEAS✅

EUR/CAD BEARS WILL DOMINATE THE MARKET|SHORT
EUR/CAD SIGNAL
Trade Direction: short
Entry Level: 1.632
Target Level: 1.625
Stop Loss: 1.636
RISK PROFILE
Risk level: medium
Suggested risk: 1%
Timeframe: 9h
Disclosure: I am part of Trade Nation's Influencer program and receive a monthly fee for using their TradingView charts in my analysis.
✅LIKE AND COMMENT MY IDEAS✅

EUR/USD SENDS CLEAR BEARISH SIGNALS|SHORT
Hello, Friends!
We are now examining the EUR/USD pair and we can see that the pair is going up locally while also being in a uptrend on the 1W TF. But there is also a powerful signal from the BB upper band being nearby, indicating that the pair is overbought so we can go short from the resistance line above and a target at 1.173 level.
Disclosure: I am part of Trade Nation's Influencer program and receive a monthly fee for using their TradingView charts in my analysis.
✅LIKE AND COMMENT MY IDEAS✅

CADJPY: Bearish Forecast & Outlook
The price of CADJPY will most likely collapse soon enough, due to the supply beginning to exceed demand which we can see by looking at the chart of the pair.
Disclosure: I am part of Trade Nation's Influencer program and receive a monthly fee for using their TradingView charts in my analysis.
❤️ Please, support our work with like & comment! ❤️

EURGBP: Short Trade with Entry/SL/TP
EURGBP
- Classic bearish formation
- Our team expects pullback
SUGGESTED TRADE:
Swing Trade
Short EURGBP
Entry - 0.8649
Sl - 0.8755
Tp - 0.8738
Our Risk - 1%
Start protection of your profits from lower levels
Disclosure: I am part of Trade Nation's Influencer program and receive a monthly fee for using their TradingView charts in my analysis.
❤️ Please, support our work with like & comment! ❤️

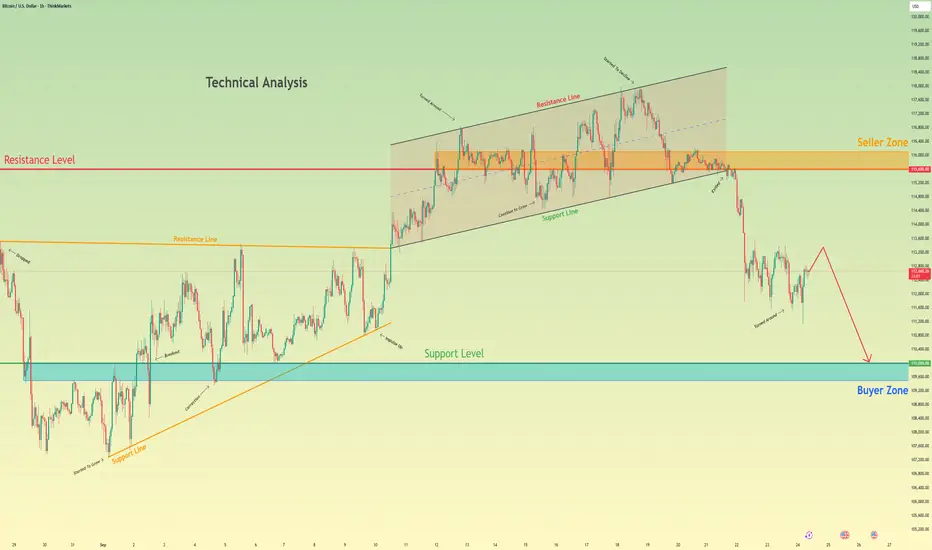
Bitcoin can Continue to Decline to Support LevelHello traders, I want share with you my opinion about Bitcoin. The market structure for Bitcoin has recently shifted to a bearish bias following a significant breakdown from its prior upward channel. After a complex consolidation within a triangle, the price of BTC made a final push to the highs near the 115600 seller zone before being strongly rejected, which led to the failure of the channel's support. This structural break initiated a new bearish phase, causing a sharp decline to a recent low of 111600. Currently, the asset is in a small consolidation, attempting a minor corrective bounce after the significant fall. In my mind, this consolidation is simply a pause before the next wave of selling pressure resumes. I expect that this small upward movement will soon be exhausted and that the price will continue its bearish movement downwards. A failure to produce a strong rally from these levels confirms that sellers remain in control of the market. Therefore, I have placed my TP for this trend-continuation scenario at the major 110000 support level. This target is a logical objective, as it represents the next significant area of historical support and aligns with the 110000 - 109500 buyer zone. Please share this idea with your friends and click Boost 🚀
Disclaimer: As part of ThinkMarkets’ Influencer Program, I am sponsored to share and publish their charts in my analysis.
GBP/USD - Sell side Liquidity Available (4H forecast) 🔥 GBP/USD – 4H Forecast 💷💵
Cable’s chart is serving us some spicy structure — let’s break it down 👇
🕰 Market Context
Price rejected hard from that RSL (Resistance Supply Level) at the top of the range.
We’ve since seen a BOS (Break of Structure) to the downside — bears flexing their muscles. 💪🐻
Market reacted cleanly from a daily demand zone earlier, but momentum is stalling.
📉 Bearish Flow
Clear shift in market structure (SHoF) confirmed.
We’re chilling inside a 4H supply zone, which already pushed price down once.
Internal range showing liquidity being swept → fuel for a possible continuation lower.
⚡ Key Levels
Support zones:
1.3400–1.3410 (extreme range support)
1.3350–1.3370 (internal range demand)
Resistance :
1.3500–1.3520 → sell-side zone of interest.
🎯 Forecast Path
Expect a reaction bounce into the 4H supply (1.3490–1.3520) 📈.
If supply holds, watch for continuation down toward 1.3350–1.3370 🕳.
Breaking below that → opens the door to 1.3150 strong support (next liquidity magnet).
📝 Trade Idea
Bias : Bearish until market proves otherwise.
Plan : Look for shorts on pullbacks into 1.3490–1.3520 zone.
Targets : 1.3400 → 1.3350 range.
Invalidation : Break & close above 1.3550 kills the bearish play.
📌 Summary : GBP/USD is in bearish flow after the RSL rejection & BOS. Supply zones are respected, liquidity is building below — shorts into demand are the play until 1.3550 breaks

USDCHF Will Fall! Short!
Please, check our technical outlook for USDCHF.
Time Frame: 12h
Current Trend: Bearish
Sentiment: Overbought (based on 7-period RSI)
Forecast: Bearish
The market is approaching a significant resistance area 0.795.
Due to the fact that we see a positive bearish reaction from the underlined area, I strongly believe that sellers will manage to push the price all the way down to 0.786 level.
P.S
Please, note that an oversold/overbought condition can last for a long time, and therefore being oversold/overbought doesn't mean a price rally will come soon, or at all.
Like and subscribe and comment my ideas if you enjoy them!

GBPUSD Will Go Down! Sell!
Please, check our technical outlook for GBPUSD.
Time Frame: 15m
Current Trend: Bearish
Sentiment: Overbought (based on 7-period RSI)
Forecast: Bearish
The market is trading around a solid horizontal structure 1.346.
The above observations make me that the market will inevitably achieve 1.345 level.
P.S
Overbought describes a period of time where there has been a significant and consistent upward move in price over a period of time without much pullback.
Like and subscribe and comment my ideas if you enjoy them!

GOLD SHORT FROM RESISTANCE
GOLD SIGNAL
Trade Direction: short
Entry Level: 3,743.82
Target Level: 3,553.39
Stop Loss: 3,870.43
RISK PROFILE
Risk level: medium
Suggested risk: 1%
Timeframe: 1D
Disclosure: I am part of Trade Nation's Influencer program and receive a monthly fee for using their TradingView charts in my analysis.
✅LIKE AND COMMENT MY IDEAS✅

EUR/GBP BEARS ARE GAINING STRENGTH|SHORT
Hello, Friends!
EUR/GBP pair is in the downtrend because previous week’s candle is red, while the price is clearly rising on the 12H timeframe. And after the retest of the resistance line above I believe we will see a move down towards the target below at 0.867 because the pair is overbought due to its proximity to the upper BB band and a bearish correction is likely.
Disclosure: I am part of Trade Nation's Influencer program and receive a monthly fee for using their TradingView charts in my analysis.
✅LIKE AND COMMENT MY IDEAS✅

SOLUSDT Strong Rejection at Key Support – 230.00 Incoming!Hey everyone, Ken here!
SOLUSDT has been quite interesting lately. After a sharp decline from the channel’s top, the price broke through the support zone, often referred to as the neckline, and reached a key support area below. Here, we saw a strong rejection wick, which clearly indicates that buyers have stepped in and are ready to take control of the market.
With this setup, I predict that the 230.00 level will be a reasonable target in the short term. The strong rejection at this support zone suggests a high potential for a reversal.
Feel free to leave a comment if you agree with this prediction, or if you have a different perspective. Let’s discuss and share our ideas!

MARKET UPDATE BTC/USDT 25/09/2025📊BTC/USDT Update
On the low time frame, BTC has broken down and failed to reclaim the 113,223 – 114,019 zone.
This breakdown signals loss of the cycle structure, confirming that the previous bullish cycle has ended.
Key levels:
113,223 – 114,019 → resistance zone. As long as BTC remains below this, the structure stays bearish.
111,900 → current trading area, under pressure.
Upside scenario: BTC would need to reclaim 113,223 first, and then confirm above 114,019, to even consider restarting an uptrend cycle. Without that, upside potential remains very limited.
Downside risk: Staying below 113,223 keeps BTC in breakdown mode, with increased probability of further decline toward 110,000 – 108,000.
📌 Summary
BTC lost the cycle support → bearish confirmation.
Reclaim above 114,019 is required to regain bullish momentum.
As long as BTC trades below 113,223, the bias remains bearish with downside risk.

AFTER END OF CYCLE BTC CAN RETURN BELOW 110K - 90K📊 BTC/USDT Market Update
Current Price: ~$113,509
Cycle Recap: From the $84,000 low to the $114,000 high, BTC has completed what looks like an end of cycle phase (as marked on chart).
We did explain here the end of the cycle
There is a high chance in the coming time that BTC will break down below 110K and enter the correction zone.

solana to the depthsthere is a scenario where we could go for an sfp, but there have been many within this higher time frame one, so not sure if it'll come again before heading lower

AUDJPY: Weak Market & Bearish Continuation
The recent price action on the AUDJPY pair was keeping me on the fence, however, my bias is slowly but surely changing into the bearish one and I think we will see the price go down.
Disclosure: I am part of Trade Nation's Influencer program and receive a monthly fee for using their TradingView charts in my analysis.
❤️ Please, support our work with like & comment! ❤️

USDCHF: Bearish Continuation & Short Signal
USDCHF
- Classic bearish pattern
- Our team expects retracement
SUGGESTED TRADE:
Swing Trade
Sell USDCHF
Entry - 0.7954
Stop - 0.7962
Take - 0.7937
Our Risk - 1%
Start protection of your profits from lower levels
Disclosure: I am part of Trade Nation's Influencer program and receive a monthly fee for using their TradingView charts in my analysis.
❤️ Please, support our work with like & comment! ❤️

GBPJPY Under Pressure! SELL!
My dear followers,
I analysed this chart on GBPJPY and concluded the following:
The market is trading on 200.08 pivot level.
Bias - Bearish
Technical Indicators: Both Super Trend & Pivot HL indicate a highly probable Bearish continuation.
Target - 199.62
About Used Indicators:
A super-trend indicator is plotted on either above or below the closing price to signal a buy or sell. The indicator changes color, based on whether or not you should be buying. If the super-trend indicator moves below the closing price, the indicator turns green, and it signals an entry point or points to buy.
Disclosure: I am part of Trade Nation's Influencer program and receive a monthly fee for using their TradingView charts in my analysis.
———————————
WISH YOU ALL LUCK

NQ - Nasdaq Is Coming For Your Stop!OK, there's not much to say.
That guy looks bad. I mean, really bad §8-)
Let's see if we can use the bad mood for a nice short down to the bottom.
Ohhhh Myyyy.....

ETH Analysis: Deeper Pullback in PlayETH is still trading within a broader uptrend channel, but recently, the price has started to pull back after a significant rally. After pushing up too far, the market is now taking a breather and recalibrating.
From a technical standpoint, this pullback is completely normal and healthy after such a strong move. Pullbacks like this are part of any bullish trend, providing the market a chance to reset. If the pullback continues, the next target could be the 3,600 support area, where multiple key factors converge: horizontal support, trendline support, and the 0.618 Fibonacci retracement level.
The 3,600 level is crucial. If ETH holds strong here and shows signs of a reversal, it could be a solid entry point for the next leg up. However, if the price breaks below this level, we may see deeper downside, and the current bullish structure could start to break down.
As always, confirm your setups before entering and make sure your risk management is solid. Stay alert for the next opportunities!

SILVER SELLERS WILL DOMINATE THE MARKET|SHORT
SILVER SIGNAL
Trade Direction: short
Entry Level: 4,409.7
Target Level: 4,246.7
Stop Loss: 4,517.2
RISK PROFILE
Risk level: medium
Suggested risk: 1%
Timeframe: 9h
Disclosure: I am part of Trade Nation's Influencer program and receive a monthly fee for using their TradingView charts in my analysis.
✅LIKE AND COMMENT MY IDEAS✅

USD/CAD BEARISH BIAS RIGHT NOW| SHORT
USD/CAD SIGNAL
Trade Direction: short
Entry Level: 1.387
Target Level: 1.379
Stop Loss: 1.392
RISK PROFILE
Risk level: medium
Suggested risk: 1%
Timeframe: 12h
Disclosure: I am part of Trade Nation's Influencer program and receive a monthly fee for using their TradingView charts in my analysis.
✅LIKE AND COMMENT MY IDEAS✅
