EURUSD Short: Targeting the 1.1560 Demand ZoneHello, traders! The prior market structure for EURUSD was a complex downward wedge, from which the price eventually broke out and entered the current consolidation range. This range has been established between the 1.1795 supply 2 level and a demand zone at the lows, with the price action rotating between these two key boundaries.
Currently, the auction is at a critical inflection point. After bouncing twice from the demand zone at the bottom of the range, the price has rallied back up to test the key horizontal supply at the 1.1670 level. After a brief test, the price has been rejected from this area, showing that sellers are in control here.
My scenario for the development of events is a continuation of this decline from the supply level. I believe this rejection confirms the range is still active and that the next logical move is a rotation back down to the lows. In my opinion, the bearish initiative from this rejection will be strong enough to push the price to the demand zone. The take-profit is therefore set at 1.1560. Manage your risk!
Short

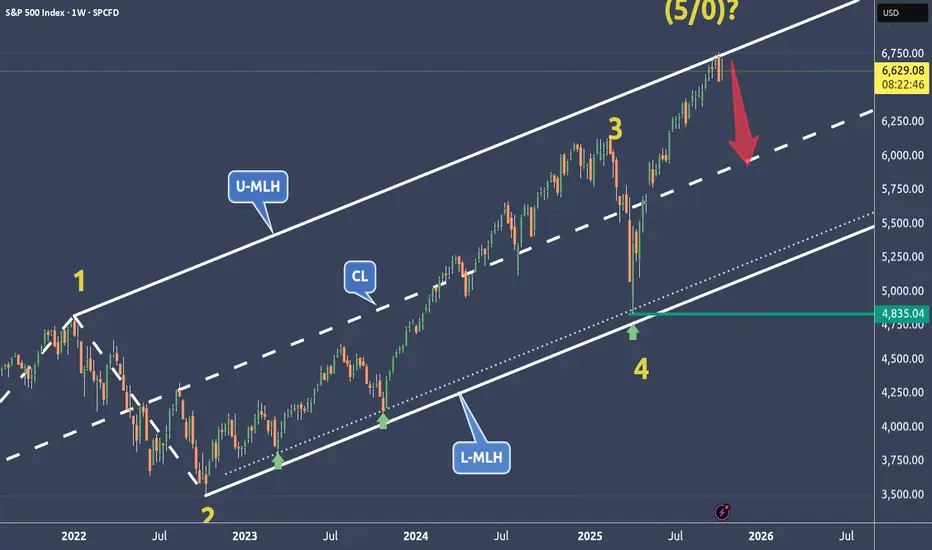
SPX is weakening at a very dangerous price level🔱 SPX is at a very dangerous price level ⚠️
...right at the Upper Median Line Parallel.
💰 If this market turns, the Centerline becomes the next target.
The 0-5 Count is also a good indication when prices start to turn at these extreme levels.
⚠️ Stay sharp — momentum is fading.
I wish you all a relaxing weekend.
GOLD Is Bearish! Short!
Take a look at our analysis for GOLD.
Time Frame: 4h
Current Trend: Bearish
Sentiment: Overbought (based on 7-period RSI)
Forecast: Bearish
The price is testing a key resistance 4,338.72.
Taking into consideration the current market trend & overbought RSI, chances will be high to see a bearish movement to the downside at least to 4,203.99 level.
P.S
We determine oversold/overbought condition with RSI indicator.
When it drops below 30 - the market is considered to be oversold.
When it bounces above 70 - the market is considered to be overbought.
Like and subscribe and comment my ideas if you enjoy them!

EURUSD Is Very Bearish! Sell!
Please, check our technical outlook for EURUSD.
Time Frame: 1D
Current Trend: Bearish
Sentiment: Overbought (based on 7-period RSI)
Forecast: Bearish
The market is trading around a solid horizontal structure 1.169.
The above observations make me that the market will inevitably achieve 1.146 level.
P.S
Overbought describes a period of time where there has been a significant and consistent upward move in price over a period of time without much pullback.
Like and subscribe and comment my ideas if you enjoy them!

GBPCAD Will Fall! Short!
Take a look at our analysis for GBPCAD.
Time Frame: 1D
Current Trend: Bearish
Sentiment: Overbought (based on 7-period RSI)
Forecast: Bearish
The market is approaching a key horizontal level 1.885.
Considering the today's price action, probabilities will be high to see a movement to 1.870.
P.S
The term oversold refers to a condition where an asset has traded lower in price and has the potential for a price bounce.
Overbought refers to market scenarios where the instrument is traded considerably higher than its fair value. Overvaluation is caused by market sentiments when there is positive news.
Like and subscribe and comment my ideas if you enjoy them!

EUR/NZD BEARISH BIAS RIGHT NOW| SHORT
EUR/NZD SIGNAL
Trade Direction: short
Entry Level: 2.042
Target Level: 2.007
Stop Loss: 2.066
RISK PROFILE
Risk level: medium
Suggested risk: 1%
Timeframe: 1D
Disclosure: I am part of Trade Nation's Influencer program and receive a monthly fee for using their TradingView charts in my analysis.
✅LIKE AND COMMENT MY IDEAS✅

METAs Short Target At $630🔱 The Cracks Are Showing 🔱
🏦 Let’s talk fundamentals.
The biggest storm cloud hanging over META right now? Regulation — in both the EU and the U.S. If fines or compliance costs ramp up, profits get squeezed and strategy shifts become inevitable.
👉 Competition is biting too. New apps are stealing attention, and every second users spend elsewhere chips away at Meta’s moat.
⚠️ Then there’s the AI spending spree. Billions are burning to build infrastructure, but if those bets don’t pay off fast, margins will bleed.
Add growing media pressure — from content moderation to child safety — and you’ve got a brand walking through a minefield of reputational risk.
📈 Now, look at the chart.
The price has fallen below the Centerline. That’s not noise — that’s a message. It’s a classic short signal.
Before the drop, we saw price action stall again and again at the upper quarter line. That’s not random congestion. That’s distribution — the big whales quietly unloading while everyone else was still bullish.
Then came the pullback to the Centerline. followed by a weak close. Translation: buyers are drying up.
💰 Target? $630 at the L-MLH. With smart position sizing, this could be a sweet Christmas trade.

CVNA - Carvana on the way down
Since August, CVNA has been moving sideways without any real direction.
At the upper quarter line, sellers appeared at nearly every price level, keeping CVNA pinned down.
Now that the price is trading below the centerline, the next target is the lower median line (L-MLH).
Is it too late to short?
Perhaps—but I’d at least wait for a pullback, or better yet, hold off until after earnings.

Bearish Divergence still at playThe momentum hasn't been great on weekly. Multiple bearish divergence were in play, right before tarrif shock and a few after some runners but it just lead to more inconsistent and weak ath.
4h/daily tf shows a bull and bear trap widening pattern. Unfortunately bulls got hurt the most.
I'll be bullish once weekly RSI breaks the divergence.

#034: USD/ZAR SHORT Investing Opportunity
In recent days, the exchange rate has struggled every time it climbed back to the 17.40–17.48 range: above there, the price is rejected, leaving shadows, and unable to close strongly. Hello, I'm Forex Trader Andrea Russo, an independent trader and prop trader with $200,000 in capital under management. Thank you in advance for your time.
It's the classic supply zone: sellers are making themselves heard, while buyers remain light. I waited for it to rebound with a small pullback and placed the sale at 17.396 precisely to take advantage of that textbook rebound in the resistance area, not at the low: I prefer to be "caught" where the fast sellers are selling, rather than chasing.
I placed my stop at 17.4801, just above the last pocket of liquidity. If the market really wants to rise, it will let me know by breaking that zone with a clean close. In that case, I'll exit without drama because my idea is invalidated. The target at 17.2316 is the first "serious" support below, where the price has reacted in the past. It's close to a 1:2 risk/reward ratio, so even if I don't take the maximum extension, the asymmetry is in my favor.
Furthermore, looking at the general mood: the dollar isn't as strong as it was a few weeks ago, and when the market is less fearful, it tends to favor "risky" currencies like the rand. Retail investors are also often biased long on this cross: if many small investors buy the dollar against the rand right against resistance, I'm happy to position myself on the other side and take advantage of any downside squeezes.

How to Short Gold as a Stock Trader and Profit on the DropGold is at historically high levels due to several key factors
Geopolitical Tensions: Trade disputes, regional conflicts, and global uncertainty are pushing investors toward safe-haven assets like gold
Monetary Policy Expectations: Anticipated interest rate cuts reduce the opportunity cost of holding gold, making it more attractive compared to bonds or cash
Weakening U.S. Dollar: A softer dollar makes gold cheaper for international buyers, boosting demand
Central Bank and Institutional Demand: Many central banks are increasing gold reserves, and institutional investors are allocating more to gold as a hedge against economic instability
Market Sentiment and Speculation: Bullish sentiment and speculative positioning are adding upward pressure on prices
If these factors start to ease, such as trade tensions reducing (highly likely with the next Trump Tweet), interest rates staying the same or even rising (less likely), or the dollar strengthening (likely), gold could start to pull back and given how aggressive its run has been, it could be a significant pull back.
For investors looking to profit from declines, inverse gold ETFs provide a way to benefit when prices fall, offering a strategic tool for hedging or directional trading.
They are a MUCH riskier type of trade - especially leverage ETFs so please do your research beforehand and definitely do not invest any money you can't do without if it all goes horribly wrong and Gold does indeed continue to head up past $5k.
Crazy times - hence probably why Gold is doing so well.
Buyer / bear - beware :)

EURAUD: Bearish Continuation & Short Trade
EURAUD
- Classic bearish formation
- Our team expects fall
SUGGESTED TRADE:
Swing Trade
Sell EURAUD
Entry Level - 1.7977
Sl - 1.8009
Tp - 1.7921
Our Risk - 1%
Start protection of your profits from lower levels
Disclosure: I am part of Trade Nation's Influencer program and receive a monthly fee for using their TradingView charts in my analysis.
❤️ Please, support our work with like & comment! ❤️

SILVER Will Go Lower From Resistance! Sell!
Please, check our technical outlook for SILVER.
Time Frame: 1D
Current Trend: Bearish
Sentiment: Overbought (based on 7-period RSI)
Forecast: Bearish
The market is approaching a significant resistance area 5,316.9.
Due to the fact that we see a positive bearish reaction from the underlined area, I strongly believe that sellers will manage to push the price all the way down to 4,596.2 level.
P.S
We determine oversold/overbought condition with RSI indicator.
When it drops below 30 - the market is considered to be oversold.
When it bounces above 70 - the market is considered to be overbought.
Like and subscribe and comment my ideas if you enjoy them!

EUR/JPY BEARS WILL DOMINATE THE MARKET|SHORT
EUR/JPY SIGNAL
Trade Direction: short
Entry Level: 176.253
Target Level: 174.219
Stop Loss: 177.596
RISK PROFILE
Risk level: medium
Suggested risk: 1%
Timeframe: 1D
Disclosure: I am part of Trade Nation's Influencer program and receive a monthly fee for using their TradingView charts in my analysis.
✅LIKE AND COMMENT MY IDEAS✅

GBPUSD: Forecast & Technical Analysis
Looking at the chart of GBPUSD right now we are seeing some interesting price action on the lower timeframes. Thus a local move down seems to be quite likely.
Disclosure: I am part of Trade Nation's Influencer program and receive a monthly fee for using their TradingView charts in my analysis.
❤️ Please, support our work with like & comment! ❤️

GOLD: Short Signal with Entry/SL/TP
GOLD
- Classic bearish formation
- Our team expects pullback
SUGGESTED TRADE:
Swing Trade
Short GOLD
Entry - 4226.6
Sl - 4233.5
Tp - 4213.2
Our Risk - 1%
Start protection of your profits from lower levels
Disclosure: I am part of Trade Nation's Influencer program and receive a monthly fee for using their TradingView charts in my analysis.
❤️ Please, support our work with like & comment! ❤️

EURUSD The Target Is DOWN! SELL!
My dear subscribers,
This is my opinion on the EURUSD next move:
The instrument tests an important psychological level 1.1657
Bias - Bearish
Technical Indicators: Supper Trend gives a precise Bearish signal, while Pivot Point HL predicts price changes and potential reversals in the market.
Target - 1.1623
About Used Indicators:
On the subsequent day, trading above the pivot point is thought to indicate ongoing bullish sentiment, while trading below the pivot point indicates bearish sentiment.
Disclosure: I am part of Trade Nation's Influencer program and receive a monthly fee for using their TradingView charts in my analysis.
———————————
WISH YOU ALL LUCK

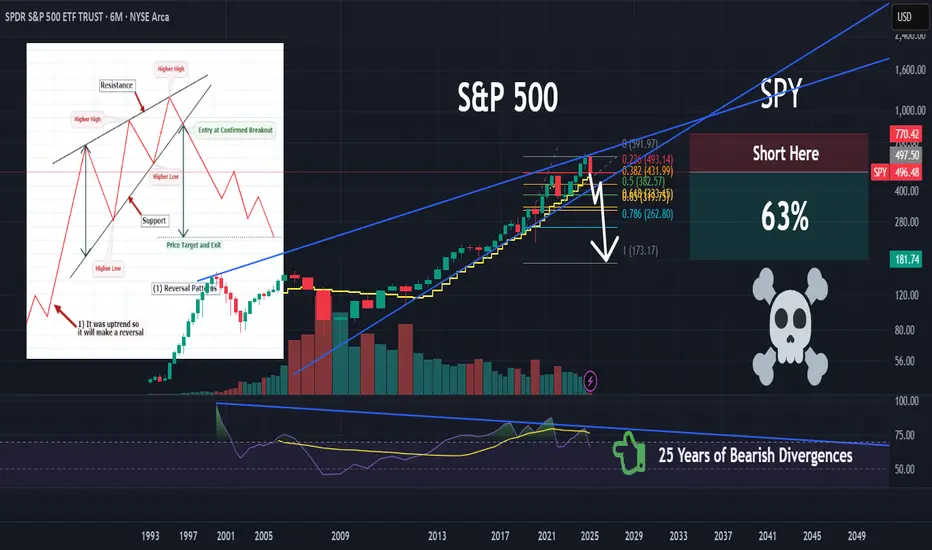
SPY | Things Could Get Ugly | ShortSPDR S&P 500 ETF Trust seeks to provide investment results that, before expenses, correspond generally to the price and yield performance of the S&P 500 Index. The Trust seeks to achieve its investment objective by holding a portfolio of the common stocks that are included in the index (the "Portfolio"), with the weight of each stock in the Portfolio substantially corresponding to the weight of such stock in the index.
EURCAD: Expecting Bearish Movement! Here is Why:
Remember that we can not, and should not impose our will on the market but rather listen to its whims and make profit by following it. And thus shall be done today on the EURCAD pair which is likely to be pushed down by the bears so we will sell!
Disclosure: I am part of Trade Nation's Influencer program and receive a monthly fee for using their TradingView charts in my analysis.
❤️ Please, support our work with like & comment! ❤️

GBPAUD My Opinion! SELL!
My dear friends,
Please, find my technical outlook for GBPAUD below:
The price is coiling around a solid key level - 2.0570
Bias - Bearish
Technical Indicators: Pivot Points Low anticipates a potential price reversal.
Super trend shows a clear sell, giving a perfect indicators' convergence.
Goal - 2.0472
About Used Indicators:
The pivot point itself is simply the average of the high, low and closing prices from the previous trading day.
Disclosure: I am part of Trade Nation's Influencer program and receive a monthly fee for using their TradingView charts in my analysis.
———————————
WISH YOU ALL LUCK

GBPNZD My Opinion! SELL!
My dear friends,
GBPNZD looks like it will make a good move, and here are the details:
The market is trading on 2.3415 pivot level.
Bias - Bearish
Technical Indicators: Supper Trend generates a clear short signal while Pivot Point HL is currently determining the overall Bearish trend of the market.
Goal - 2.3361
Recommended Stop Loss - 2.3445
About Used Indicators:
Pivot points are a great way to identify areas of support and resistance, but they work best when combined with other kinds of technical analysis
Disclosure: I am part of Trade Nation's Influencer program and receive a monthly fee for using their TradingView charts in my analysis.
———————————
WISH YOU ALL LUCK

EURUSD: Bearish Continuation
Balance of buyers and sellers on the EURUSD pair, that is best felt when all the timeframes are analyzed properly is shifting in favor of the sellers, therefore is it only natural that we go short on the pair.
Disclosure: I am part of Trade Nation's Influencer program and receive a monthly fee for using their TradingView charts in my analysis.
❤️ Please, support our work with like & comment! ❤️

EURUSD Short: Trend Continuation After BreakdownHello, traders! The prior market structure for EURUSD has shifted to a bearish bias following a major reversal from the supply 2 level near 1.1835. The failure of a prior ascending channel initiated a new downtrend, which has been guiding the price auction lower through a series of complex breakdowns and consolidations.
Currently, the price action has shown significant weakness by breaking below the key horizontal support at the 1.1580 level. After multiple failed attempts by buyers to hold this level, sellers have successfully pushed the price below this critical area. The auction is now in a corrective pullback, approaching this broken support level from below for a classic retest.
My scenario for the development of events is a continuation of the downtrend. I believe this rally is a corrective retest that will fail upon reaching the 1.1580 level, which should now act as strong resistance. In my opinion, a confirmed rejection from this area will validate the bearish control and trigger the next impulsive move down. The take-profit is therefore set at 1.1510. Manage your risk.
