BTCUSD Short Setup After Trendline BreakBTCUSD just made a decisive break below the main trendline, a clear signal that bearish momentum is building. Sellers have stepped up, and the tone of the market has shifted — control is now in their hands.
In the short term, I’m watching for a retest of the broken level. What used to be support may now act as resistance. If buyers can’t push price back above that zone, it confirms weakness and opens the door for continuation lower, with 112,000 as the next key target.
Traders should keep an eye on bearish signals like rejection wicks, bearish engulfing candles, or strong sell volume. A clean reclaim above resistance would invalidate the bearish bias, but until then, sellers remain in control. Let’s see how this unfolds.
Short

GOLD: Short Trade Explained
GOLD
- Classic bearish pattern
- Our team expects retracement
SUGGESTED TRADE:
Swing Trade
Sell GOLD
Entry - 3726.8
Stop - 3739.3
Take - 3703.3
Our Risk - 1%
Start protection of your profits from lower levels
Disclosure: I am part of Trade Nation's Influencer program and receive a monthly fee for using their TradingView charts in my analysis.
❤️ Please, support our work with like & comment! ❤️

EURUSD Set To Fall! SELL!
My dear friends,
Please, find my technical outlook for EURUSD below:
The price is coiling around a solid key level - 1.1779
Bias - Bearish
Technical Indicators: Pivot Points Low anticipates a potential price reversal.
Super trend shows a clear sell, giving a perfect indicators' convergence.
Goal - 1.1759
Safe Stop Loss - 1.1790
About Used Indicators:
The pivot point itself is simply the average of the high, low and closing prices from the previous trading day.
Disclosure: I am part of Trade Nation's Influencer program and receive a monthly fee for using their TradingView charts in my analysis.
———————————
WISH YOU ALL LUCK

USDCHF Massive Short! SELL!
My dear friends,
Please, find my technical outlook for USDCHF below:
The price is coiling around a solid key level - 0.7961
Bias - Bearish
Technical Indicators: Pivot Points High anticipates a potential price reversal.
Super trend shows a clear sell, giving a perfect indicators' convergence.
Goal - 0.7924
About Used Indicators:
The pivot point itself is simply the average of the high, low and closing prices from the previous trading day.
Disclosure: I am part of Trade Nation's Influencer program and receive a monthly fee for using their TradingView charts in my analysis.
———————————
WISH YOU ALL LUCK

#026: USD/CHF SHORT Investment Opportunity
The USD/CHF is in a key resistance area after a bullish extension that showed signs of exhaustion. Hello, I'm Andrea Russo, an independent Forex trader and prop trader with $200,000 in capital under management. Thank you in advance for your time.
Price action shows a clear rejection from recent highs, with the formation of indecision candles followed by bearish pressure.
Technical indicators confirm this reading: the RSI has reached the overbought zone while the MACD is beginning to diverge, suggesting a possible shift in momentum.
In terms of volume, the main cluster has been touched, indicating a likely redistribution rather than a continuation of the trend.
The intermarket environment also supports this view: the dollar is showing signs of relative weakness, while the Swiss franc is maintaining a defensive stance, typical during correction phases.
In summary, we are in a situation where the odds favor a bearish correction, with technical targets set lower than current values.

$LINK – PREMIUM PUMP, DISCOUNT DUMP? THE SQUEEZE SETUP EXPLAINEDLINK – PREMIUM PUMP, DISCOUNT DUMP? THE SQUEEZE SETUP EXPLAINED
Traders,
LINK — and likely the broader crypto market — is setting up for a premium squeeze that turns into a discount dump.
ANALYSIS
On Binance Perpetuals you can see longs piling in near $24 while price stalls → CVD pushes up, price doesn’t. That’s buying with no progress = bearish absorption with CVD non-confirmation. Check the data here ibb.co
Aggregated Spot CVD (all exchanges) is flat. No real spot demand → only leveraged longs propping up price. Check the data here ibb.co
Price is now inside the Golden Pocket retracement zone. High-probability reaction area where strong hands fade late longers.
Measuring swing low → swing high (06 Sep – 13 Sep), price is right at the Value Area High (VAH). This is the edge of acceptance.
Confluence: we’re also tagging the upper Anchored VWAP band (green line) from both the swing high and the swing low.
→ Why this matters: Anchored VWAP tracks the average cost basis of participants from a chosen pivot. When the swing low → high AVWAP band and the swing high → low AVWAP band overlap in the same zone, it creates double confluence: longs from the bottom see this as “expensive” and reduce risk, while shorts from the top defend their break-even. Historically, these overlaps act as strong rejection zones unless fresh spot demand breaks through.
MY TAKE
Expecting rejection at $24 and a move back toward $21 (blue AVWAP test). I think - based on data - that we might move even lower.
Setup = trapped longs at premium + no spot demand + strong confluence of VAH, Golden Pocket, and dual AVWAP resistance.
Invalidation = acceptance above $25 with spot CVD joining the move.

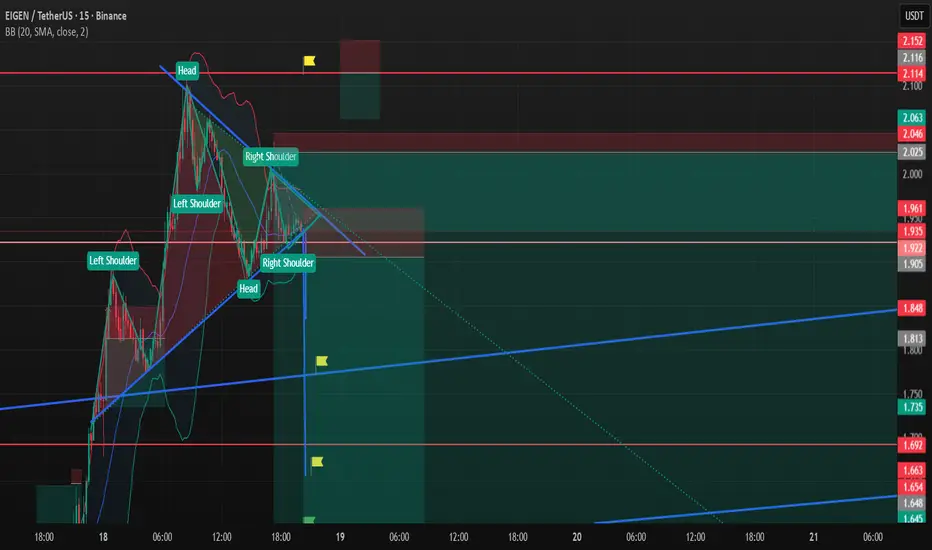
Eigen Short SetupI couldnt publish targets for the last idea it was in rush here I am for the second chart of the same position and also I added a new short position you can follow if you couldnt catch
There is both bullish and bearish head and shoulder formation I assume bearish version will work
Always manage your own risks this is not a investment advise I am not responsible neither your loss nor profit.
Targets
TP1 Blue trendline
TP2 1.658
TP3 1.590
GOLD Will Go Lower From Resistance! Sell!
Please, check our technical outlook for GOLD.
Time Frame: 1h
Current Trend: Bearish
Sentiment: Overbought (based on 7-period RSI)
Forecast: Bearish
The market is trading around a solid horizontal structure 3,699.37.
The above observations make me that the market will inevitably achieve 3,660.31 level.
P.S
The term oversold refers to a condition where an asset has traded lower in price and has the potential for a price bounce.
Overbought refers to market scenarios where the instrument is traded considerably higher than its fair value. Overvaluation is caused by market sentiments when there is positive news.
Like and subscribe and comment my ideas if you enjoy them!

EURAUD Will Go Down! Short!
Take a look at our analysis for EURAUD.
Time Frame: 1h
Current Trend: Bearish
Sentiment: Overbought (based on 7-period RSI)
Forecast: Bearish
The market is approaching a key horizontal level 1.780.
Considering the today's price action, probabilities will be high to see a movement to 1.774.
P.S
Overbought describes a period of time where there has been a significant and consistent upward move in price over a period of time without much pullback.
Like and subscribe and comment my ideas if you enjoy them!

GOLD SELLERS WILL DOMINATE THE MARKET|SHORT
GOLD SIGNAL
Trade Direction: short
Entry Level: 3,698.25
Target Level: 3,667.27
Stop Loss: 3,718.92
RISK PROFILE
Risk level: medium
Suggested risk: 1%
Timeframe: 1h
Disclosure: I am part of Trade Nation's Influencer program and receive a monthly fee for using their TradingView charts in my analysis.
✅LIKE AND COMMENT MY IDEAS✅

AUD/NZD BEST PLACE TO SELL FROM|SHORT
Hello, Friends!
Previous week’s green candle means that for us the AUD/NZD pair is in the uptrend. And the current movement leg was also up but the resistance line will be hit soon and upper BB band proximity will signal an overbought condition so we will go for a counter-trend short trade with the target being at 1.118.
Disclosure: I am part of Trade Nation's Influencer program and receive a monthly fee for using their TradingView charts in my analysis.
✅LIKE AND COMMENT MY IDEAS✅

CAD/CHF BEARS ARE STRONG HERE|SHORT
Hello, Friends!
CAD/CHF is trending down which is obvious from the red colour of the previous weekly candle. However, the price has locally surged into the overbought territory. Which can be told from its proximity to the BB upper band. Which presents a great trend following opportunity for a short trade from the resistance line above towards the demand level of 0.570.
Disclosure: I am part of Trade Nation's Influencer program and receive a monthly fee for using their TradingView charts in my analysis.
✅LIKE AND COMMENT MY IDEAS✅

Going back to covid lows? This bull market has reached its top. Things are not looking good geopolitically for India. This should be it or max 90k. if it looses 80k, then the game is over. See you at covid lows in an 12-18 months. Good luck.
Not a financial advise.

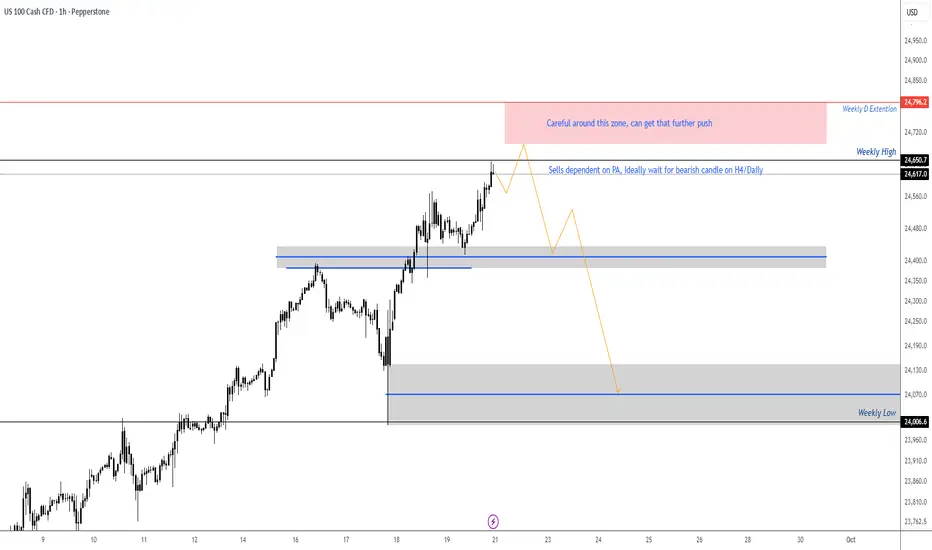
NASDAQ - setting up for Bearish SetupLooking for the bearish signal or the H4/Daily time frame, might get that final push for the D extension on the weekly timeframe, opening of the week might get a small pullback then continuation to the upside. Trade will be validated only if we get bearish PA setup on the H4/Daily. Looking for the setup to create a turn shape then can look for potential entries. If price does not present a bearish setup on the H4/Daily then the plan is no longer valid.
GBP/USD - 1H Forecast - YoYo Trade Setups🇬🇧🇺🇸 GBP/USD – 1H Breakdown
Cable’s been wildin’ 🤯 — we smashed into that daily imbalance, tapped supply, and now price is bleeding lower straight into demand.
🔑 What’s Cooking:
Price tagged the Daily IMB + 71% retrace, then dumped.
Now chilling near demand around 1.345 – 1.348 (possible snack stop 🍫).
If bulls defend here → we get a bounce back toward 1.357 – 1.360 supply for a cheeky liquidity grab 🏹.
From there? Expect a heavy distribution dump back toward 1.3350 lows 📉
🎯 Playbook:
Demand bounce → push into 1H / 4H supply.
Reject at supply → sell-off continuation.
🔍 Outlook
Short-term: Relief bounce incoming 🕺
Mid-term: Looking heavy, bears wanna drag this lower.
Bias : Bounce first → then bigger dump 🚀🔪

SPY: Bearish Continuation & Short Trade
SPY
- Classic bearish setup
- Our team expects bearish continuation
SUGGESTED TRADE:
Swing Trade
Short SPY
Entry Point - 663.63
Stop Loss - 664.95
Take Profit - 661.51
Our Risk - 1%
Start protection of your profits from lower levels
Disclosure: I am part of Trade Nation's Influencer program and receive a monthly fee for using their TradingView charts in my analysis.
❤️ Please, support our work with like & comment! ❤️

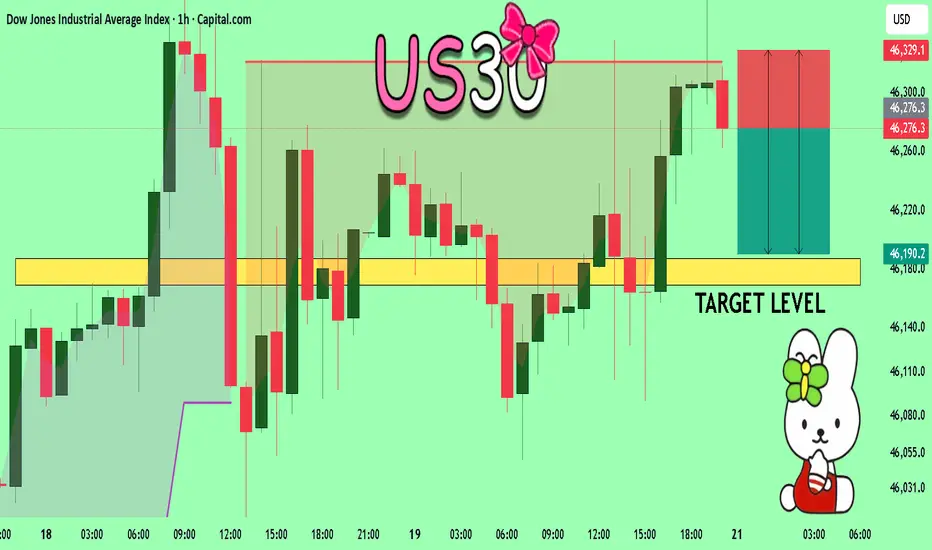
US30 Will Collapse! SELL!
My dear friends,
My technical analysis for US30 is below:
The market is trading on 46276 pivot level.
Bias - Bearish
Technical Indicators: Both Super Trend & Pivot HL indicate a highly probable Bearish continuation.
Target - 46187
Recommended Stop Loss - 46329
About Used Indicators:
A pivot point is a technical analysis indicator, or calculations, used to determine the overall trend of the market over different time frames.
Disclosure: I am part of Trade Nation's Influencer program and receive a monthly fee for using their TradingView charts in my analysis.
———————————
WISH YOU ALL LUCK
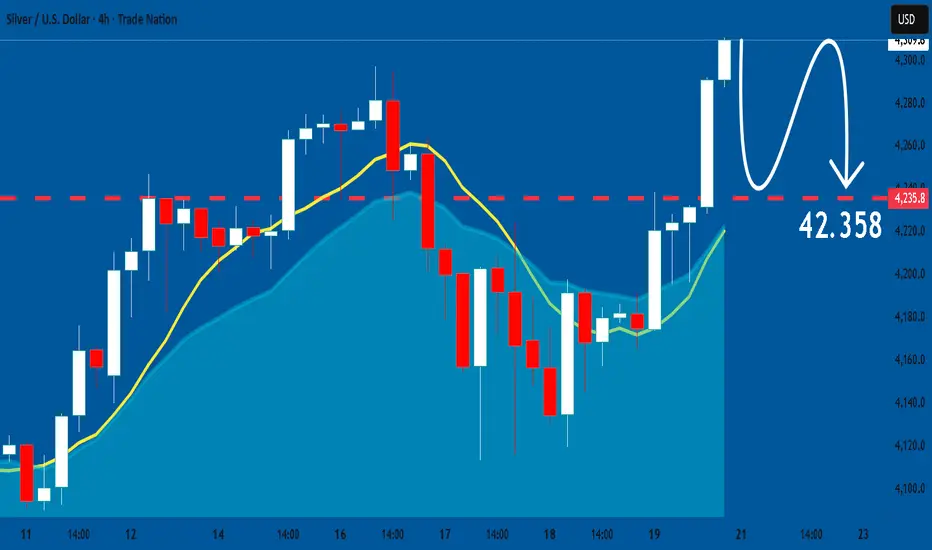
SILVER The Target Is DOWN! SELL!
My dear friends,
Please, find my technical outlook for SILVER below:
The instrument tests an important psychological level 43.096
Bias - Bearish
Technical Indicators: Supper Trend gives a precise Bearish signal, while Pivot Point HL predicts price changes and potential reversals in the market.
Target - 42.342
About Used Indicators:
Super-trend indicator is more useful in trending markets where there are clear uptrends and downtrends in price.
Disclosure: I am part of Trade Nation's Influencer program and receive a monthly fee for using their TradingView charts in my analysis.
———————————
WISH YOU ALL LUCK

APPLE Buyers In Panic! SELL!
My dear subscribers,
APPLE looks like it will make a good move, and here are the details:
The market is trading on 245.18 pivot level.
Bias - Bearish
My Stop Loss - 247.18
Technical Indicators: Both Super Trend & Pivot HL indicate a highly probable Bearish continuation.
Target - 241.25
About Used Indicators:
The average true range (ATR) plays an important role in 'Supertrend' as the indicator uses ATR to calculate its value. The ATR indicator signals the degree of price volatility.
Disclosure: I am part of Trade Nation's Influencer program and receive a monthly fee for using their TradingView charts in my analysis.
———————————
WISH YOU ALL LUCK

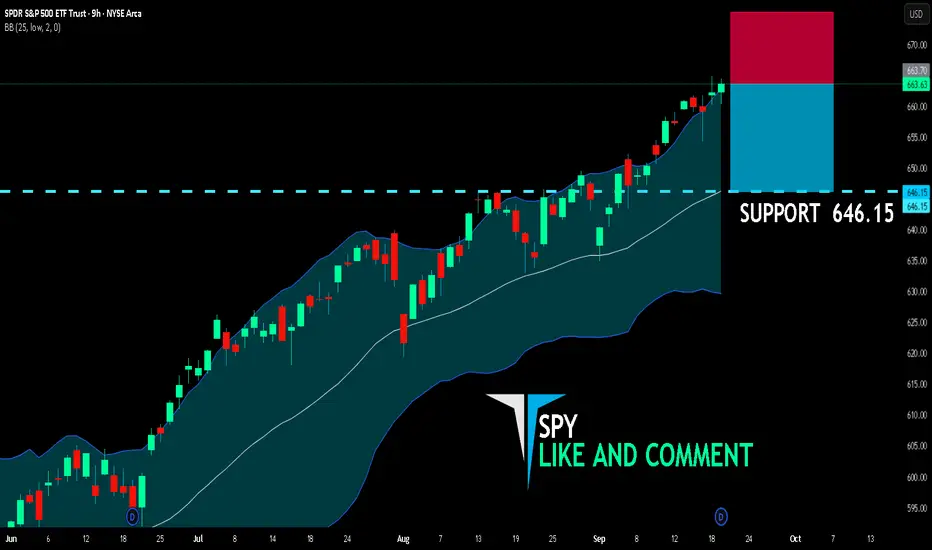
SPY SHORT FROM RESISTANCE
SPY SIGNAL
Trade Direction: short
Entry Level: 663.70
Target Level: 646.15
Stop Loss: 675.36
RISK PROFILE
Risk level: medium
Suggested risk: 1%
Timeframe: 9h
Disclosure: I am part of Trade Nation's Influencer program and receive a monthly fee for using their TradingView charts in my analysis.
✅LIKE AND COMMENT MY IDEAS✅
The Big Short? BTCHere we have an ascending channel on the 15 minute chart bulls have been weak since our recent top. I feel a strong move is coming here soon in the market time to lock in.

SILVER: Market Sentiment & Price Action
Remember that we can not, and should not impose our will on the market but rather listen to its whims and make profit by following it. And thus shall be done today on the SILVER pair which is likely to be pushed down by the bears so we will sell!
Disclosure: I am part of Trade Nation's Influencer program and receive a monthly fee for using their TradingView charts in my analysis.
❤️ Please, support our work with like & comment! ❤️
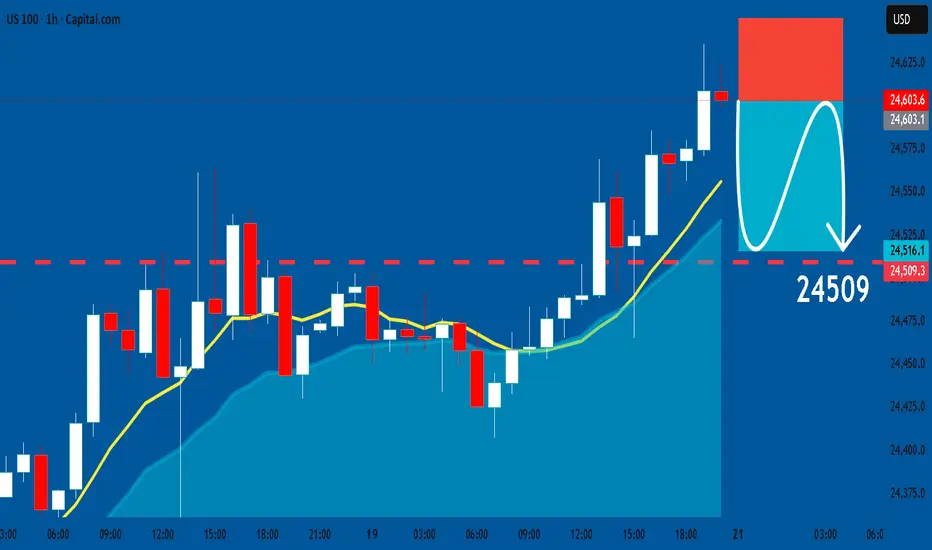
US100: Short Signal with Entry/SL/TP
US100
- Classic bearish formation
- Our team expects fall
SUGGESTED TRADE:
Swing Trade
Sell US100
Entry Level - 24603
Sl - 24651
Tp - 24509
Our Risk - 1%
Start protection of your profits from lower levels
Disclosure: I am part of Trade Nation's Influencer program and receive a monthly fee for using their TradingView charts in my analysis.
❤️ Please, support our work with like & comment! ❤️