GBPNZD: Short Trade with Entry/SL/TP
GBPNZD
- Classic bearish pattern
- Our team expects retracement
SUGGESTED TRADE:
Swing Trade
Sell GBPNZD
Entry - 2.2780
Stop - 2.2797
Take - 2.2747
Our Risk - 1%
Start protection of your profits from lower levels
Disclosure: I am part of Trade Nation's Influencer program and receive a monthly fee for using their TradingView charts in my analysis.
❤️ Please, support our work with like & comment! ❤️
Short

BTCUSD Short: A Corrective Decline is AnticipatedHello, traders! The price auction for BTCUSD has been clearly defined by a large ascending channel. This bullish structure has guided the price higher through a series of higher highs and higher lows, with the demand zone 2 at the 110000 level acting as a major foundational low. The initiative has remained firmly with the buyers throughout this trend.
Currently, the auction is at a critical inflection point, having reached the upper supply line of the ascending channel. This test of the highs comes after a sustained rally, and the market is now in a key area where selling pressure is expected to emerge. This price action could indicate a phase of trend exhaustion.
The primary scenario anticipates a short-term corrective move from these highs. The expectation is that after a potential final push higher, the price will be rejected from the channel's resistance. A confirmed reversal would signal a temporary shift in control to sellers. The take-profit for this corrective play is therefore set at the 113400 level, targeting the major horizontal demand zone. Manage your risk!

EURUSD Short: Rejection from Channel TopHello, traders! The price auction for EURUSD has been operating within a well-defined ascending channel. This bullish structure has been confirmed by multiple pivot points, with buyers defending the ascending demand line and sellers consistently emerging at the upper supply zone near the 1.1720 level. This has established a clear rotational pattern between the channel's boundaries.
Currently, the auction is at a critical inflection point, once again testing the upper boundary of this channel. The price has rallied to meet the ascending supply line, which forms a strong confluence of resistance with the horizontal 1.1720 - 1.1740 supply area. This is the same zone where previous rallies have failed, making it a key battleground.
The primary scenario anticipates a rejection from this resistance confluence, continuing the established pattern of rotation. The expectation is that sellers will defend the supply zone, initiate a new downward move, and break the current support level. The take-profit for this rotational play is therefore set at 1.1655 points, targeting a key intermediate liquidity area. Manage your risk!

Bitcoin will reach resistance line of channel and then dropHello traders, I want share with you my opinion about Bitcoin. The current market structure for Bitcoin is defined by a well-established upward channel that was formed after the price broke out of a prior triangle consolidation. This bullish pattern has been guiding the price action of BTC higher through a clear sequence of higher highs and higher lows between its dynamic support and resistance lines. The market has just completed another full upward rotation within this structure and is now positioned at a critical inflection point. Currently, the price is directly testing the upper boundary of the channel, which forms a powerful confluence of resistance with the horizontal 113500 - 114000 seller zone. This area has historically been a strong barrier where price has reversed on previous occasions. The primary working hypothesis is a short, rotational scenario, based on the expectation that sellers will once again defend this significant resistance confluence. A confirmed rejection from this seller zone would validate the integrity of the upward channel and likely initiate a new corrective swing to the downside, which would first need to break the current support level at 113500. Therefore, the TP is logically placed at 112400 points, a target that aligns perfectly with the ascending support line of the channel. Please share this idea with your friends and click Boost 🚀

CADJPY: Forecast & Trading Plan
The recent price action on the CADJPY pair was keeping me on the fence, however, my bias is slowly but surely changing into the bearish one and I think we will see the price go down.
Disclosure: I am part of Trade Nation's Influencer program and receive a monthly fee for using their TradingView charts in my analysis.
❤️ Please, support our work with like & comment! ❤️

GOLD: Bearish Continuation & Short Signal
GOLD
- Classic bearish setup
- Our team expects bearish continuation
SUGGESTED TRADE:
Swing Trade
Short GOLD
Entry Point - 3650.7
Stop Loss - 3658.4
Take Profit - 3635.5
Our Risk - 1%
Start protection of your profits from lower levels
Disclosure: I am part of Trade Nation's Influencer program and receive a monthly fee for using their TradingView charts in my analysis.
❤️ Please, support our work with like & comment! ❤️

GOLD: Short Trading Opportunity
GOLD
- Classic bearish formation
- Our team expects fall
SUGGESTED TRADE:
Swing Trade
Sell GOLD
Entry Level - 3651.1
Sl - 3657.8
Tp - 3637.2
Our Risk - 1%
Start protection of your profits from lower levels
Disclosure: I am part of Trade Nation's Influencer program and receive a monthly fee for using their TradingView charts in my analysis.
❤️ Please, support our work with like & comment! ❤️

USDJPY Under Pressure! SELL!
My dear subscribers,
This is my opinion on the USDJPY next move:
The instrument tests an important psychological level 147.89
Bias - Bearish
Technical Indicators: Supper Trend gives a precise Bearish signal, while Pivot Point HL predicts price changes and potential reversals in the market.
Target - 147.36
About Used Indicators:
On the subsequent day, trading above the pivot point is thought to indicate ongoing bullish sentiment, while trading below the pivot point indicates bearish sentiment.
Disclosure: I am part of Trade Nation's Influencer program and receive a monthly fee for using their TradingView charts in my analysis.
———————————
WISH YOU ALL LUCK

GOLD Will Go Lower From Resistance! Sell!
Here is our detailed technical review for GOLD.
Time Frame: 2h
Current Trend: Bearish
Sentiment: Overbought (based on 7-period RSI)
Forecast: Bearish
The market is on a crucial zone of supply 3,651.90.
The above-mentioned technicals clearly indicate the dominance of sellers on the market. I recommend shorting the instrument, aiming at 3,609.43 level.
P.S
Overbought describes a period of time where there has been a significant and consistent upward move in price over a period of time without much pullback.
Disclosure: I am part of Trade Nation's Influencer program and receive a monthly fee for using their TradingView charts in my analysis.
Like and subscribe and comment my ideas if you enjoy them!

NZDUSD Will Go Down From Resistance! Short!
Take a look at our analysis for NZDUSD.
Time Frame: 1D
Current Trend: Bearish
Sentiment: Overbought (based on 7-period RSI)
Forecast: Bearish
The price is testing a key resistance 0.596.
Taking into consideration the current market trend & overbought RSI, chances will be high to see a bearish movement to the downside at least to 0.586 level.
P.S
Please, note that an oversold/overbought condition can last for a long time, and therefore being oversold/overbought doesn't mean a price rally will come soon, or at all.
Disclosure: I am part of Trade Nation's Influencer program and receive a monthly fee for using their TradingView charts in my analysis.
Like and subscribe and comment my ideas if you enjoy them!

GOLD BEST PLACE TO SELL FROM|SHORT
GOLD SIGNAL
Trade Direction: short
Entry Level: 3,653.83
Target Level: 3,613.89
Stop Loss: 3,680.27
RISK PROFILE
Risk level: medium
Suggested risk: 1%
Timeframe: 2h
Disclosure: I am part of Trade Nation's Influencer program and receive a monthly fee for using their TradingView charts in my analysis.
✅LIKE AND COMMENT MY IDEAS✅

NZD/USD BEARS ARE STRONG HERE|SHORT
NZD/USD SIGNAL
Trade Direction: short
Entry Level: 0.596
Target Level: 0.589
Stop Loss: 0.601
RISK PROFILE
Risk level: medium
Suggested risk: 1%
Timeframe: 9h
Disclosure: I am part of Trade Nation's Influencer program and receive a monthly fee for using their TradingView charts in my analysis.
✅LIKE AND COMMENT MY IDEAS✅

GBP/USD BEST PLACE TO SELL FROM|SHORT
Hello, Friends!
We are targeting the 1.334 level area with our short trade on GBP/USD which is based on the fact that the pair is overbought on the BB band scale and is also approaching a resistance line above thus going us a good entry option.
Disclosure: I am part of Trade Nation's Influencer program and receive a monthly fee for using their TradingView charts in my analysis.
✅LIKE AND COMMENT MY IDEAS✅

EUR/USD BEARS ARE STRONG HERE|SHORT
Hello, Friends!
EUR/USD is making a bullish rebound on the 12H TF and is nearing the resistance line above while we are generally bearish biased on the pair due to our previous 1W candle analysis, thus making a trend-following short a good option for us with the target being the 1.157 level.
Disclosure: I am part of Trade Nation's Influencer program and receive a monthly fee for using their TradingView charts in my analysis.
✅LIKE AND COMMENT MY IDEAS✅

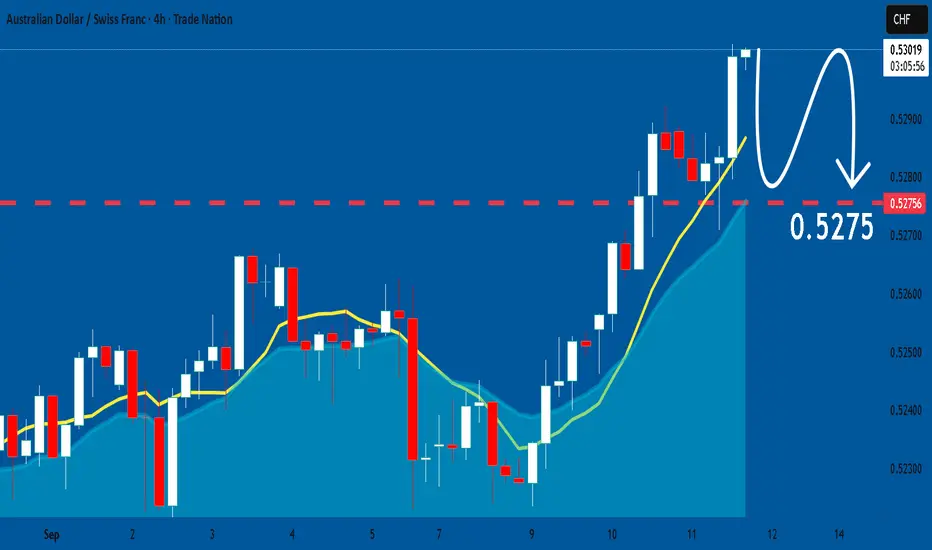
AUDCHF: Bearish Continuation is Expected! Here is Why:
It is essential that we apply multitimeframe technical analysis and there is no better example of why that is the case than the current AUDCHF chart which, if analyzed properly, clearly points in the downward direction.
Disclosure: I am part of Trade Nation's Influencer program and receive a monthly fee for using their TradingView charts in my analysis.
❤️ Please, support our work with like & comment! ❤️
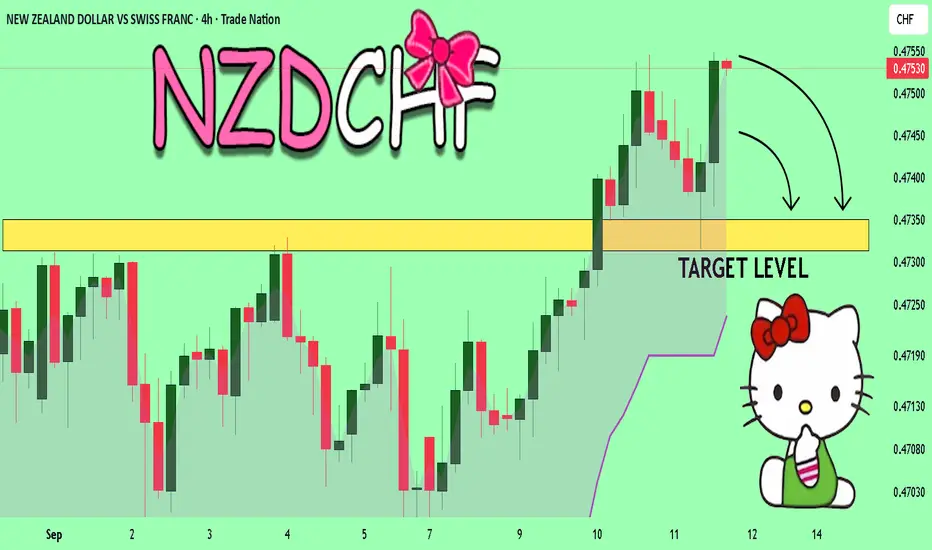
NZDCHF Technical Analysis! SELL!
My dear friends,
Please, find my technical outlook for NZDCHF below:
The price is coiling around a solid key level - 0.4352
Bias - Bearish
Technical Indicators: Pivot Points High anticipates a potential price reversal.
Super trend shows a clear sell, giving a perfect indicators' convergence.
Goal - 0.4735
About Used Indicators:
The pivot point itself is simply the average of the high, low and closing prices from the previous trading day.
Disclosure: I am part of Trade Nation's Influencer program and receive a monthly fee for using their TradingView charts in my analysis.
———————————
WISH YOU ALL LUCK
GBPUSD A Fall Expected! SELL!
My dear subscribers,
My technical analysis for GBPUSD is below:
The price is coiling around a solid key level - 1.3577
Bias - Bearish
Technical Indicators: Pivot Points Low anticipates a potential price reversal.
Super trend shows a clear sell, giving a perfect indicators' convergence.
Goal - 1.3550
My Stop Loss - 1.3590
About Used Indicators:
By the very nature of the supertrend indicator, it offers firm support and resistance levels for traders to enter and exit trades. Additionally, it also provides signals for setting stop losses
Disclosure: I am part of Trade Nation's Influencer program and receive a monthly fee for using their TradingView charts in my analysis.
———————————
WISH YOU ALL LUCK

AUDNZD: Bears Will Push Lower
The analysis of the AUDNZD chart clearly shows us that the pair is finally about to tank due to the rising pressure from the sellers.
Disclosure: I am part of Trade Nation's Influencer program and receive a monthly fee for using their TradingView charts in my analysis.
❤️ Please, support our work with like & comment! ❤️

EURUSD: Short Trade Explained
EURUSD
- Classic bearish formation
- Our team expects pullback
SUGGESTED TRADE:
Swing Trade
Short EURUSD
Entry - 1.1723
Sl - 1.1732
Tp - 1.1707
Our Risk - 1%
Start protection of your profits from lower levels
Disclosure: I am part of Trade Nation's Influencer program and receive a monthly fee for using their TradingView charts in my analysis.
❤️ Please, support our work with like & comment! ❤️

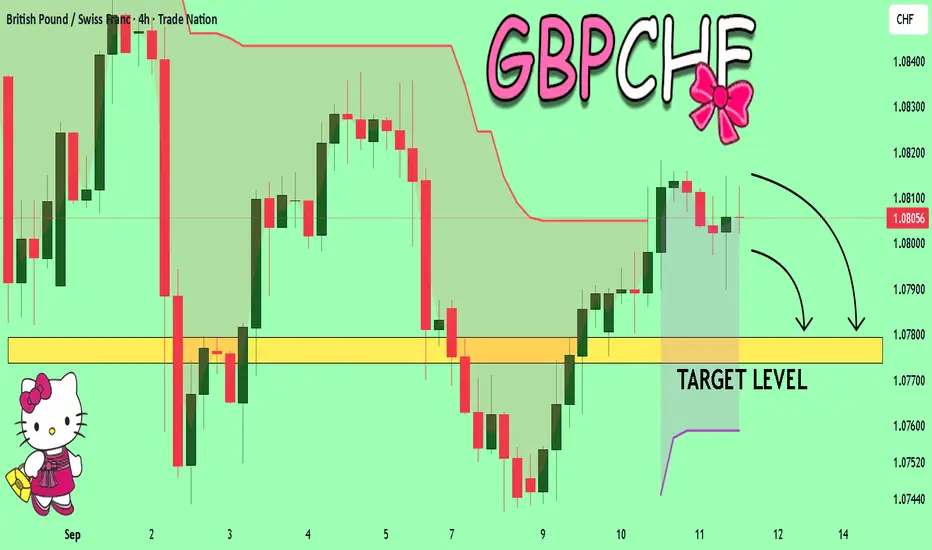
GBPCHF Set To Fall! SELL!
My dear friends,
My technical analysis for GBPCHF is below:
The market is trading on 1.0803 pivot level.
Bias - Bearish
Technical Indicators: Both Super Trend & Pivot HL indicate a highly probable Bearish continuation.
Target - 1.0779
About Used Indicators:
A pivot point is a technical analysis indicator, or calculations, used to determine the overall trend of the market over different time frames.
Disclosure: I am part of Trade Nation's Influencer program and receive a monthly fee for using their TradingView charts in my analysis.
———————————
WISH YOU ALL LUCK
GOLD Trading Opportunity! SELL!
My dear followers,
I analysed this chart on GOLD and concluded the following:
The market is trading on 3635.2 pivot level.
Bias - Bearish
Technical Indicators: Both Super Trend & Pivot HL indicate a highly probable Bearish continuation.
Target - 3624.7
Safe Stop Loss - 3641.7
About Used Indicators:
A super-trend indicator is plotted on either above or below the closing price to signal a buy or sell. The indicator changes color, based on whether or not you should be buying. If the super-trend indicator moves below the closing price, the indicator turns green, and it signals an entry point or points to buy.
Disclosure: I am part of Trade Nation's Influencer program and receive a monthly fee for using their TradingView charts in my analysis.
———————————
WISH YOU ALL LUCK

USD/JPY - Weak Support suggests breakoutHi all traders. Ive done a few breakdowns of this market now all following similar fundamentals.
Here is my conclusion:
Market is currently ranging. We are approaching a Strong 8H Supply zone facing close to a much tested Support.
Im looking for a strong rejection off this Supply into this support with enough pressure to make Bearish movements through this zone. Monthly Imbalance suggests Buyers are sitting lower so I will be aiming beyond this support.
Good luck to all and I follow me for more updates.

US30 SHORT FROM RESISTANCE
US30 SIGNAL
Trade Direction: short
Entry Level: 45,509.9
Target Level: 43,969.8
Stop Loss: 46,527.7
RISK PROFILE
Risk level: medium
Suggested risk: 1%
Timeframe: 1D
Disclosure: I am part of Trade Nation's Influencer program and receive a monthly fee for using their TradingView charts in my analysis.
✅LIKE AND COMMENT MY IDEAS✅
