EURAUD: Bearish Continuation & Short Signal
EURAUD
- Classic bearish pattern
- Our team expects retracement
SUGGESTED TRADE:
Swing Trade
Sell EURAUD
Entry - 1.7550
Stop - 1.7566
Take - 1.7523
Our Risk - 1%
Start protection of your profits from lower levels
Disclosure: I am part of Trade Nation's Influencer program and receive a monthly fee for using their TradingView charts in my analysis.
❤️ Please, support our work with like & comment! ❤️
Short

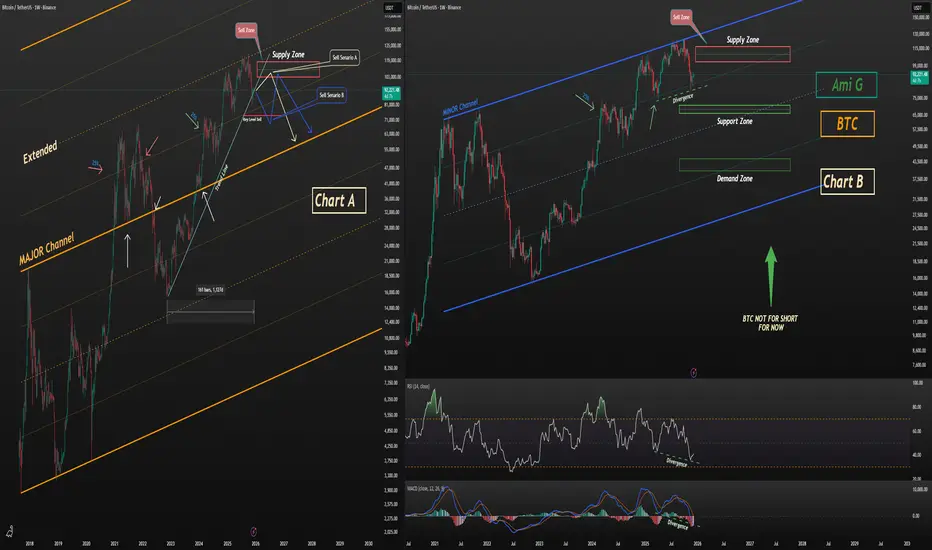
Bitcoin Short Setup – Why It’s Still Early📝 Bitcoin BINANCE:BTCUSDT Short Setup – Why It’s Still Early
At the moment, opening a short position on Bitcoin is premature.
This does not signal a buying opportunity here — it simply highlights that short positions (especially with leverage) carry high risk from this zone.
📊 Chart A – Major Channel Structure
Bitcoin is trading inside a major channel.
After breaking out of this structure and extending beyond it, price has shown clean and consistent reactions to the extended boundaries.
The latest rejection from the upper zone also aligns with the 50% mid-line, further confirming the significance of this major channel.
📊 Chart B – Short-Term Channel
The shorter-term channel also justifies the recent top.
However, shorting from the current zone is still too early, and here’s why:
Price has reached the 25% reaction zone on both charts
This level has repeatedly acted as a sensitive reaction point across multiple timeframes
Bitcoin is sitting on its 160-week trendline
Clear bullish divergence appears on both MACD and RSI
Given these factors, initiating a short here is high-risk and not technically justified yet.
📉 Short Scenarios (Only If Confirmed)
Scenario A — Chart A
Wait for price to revisit the marked supply zone, then short only with a clear trigger.
Scenario B — Chart B
A short becomes valid after breaking the key level, followed by a pullback into the supply zone.
📌 Outlook
My base view: Bitcoin is likely to correct toward the demand zone shown on Chart B.
📣 Final Note
Stay safe, trade smart.
Follow the profile so you don’t miss the daily live swing trades and day-trading setups shared here on TradingView.
EURUSD: Short Trading Opportunity
EURUSD
- Classic bearish setup
- Our team expects bearish continuation
SUGGESTED TRADE:
Swing Trade
Short EURUSD
Entry Point - 1.1637
Stop Loss - 1.1643
Take Profit - 1.1629
Our Risk - 1%
Start protection of your profits from lower levels
Disclosure: I am part of Trade Nation's Influencer program and receive a monthly fee for using their TradingView charts in my analysis.
❤️ Please, support our work with like & comment! ❤️

CHFJPY Buyers In Panic! SELL!
My dear friends,
Please, find my technical outlook for CHFJPY below:
The instrument tests an important psychological level 194.94
Bias - Bearish
Technical Indicators: Supper Trend gives a precise Bearish signal, while Pivot Point HL predicts price changes and potential reversals in the market.
Target - 194.09
About Used Indicators:
Super-trend indicator is more useful in trending markets where there are clear uptrends and downtrends in price.
Disclosure: I am part of Trade Nation's Influencer program and receive a monthly fee for using their TradingView charts in my analysis.
———————————
WISH YOU ALL LUCK

GOLD Trading Opportunity! BUY!
My dear friends,
GOLD looks like it will make a good move, and here are the details:
The market is trading on 4196.0 pivot level.
Bias - Bullish
Technical Indicators: Supper Trend generates a clear long signal while Pivot Point HL is currently determining the overall Bullish trend of the market.
Goal - 4203.1
Recommended Stop Loss - 4192.0
About Used Indicators:
Pivot points are a great way to identify areas of support and resistance, but they work best when combined with other kinds of technical analysis
Disclosure: I am part of Trade Nation's Influencer program and receive a monthly fee for using their TradingView charts in my analysis.
———————————
WISH YOU ALL LUCK

EURJPY Will Go Lower From Resistance! Sell!
Here is our detailed technical review for EURJPY.
Time Frame: 4h
Current Trend: Bearish
Sentiment: Overbought (based on 7-period RSI)
Forecast: Bearish
The market is trading around a solid horizontal structure 182.247.
The above observations make me that the market will inevitably achieve 181.125 level.
P.S
We determine oversold/overbought condition with RSI indicator.
When it drops below 30 - the market is considered to be oversold.
When it bounces above 70 - the market is considered to be overbought.
Like and subscribe and comment my ideas if you enjoy them!

AUDCAD Will Go Down! Sell!
Take a look at our analysis for AUDCAD.
Time Frame: 4h
Current Trend: Bearish
Sentiment: Overbought (based on 7-period RSI)
Forecast: Bearish
The market is testing a major horizontal structure 0.924.
Taking into consideration the structure & trend analysis, I believe that the market will reach 0.918 level soon.
P.S
The term oversold refers to a condition where an asset has traded lower in price and has the potential for a price bounce.
Overbought refers to market scenarios where the instrument is traded considerably higher than its fair value. Overvaluation is caused by market sentiments when there is positive news.
Like and subscribe and comment my ideas if you enjoy them!

EUR/GBP SHORT FROM RESISTANCE
Hello, Friends!
It makes sense for us to go short on EUR/GBP right now from the resistance line above with the target of 0.872 because of the confluence of the two strong factors which are the general downtrend on the previous 1W candle and the overbought situation on the lower TF determined by it’s proximity to the upper BB band.
Disclosure: I am part of Trade Nation's Influencer program and receive a monthly fee for using their TradingView charts in my analysis.
✅LIKE AND COMMENT MY IDEAS✅

USOIL BEARS WILL DOMINATE THE MARKET|SHORT
USOIL SIGNAL
Trade Direction: short
Entry Level: 58.39
Target Level: 57.94
Stop Loss: 58.69
RISK PROFILE
Risk level: medium
Suggested risk: 1%
Timeframe: 1h
Disclosure: I am part of Trade Nation's Influencer program and receive a monthly fee for using their TradingView charts in my analysis.
✅LIKE AND COMMENT MY IDEAS✅

NZDUSD Will Move Lower! Sell!
Here is our detailed technical review for NZDUSD.
Time Frame: 1h
Current Trend: Bearish
Sentiment: Overbought (based on 7-period RSI)
Forecast: Bearish
The market is approaching a significant resistance area 0.578.
Due to the fact that we see a positive bearish reaction from the underlined area, I strongly believe that sellers will manage to push the price all the way down to 0.577 level.
P.S
The term oversold refers to a condition where an asset has traded lower in price and has the potential for a price bounce.
Overbought refers to market scenarios where the instrument is traded considerably higher than its fair value. Overvaluation is caused by market sentiments when there is positive news.
Like and subscribe and comment my ideas if you enjoy them!

EURUSD Will Go Down! Short!
Please, check our technical outlook for EURUSD.
Time Frame: 4h
Current Trend: Bearish
Sentiment: Overbought (based on 7-period RSI)
Forecast: Bearish
The market is approaching a key horizontal level 1.163.
Considering the today's price action, probabilities will be high to see a movement to 1.160.
P.S
Please, note that an oversold/overbought condition can last for a long time, and therefore being oversold/overbought doesn't mean a price rally will come soon, or at all.
Like and subscribe and comment my ideas if you enjoy them!

GBP/USD BEARS ARE GAINING STRENGTH|SHORT
GBP/USD SIGNAL
Trade Direction: short
Entry Level: 1.332
Target Level: 1.330
Stop Loss: 1.333
RISK PROFILE
Risk level: medium
Suggested risk: 1%
Timeframe: 1h
Disclosure: I am part of Trade Nation's Influencer program and receive a monthly fee for using their TradingView charts in my analysis.
✅LIKE AND COMMENT MY IDEAS✅

Big Week for USD: USDJPY Approaches Major Sell Zone!Hey Traders,
In today's trading session we are monitoring USDJPY for a selling opportunity around the 155.750 zone. USDJPY is trading in a downtrend and is currently in a correction phase, approaching the trend area at 155.750, which acts as a key support-turned-resistance level.
On the fundamental side, recent U.S. data continues to support a weaker Dollar as markets increasingly price in a 25bps cut heading into the FOMC. With traders front-running the event, USD momentum remains fragile. If the market over-prices the move ahead of Wednesday, be cautious of the classic "buy the rumor, sell the fact" dynamic.
This broader Dollar softening environment supports further downside in USDJPY as long as the pair remains below the trend structure.
Trade safe,
Joe.

AUDNZD Will Fall! Short!
Take a look at our analysis for AUDNZD.
Time Frame: 2h
Current Trend: Bearish
Sentiment: Overbought (based on 7-period RSI)
Forecast: Bearish
The market is on a crucial zone of supply 1.149.
The above-mentioned technicals clearly indicate the dominance of sellers on the market. I recommend shorting the instrument, aiming at 1.146 level.
P.S
We determine oversold/overbought condition with RSI indicator.
When it drops below 30 - the market is considered to be oversold.
When it bounces above 70 - the market is considered to be overbought.
Like and subscribe and comment my ideas if you enjoy them!

SILVER Is Very Bearish! Sell!
Please, check our technical outlook for SILVER.
Time Frame: 1h
Current Trend: Bearish
Sentiment: Overbought (based on 7-period RSI)
Forecast: Bearish
The price is testing a key resistance 5,871.4.
Taking into consideration the current market trend & overbought RSI, chances will be high to see a bearish movement to the downside at least to 5,754.1 level.
P.S
Overbought describes a period of time where there has been a significant and consistent upward move in price over a period of time without much pullback.
Like and subscribe and comment my ideas if you enjoy them!

AUD/NZD SELLERS WILL DOMINATE THE MARKET|SHORT
Hello, Friends!
AUD-NZD uptrend evident from the last 1W green candle makes short trades more risky, but the current set-up targeting 1.142 area still presents a good opportunity for us to sell the pair because the resistance line is nearby and the BB upper band is close which indicates the overbought state of the AUD/NZD pair.
Disclosure: I am part of Trade Nation's Influencer program and receive a monthly fee for using their TradingView charts in my analysis.
✅LIKE AND COMMENT MY IDEAS✅

GOLD BEARISH BIAS RIGHT NOW| SHORT
GOLD SIGNAL
Trade Direction: short
Entry Level: 4,202.78
Target Level: 4,170.08
Stop Loss: 4,224.41
RISK PROFILE
Risk level: medium
Suggested risk: 1%
Timeframe: 1h
Disclosure: I am part of Trade Nation's Influencer program and receive a monthly fee for using their TradingView charts in my analysis.
✅LIKE AND COMMENT MY IDEAS✅

CVNA after the rebalancing - still stalking a shortIsn’t it remarkable how effectively Andrews Pitchforks perform?
After CVNA was rebalanced following its addition to the S&P 500, price moved directly to the centerline. From here, I’m watching for a short setup.
I’m even more encouraged, as this creates additional opportunity and $'s in profit. §8-)

EURUSD Short: Supply Holds — Pullback to 1.1610 in FocusHello, traders! The price action on EURUSD is unfolding within a well-defined technical structure shaped by an ascending Trend Line, with the market transitioning from consolidation into a corrective pullback. After a prolonged bullish advance, the pair formed a Head and Shoulders pattern near the upper Supply Zone around 1.16660, signaling exhaustion of buying momentum. Following this distribution phase, price broke below the neckline and started moving lower, showing a clear shift in short-term control toward sellers.
Currently, EURUSD spent time consolidating inside the highlighted Range, where multiple false breakouts occurred before bullish continuation resumed. However, the recent rejection from supply and the breakdown from the pattern suggest that upside momentum is weakening. Currently, the price is trading below the former range support and is approaching the Demand Zone near 1.16100, which also aligns with a key horizontal support level.
My scenario for the next move is a continuation toward the 1.16100 demand area, where buyers may attempt to slow the decline. A strong bullish reaction from this zone could trigger a corrective rebound back toward the broken structure. However, if the price fails to hold this demand, the bearish pressure may intensify and open the door for a deeper pullback. As long as the market remains below the 1.16660 supply, the short-term bias stays bearish. Manage your risk!

CHFJPY: Market Sentiment & Forecast
The recent price action on the CHFJPY pair was keeping me on the fence, however, my bias is slowly but surely changing into the bearish one and I think we will see the price go down.
Disclosure: I am part of Trade Nation's Influencer program and receive a monthly fee for using their TradingView charts in my analysis.
❤️ Please, support our work with like & comment! ❤️

GOLD: Short Trading Opportunity
GOLD
- Classic bearish formation
- Our team expects fall
SUGGESTED TRADE:
Swing Trade
Sell GOLD
Entry Level - 4203.5
Sl - 4211.4
Tp - 4191.2
Our Risk - 1%
Start protection of your profits from lower levels
Disclosure: I am part of Trade Nation's Influencer program and receive a monthly fee for using their TradingView charts in my analysis.
❤️ Please, support our work with like & comment! ❤️

AUDCAD Under Pressure! SELL!
My dear friends,
Please, find my technical outlook for AUDCAD below:
The price is coiling around a solid key level - 0.9195
Bias - Bearish
Technical Indicators: Pivot Points High anticipates a potential price reversal.
Super trend shows a clear sell, giving a perfect indicators' convergence.
Goal - 0.9182
Safe Stop Loss - 0.9202
About Used Indicators:
The pivot point itself is simply the average of the high, low and closing prices from the previous trading day.
Disclosure: I am part of Trade Nation's Influencer program and receive a monthly fee for using their TradingView charts in my analysis.
———————————
WISH YOU ALL LUCK

US30 Trading Opportunity! SELL!
My dear friends,
Please, find my technical outlook for US30 below:
The instrument tests an important psychological level 47934
Bias - Bearish
Technical Indicators: Supper Trend gives a precise Bearish signal, while Pivot Point HL predicts price changes and potential reversals in the market.
Target - 47694
About Used Indicators:
Super-trend indicator is more useful in trending markets where there are clear uptrends and downtrends in price.
Disclosure: I am part of Trade Nation's Influencer program and receive a monthly fee for using their TradingView charts in my analysis.
———————————
WISH YOU ALL LUCK
