Opportunity to Short Gold, day Tradingcan be interesting to watch this breakout and wait a great signal to try a trade. a Powerful resistance above protect the trade with a great risk/reward ratio, great volume in the breakout candle. please write comments to discuss this Trade
Shorting

$SPY - the LEVEL I CALLED is sooo in play - loving it!One of several follow ups i have posted on this $285 level which has been a great tradable level!
Enjoy.
xeenos trading - sending positive energy to all those watching!!

Dow is looking very bearish, text book rising wedge short opp?Without looking at the technicals, the sentiment surrounding the economy and world is very bearish as of current. Looking at the charts, we can see a possible abc count playing out, with the rising wedge making up the b to the correction. If the wedge breaks down and the fed stop quantitative easing I believe we will hit previous lows and lower of around 14000 which is a 61.80 % retrace of the this market cycle.

BNBUSDT Rising wedge and continuation of downtrend....?Crypto markets look like they are ready for at the very least a correction. Bnb has a lovely text book rising wedge which could yield massive profits! My ambitious target is the previous low however realistically the break of the falling wedge could be a correction to this current rally which upon finishing could take us to new highs. However, I am leaning more in line with the current daily downtrend, of a break down of the rising wedge to previous lows which is in inline with the global bearish sentiment.


A relação entre as EMA de 9, 50 e 200 dias com ETH/USDC...Essa interação está realmente única...
Reparem como o preço usou a EMA de 9 dias como suporte, rompeu a EMA de 50 dias, sentiu resistência da EMA de 200 dias, depois usou a de 50 como suporte, e rompeu a de 50 novamente para usar a de 9 dias como suporte!
Vamos esperar algum tempo e ficarmos atentos para observar se a EMA de 9 dias irá ser rompida, o que seria uma indicaçã de baixa, ou se ela atuará como suporte para depois o preço romper as resistências das médias exponenciais de 50 e 200 dias.
Na minha opinião, existe uma boa probabilidade do preço movimentar-se um pouco dentro do canal, para depois ROMPER A EMA DE 9 DIAS E DESVALORIZAR!
AVISO LEGAL: o conteúdo postado nessa página não é conselho financeiro e não deve ser entendido como tel. O propósito dos posts é a INFORMAÇÃO. Invista e faça trocas de ativos baseado no seu próprio julgamento e risco!

Never short Tesla?We have all heard the stories of people getting in trouble shorting Tesla. That was in the middle of the bull market. We are not in a bull market anymore. But Tesla still may not be the best short, this week. And here is why.


Shorting BTC again...BTC has shown correlation signs with global markets in the last months. I am shorting again.
Ratio P/L: + 5/1
Possible loss: 0.5%
Position levels:
SS: 5990
TP: 3401
SL: 6467
I will average a new short position around 4600 with a 0.75% wallet risk, and another one around 4000 with a 0.5% w risk.


scriptB showing nasdaq is toppingscriptB in scalp mode has shown great buy and sell opportunities over the previous years. however divergence is flagging at the top.
using scriptb with basic volume we can see price has risen on declining volume and as it approaches the top a juicy short can only be imminent.
to learn how to access these scripts please visit tradingscripts.best

BTC is going to test the bottom support trend line @ $6200
String bearish movement, at Day chart after two up moves, now going thru the base line, expected down to $6200 in 6 days.

BTC is going to test the support trend line @ $6200The SHORT trend at Week Chart continue. Double top at Day Chart, move thru the support, going to test to bottom trend line at $6200.

USDJPYThe price will goes with our direction
Note: this is not investment advise,This is for educational purpose only, this is just my opinion , i do this analysis in demo account, you can't make money or loss money through my opinion.

NZDJPY - Shorting Just a personal analysis and personal opinion on what will happen with the New Zealand Dollar against the Japanese Yen, it has shown really great swing with major zone being respected.
Don't take my word for it, do your own analysis and trust your own technical terms. ;)

Saying what we are all thinking......Well.....It's obvious at this point.
Bakkt friend buys future shorts
Whale friend dumps market
Bakkt friend pays back whale friend
Whale friend buys more BTC at lower price
Whale is also Miner so whale shutoff miners to drop the hashrate slowing the supply during high demand before the halving.
This is what's happening, if I'm wrong.....then.....based on the weekly chart we are below the 20 and are on our way to $6,000
If I'm right, then we're going to be back at $10,000 within 2 to 3 weeks

USD/JPYThe price will goes with our direction
Note: this is not investment advise,This is for educational purpose only, this is just my opinion , i do this analysis in demo account, you can't make money or loss money through my opinion.

Bear Chart for ROKU pullbackRoku's recent volatility makes it vulnerable and a decent swing trade for short sellers. And if it breaks 119 then the profits are much larger!

Shorting the BITCOIN my own analysisaccording to Fibonacci retracement, this would hit bitcoin into a bearish signal which can be an opportunity for traders cause it will go down below previous high
Short 9400 -94500
Close 9000-8667


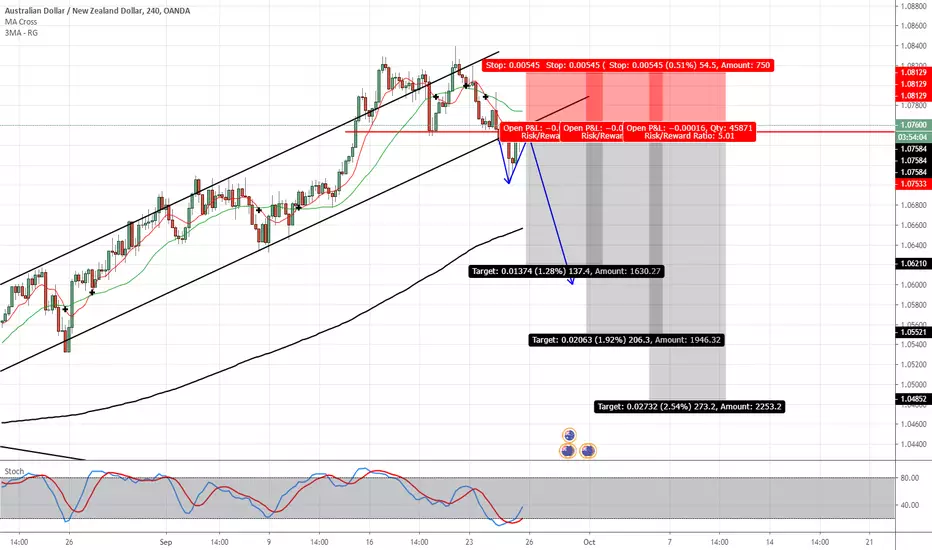
AUDNZD #Forex #ForexTrader #ForexTrading #ForexChartPossible AUDNZD shorting opportunity.
Broke diagonal channel and has come up to re-test previous support.
Using Fib levels as TP's
Any questions feel free to ask
Ben
#PipGainFx
SELL BREAKOUT ACHIEVED as is the title , i have been anticipating for price to break below the shown line or price, level. T.P TARGET IS DEPENDANT ON LEVEL OF PATIENCE!!

