NZDJPY SHORTS FAILED UPSIDE PUSHNZDJPY was previously making higher highs and higher lows on the 4H time frame , we have seen a failed continuation of this uptrend and break of a previous low and 100 MA which is acting as dynamic support
Expecting further downside momentum.
Take profit 1 - 89.244
Shorts

Short Fans XAU/USDToday the focus wasn’t on guessing price, but on waiting for the market to confirm and executing only when the context allowed it.
🔎 **Broader context**
* Intraday bullish trend.
* Key decision zone between **4420 – 4430**.
* Market in an acceptance phase after the breakout, with multiple continuation attempts and the risk of false breakouts.
In this kind of environment, patience makes the difference.
🧠 **Process followed**
* **No breakout anticipation.**
Waited for a close and acceptance on higher timeframes (**M15 / M5**).
* **No entries in the noise zone.**
While price was inside the box, there was no trade.
* **Wait for structure.**
Breakout + pullback + higher low.
* **Lower-timeframe confirmation.**
Momentum aligned (**RSI > 50, MACD turning up after the pullback**).
* **Clean execution.**
Fixed risk, moderate RR (~**1:1.2**), no overtrading.
👉 The trade wasn’t taken because it “looked like it was going up,” but because the market stopped being ambiguous.
✅ **Execution**
* Entry after a confirmed breakout + implicit retest.
* SL placed at **structural invalidation**, not emotional levels.
* TP defined from the start.
* No moving stops out of anxiety.
* No adding positions.
This type of execution protects the account even when the trade fails.
📊 **Possible scenarios for the rest of the day**
🟢 **Scenario 1 – Continuation**
As long as price holds above the acceptance zone, and pullbacks remain corrective (low volume),
→ look for continuation on clean pullbacks.
🟡 **Scenario 2 – Range / Distribution**
If price returns to congestion with no momentum,
→ no trade. Waiting is a valid position.
🔴 **Scenario 3 – Structural failure**
A clear loss of intraday supports with volume,
→ invalidates longs and opens the door to a deeper rotation.
🎯 **Key idea of the day**
The one who trades the most doesn’t win — the one who chooses *when* to trade wins.
Today the value wasn’t in the outcome, but in:
* filtering noise,
* respecting the plan,
* executing without improvisation.
That’s what builds real consistency over the long run.
Good trading and patience.

GBP/USD Pulls Back to Demand — Recovery Is ConditionalOn the 1H timeframe, GBP/USD has just completed a sharp bearish impulse, breaking below short-term structure and pushing price down into a well-defined support zone around 1.3420–1.3430. This move followed a clear rejection from the resistance area near 1.3480–1.3500, where prior buying attempts repeatedly failed. The speed and range of the sell-off indicate that sellers briefly regained control after a prolonged period of balance.
From a market structure perspective, the pair has transitioned from a choppy, sideways-to-slightly-bullish environment into a corrective bearish phase. The break below the 34 EMA, followed by price acceptance beneath both the 34 EMA and 89 EMA, signals a loss of short-term bullish momentum. The moving averages are now rolling over, suggesting that upside moves are currently corrective rather than impulsive.
The current support zone is technically significant, as it aligns with prior reaction lows and has previously attracted demand. The initial bounce projected from this area should be interpreted as a technical reaction, not a trend reversal. For any upside recovery to gain credibility, price must reclaim the 1.3480 resistance zone and hold above it with structure and momentum. Without that, rallies remain vulnerable to selling pressure.
In terms of price behavior, the projected path highlights a potential range rotation: a rebound from support, followed by consolidation and a test of resistance. This is consistent with markets that are digesting a recent impulse rather than immediately continuing in one direction. Failure to hold above support would expose the pair to deeper downside continuation, while acceptance above resistance would be required to shift bias back toward expansion.
From a macro context, GBP/USD remains sensitive to relative expectations around Bank of England versus Federal Reserve policy, as well as ongoing USD liquidity dynamics. With no immediate catalyst forcing repricing, the market is more likely to respect technical levels in the short term rather than trend aggressively.
In summary, GBP/USD is currently stabilizing at support after a bearish impulse. The setup favors caution: upside scenarios require confirmation through acceptance above resistance, while downside risk remains present if support fails. Until one of these boundaries is decisively broken, the pair should be treated as range-to-corrective, not directional.

1 hour view (xrp) short-term SHORTHello 🙋♀️🙋♂️👽👻🐮🌍
just a quick idea and possible short available here. price could go much lower because we are in a descending triangle on daily time frame view.
⏬⏬
For now I have my eyes on 💲1.8 as a possible short term target.
This is just an idea, please trade at your own risk
🐶This is a Short term short Idea. The cryptocurrency market is extremely volatile💣
This is not financial advice
🐶
Always have a stop loss ✋🛑💲 set🆗
Any thoughts 💭💡, questions 🙋♀️🙋♂️❓, good 👍, bad👎, happy 😄 or sad 😥, in the comments always welcome.😄
Jazerbay ☯️

BTCUSDT — Intraday Short Continuation | Range Pressure RemainsContext
Following the previous short execution from the seller’s zone 88,600 – 88,200, price delivered a clean downside move and reacted from 86,400.
However, despite this reaction, there is no clear evidence of sustained buyer strength at the moment.
Expectation
Within the current intraday structure, continuation toward the 86,000 area remains a valid and logical scenario.
Price is still trading under prior supply, and upside acceptance has not been established.
Risk Management
This is a continuation idea, not a late entry chase.
Risk should be reduced relative to standard position sizing and execution considered only with confirmation.
Invalidation
The intraday short bias will be invalidated only in the case of an aggressive move and firm acceptance above 88,600.

SELL GOLDIn todays session we are ,omitoring GOLD for shorts. I know it has wrecked sellers but we are in major squeeze to the upside.Ou short entry is at 4412 stops above 4452 and targets bewlo 4181. First sign of the drop is LODNON IS BEARISH, NEW YORK IS BEARISH. Keep it locked and enjoy the holidays.
Always risk what you can afford to loose.

POLYCAB 26 Dec 2025 Shorting FnOExplained in the video. Shorting Polycab as per the pattern and breakdown.
Initial SL is placed but Target is open and will be following trailing SL technique to minimize loss.

ETH +20% short opportunityFinal 5th wave down in progress.
Easy short just before the end of the year.

Gold will adjust downwards below 4500!⭐️GOLDEN INFORMATION:
Gold (XAU/USD) retreats modestly from its fresh record peak at $4,526 during early European trading on Wednesday, as short-term traders lock in profits following the recent sharp rally. The pullback is further reinforced by stronger-than-expected US Gross Domestic Product data, which tends to underpin the US Dollar and, in turn, creates headwinds for USD-denominated assets such as Gold by increasing their relative cost for non-US investors.
That said, downside risks for the yellow metal appear contained. Ongoing geopolitical uncertainty—most notably surrounding tensions between the United States and Venezuela—continues to support safe-haven demand, providing an underlying bid that may help limit deeper corrective moves.
⭐️Personal comments NOVA:
Gold is consolidating and correcting downwards after reaching its all-time high of 4526.
⭐️SET UP GOLD PRICE:
🔥SELL GOLD zone: 4524 - 4526 SL 4531
TP1: $4515
TP2: $4500
TP3: $4485
🔥BUY GOLD zone: 4404 - 4406 SL 4399
TP1: $4420
TP2: $4435
TP3: $4450
⭐️Technical analysis:
Based on technical indicators EMA 34, EMA89 and support resistance areas to set up a reasonable SELL order.
⭐️NOTE:
Note: Nova wishes traders to manage their capital well
- take the number of lots that match your capital
- Takeprofit equal to 4-6% of capital account
- Stoplose equal to 2-3% of capital account

Short on GBPCAD I think price will push up into resistance and bounce. 📉
Simple support & resistance 🤝🏾
*Keep it simple*

BEAR MARKET IS HERE !!!!BTC Bull trend has been broken, and we got into the bear market. This bear trend will continue for 1 year almost. Go in short position in every opportunity till then.

Apple - $265 Target, Shorts Catching Up, Losing the AI WarThe shorts seem to be catching up on the indicators with the bullish trendline breaking in support. Apple is also losing the AI wars, at least figuratively speaking (to some), and at the same time people are uncertain about earnings in 43 days. As always, none of this is investment or financial advice. Please do your own due diligence and research.

Short Signal for $NFLX - $85 TargetNetflix is a company that has not just have had tons of controversy recently but are also in the middle of streaming wars in which people are unconfident if they can still maintain market share. After the expected Warner acquisition, the company would still be much lower on cash. Short signals are increasing and today the trendline has broken. As always, none of this is investment or financial advice. Please do your own due diligence and research.

Running out of fuel? Short CVNA────────────────────────
WAVE 1 (40 → 270)
────────────────────────
Why it passes:
• Strong, impulsive advance
• Establishes a clear directional trend
• No overlapping or corrective structure at the start
Supporting evidence:
• Large extension from the base (~40 → 270)
• Clean upward structure with expanding volume
• Fits the behavior of a Wave 1 inside a larger uptrend
• Breaks major resistance from prior range with force
────────────────────────
WAVE 2 (270 → 147)
────────────────────────
Why it passes:
• Deep retracement but does NOT violate Wave 1 origin (40)
• Retraces more than 50% (common for Wave 2)
• Corrective structure (choppy, overlapping) consistent with EW rules
Supporting evidence:
• Pullback is proportional to the size of Wave 1
• Structure is slow and corrective, not impulsive
• Creates the setup for a powerful Wave 3
• Price remains well above the Wave 1 start → rule preserved
────────────────────────
WAVE 3 (147 → 410)
────────────────────────
Why it passes:
• Wave 3 must NOT be the shortest impulse → here it is the longest
• Must break above the Wave 1 peak → rises well beyond 270
• Must be impulsive → strong directional movement without major overlap
Supporting evidence:
• Largest price expansion of all waves
• Clean, powerful impulse characteristic of a Wave 3
• Strong upward momentum across indicators
• Represents the “longest and strongest” leg in the sequence
• Excellent symmetry relative to Wave 1
────────────────────────
WAVE 4 (410 → ~350)
────────────────────────
Why it passes:
• Does NOT overlap Wave 1 top at 270 (major rule)
• Shallow retracement after an extended Wave 3
• Alternates behavior with Wave 2 (EW guideline: alternation)
Supporting evidence:
• Correction is sideways/choppy rather than deep (opposite of Wave 2)
• Retracement is measured and controlled
• Simple corrective structure typical of Wave 4
• Stays safely above 270 → non-overlap rule intact
────────────────────────
WAVE 5 (350 → 470+)
(Currently in progress or topping now)
────────────────────────
Why it passes:
• Moves beyond Wave 3 peak (410) → required
• Exhibits typical Wave 5 characteristics: exhaustion, wedge, divergence
• Completes a clean 5-wave internal structure
Supporting evidence:
• Parabolic blowoff rally into wedge resistance
• RSI + MFI bearish divergence — classic Wave 5 termination signal
• Bollinger band overextension
• Volume declining on the final push
• Price action becomes vertical and unstable → end of trend behavior
Summary - EW is valid
The structure passes ALL primary Elliott Wave rules:
• Wave 2 does not break Wave 1 origin
• Wave 3 is not the shortest and exceeds Wave 1’s high
• Wave 4 does not overlap Wave 1
• Wave 5 extends beyond Wave 3
• Waves alternate corrections (deep Wave 2, shallow Wave 4)
• Momentum and divergence support a Wave 5 top
Where do we go from here-
Wave A TBD usually retraces 23.6%–38.2% of the full impulse.
Targets:
A1 (shallow): 380–400
• Minor reaction low
• Retest of Wave 4 pivot
A2 (common): 350–360
• Strong support
• Matches prior Wave 4 zone (very common target)
• First major liquidity pocket
A3 (deep A wave): 320–330
• Tests the mid-level between W3 peak and W4 low
• Strong support cluster

XAUUSD SELLSBreak of structure. 1H OB and 15M OB in the same price area. Let’s see how this goes. Looks solid. This is not financial advice.

MSFT PullbackPattern Identified: Bearish Double Top pattern confirmed on Microsoft ( NASDAQ:MSFT ) with neckline break and clear measured move objectives. Neckline Break Triggers Measured Move to Gap Fill.
Key Confluence:
First Top: Initial rejection
Second Top: Failed breakout, lower high
Neckline: Support connecting swing lows between tops
Confirmation: Neckline break & retest completed
Measured Move Calculation:
TP1: Distance from highest top to neckline, projected onto the breakout zone = $430
TP2: Gap fill zone from May 1st, 2025 = $400
SL: Above Neckline at previous confirmation

Going Short TESLA HereTrading Fam,
I'm taking my first ever short here since implementing my new indicator. It has been killing it on the long side. We've exited our last 17 trades, all for wins, with an average profit of 30% per trade and our portfolio is up over 86% on the year. Now, it's time to test the short signals. We received two here on TSLA. I've taken a small entry since this is my first short, representing around 9% of the portfolio total. I'm going to target $350 but will not take more than a 7% loss, thus my stops are set at $476 bring the rrr on this trade entry to 1:3. Let's see how this goes.
✌️Stew

Short PalantirTrading Fam,
This will be only the second short I have taken since implementing my new indicator. We are up 250%+ pending exits in just over a year; however, during that time, I have taken long entries only. Now, it's time to test accuracy on the short side.
On my NASDAQ:TSLA short (my first ever short entry), we are already comfortably in profits. More to come on that.
As far as NASDAQ:PLTR goes, my signal gave me a SELL at $195. As I have been in the habit of waiting for confirmation, I did not enter immediately. Yesterday and today, I believe I have been given the chance for a decent entry. I've entered short at a price of $190 and will shoot for that 200-day SMA at somewhere around $145 for a 2.37 rrr.
Let's see how this goes.
✌️Stew

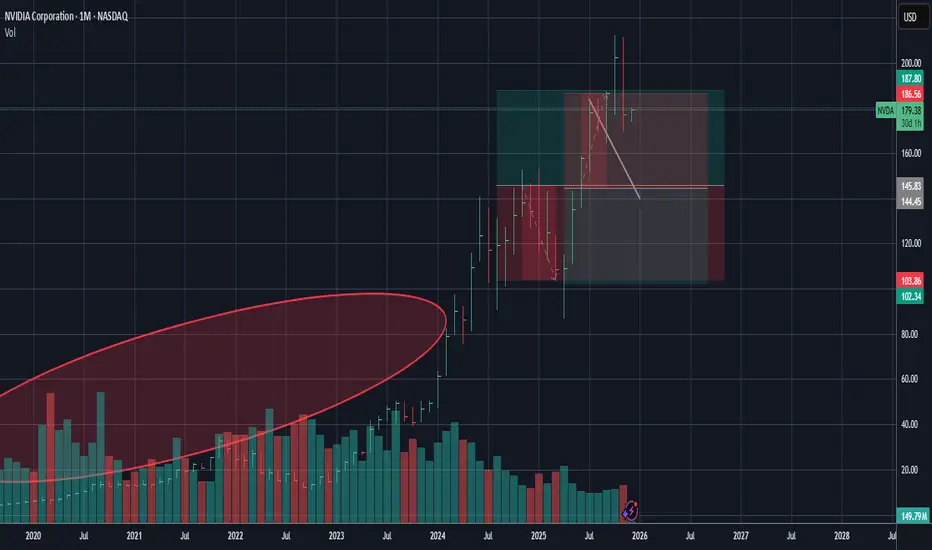
$NVDA - $140 Target - Short Position - AI Bubble About to BurstIn my opinion, Nvidia does not have much to continue the next needed support for a pro-longed bull run, at least in terms of sentiment. The AI bubble has gone on for too long and the actual multiples of valuations in comparison to revenue and profit generations do not seem to have strong support when considering traditional investing strategies. Also, the next wave seems getting closer and closer to a red trend. Retracement potential is possible after hitting $140, but Nvidia needs to do far more benefit for the public good and have a differentiation that doesn't rely on trends such as crypto mining and the boost of LLMs. As always, none of this is investment or financial advice. Please do your own due diligence and research.
PERFECT MSFT SHORTWe have a really strong timeframe alignment on NASDAQ:MSFT , presenting us with a great shorting opportunity.
Weekly
If we start top down from the weekly, MSFT had a strong and fast rally but has faced strong rejection on the upper side of its long term upward channel. Price may now look to retrace to its previous long-term swing high after this rejection. We also see volatility constriction through Bollinger Bands, indicating potential for large price moves and volume to occur soon.
Daily
On the daily chart we see a strong rejection of the daily 50 ema and resistive levels after a downside breakout.
Hourly
For the entry on the 1hr timeframe we are looking at a large head and shoulder formation, with a trend rejection and a strong rejection of the 1hr 100ema.
I am targeting the previous long-term swing high at 470 as my singular TP.
Goodluck-nfa.

Continue to accumulate - gold price moves slowly around 4050⭐️GOLDEN INFORMATION:
Gold (XAU/USD) trades firmer near $4,075 in early Asian hours on Monday, supported by rising expectations of a Fed rate cut following comments from John Williams. Attention now turns to Tuesday’s US September PPI and Retail Sales data.
Williams noted Friday that the Fed could still lower rates soon without derailing progress on inflation. Markets now see nearly a 74% chance of a December cut, up from 40% last week, according to the CME FedWatch Tool. Softer rates would lower the opportunity cost of holding non-yielding gold, offering the metal additional support
⭐️Personal comments NOVA:
Gold price continues to accumulate and move sideways in the range: 4000 - 4100, The market did not have many major changes at the beginning of the week.
⭐️SET UP GOLD PRICE:
🔥SELL GOLD zone: 4143 - 4145 SL 4150
TP1: $4130
TP2: $4120
TP3: $4100
🔥BUY GOLD zone: 4003 - 4001 SL 3996
TP1: $4016
TP2: $4028
TP3: $4040
⭐️Technical analysis:
Based on technical indicators EMA 34, EMA89 and support resistance areas to set up a reasonable SELL order.
⭐️NOTE:
Note: Nova wishes traders to manage their capital well
- take the number of lots that match your capital
- Takeprofit equal to 4-6% of capital account
- Stoplose equal to 2-3% of capital account

Gold sideways, selling pressure returns to 4000⭐️GOLDEN INFORMATION:
Gold (XAU/USD) comes under renewed pressure in Friday’s Asian session, though it continues to trade within its weekly range amid mixed signals. Expectations for a December Fed rate cut have faded further after the delayed September NFP release, supporting the US Dollar’s climb to its strongest level since late May and weighing on the non-yielding metal.
⭐️Personal comments NOVA:
Downward trend, gold price continues to accumulate at the end of the week: 4000 - 4100
⭐️SET UP GOLD PRICE:
🔥SELL GOLD zone: 4144 - 4146 SL 4151
TP1: $4130
TP2: $4120
TP3: $4100
🔥BUY GOLD zone: 4006 - 4004 SL 3999
TP1: $4020
TP2: $4040
TP3: $4060
⭐️Technical analysis:
Based on technical indicators EMA 34, EMA89 and support resistance areas to set up a reasonable SELL order.
⭐️NOTE:
Note: Nova wishes traders to manage their capital well
- take the number of lots that match your capital
- Takeprofit equal to 4-6% of capital account
- Stoplose equal to 2-3% of capital account

XAUUSD has started a downtrendXAUUSD has started a downtrend.
Based on my experience, this symbol will continue to decline, and you should not think about buying until it reaches our buying zone.
Unless the scenario is invalidated.
