SELL XAUUSDIn todays session we are monitoring GOLD for bearish opportunities. Our entry is at 3607, London has made a high above Asia and we expect a drop towards Asia low and 3550 zone. Stops are above 3627.53. Use proper risk management.
Shorts

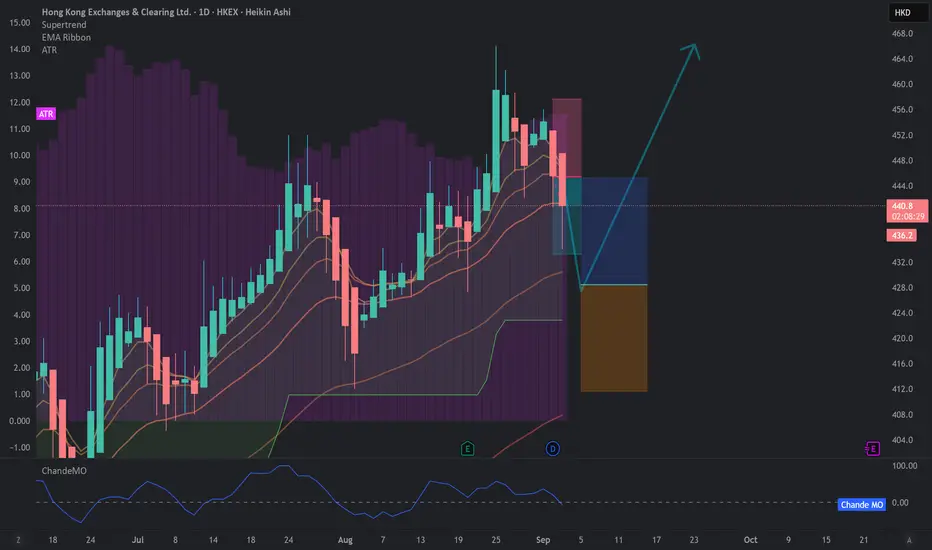
To Whom It May Concern.....Short then LongAn easy grab for the duckets..$$$
You tell me?! I have been on this stock for a minute and have a rhythm that's looking like smooth sailing.
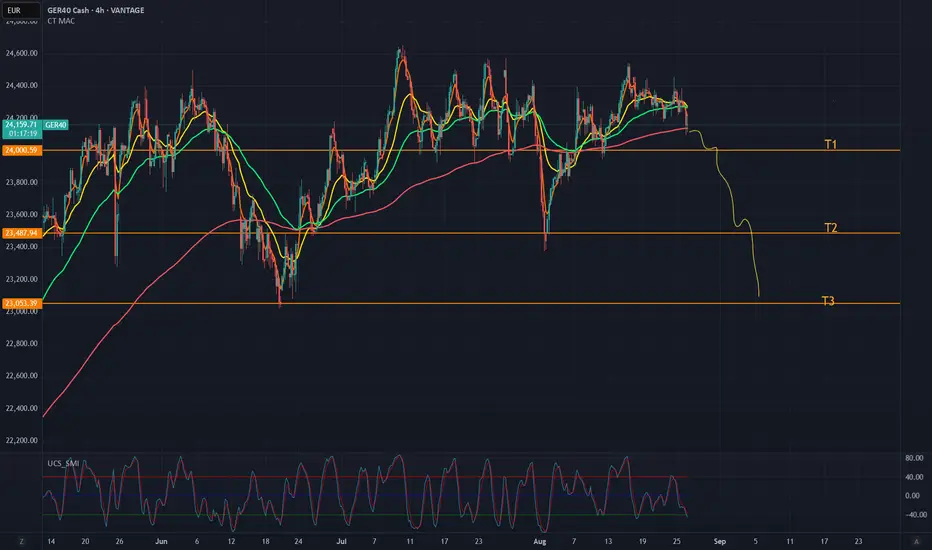
DAX (GER40) – New Short SetupThe DAX is currently trading around 24,150. On the 4-hour chart, price has dropped below the 10 EMA (red line) and failed to reclaim it, which is a bearish signal. The short-term EMAs (yellow and green) are flattening and starting to turn down, showing weakening bullish momentum.
Trade Setup
Entry: Around 24,150 – 24,160
Stop Loss: Above 24,224 (recent local high)
Target 1 (T1): 24,000
Target 2 (T2): 23,488
Target 3 (T3): 23,053
Why I’m Short
Price is now trading weak, also Nasdaq shows signs of a drop - which usually signals bearish momentum.
Multiple failed attempts to reclaim the moving averages show that buyers are losing strength.
The targets are based on clear historical support levels that have been tested multiple times.
Summary
I’m looking for a short entry around 24,150 – 24,160, with targets at 24,000, 23,488, and 23,053.
If price breaks above 24,224 with conviction, the setup becomes invalid.
No financial advice – just my personal trade idea.
go for it GBPUSD Take your own riskit is just basic Supply and Demand , there are 3 taps on supply zone and each time it comebacks for demand zone if you wanna shorts go for it just keep in mind do not forget to put STOP LOSS

BTC Ready to strong fallBTC is poised for a big drop to the 200 EMA. Close your positions and prepare for a strong entry in October.

Quick US 30 Scalp on Correction & Gold MELTRed day for the Markets.
Took chance of some corrections.

BTC Might Drop to 100,000 (at least) After Today's Retest CandleSaw a Double Top Pattern in 1D with a minimum objective of going to 99,800. Also saw a Head and Shoulders in 4H , with a measurement minimum objective of going to 106,500 more or less
Although this is a bearish signal. I will be looking for the retest today. So far, today's candles are showing a lot of bullish patterns. Starting from the Flat Top Triangle in 1H , and the Inverse Head and Shoulders in 15m in total agreement with its volume.
For me, it's safe to say i will be taking this buy trade and set my TP at 111,500.00. After that, i will wait for consolidation and watch for a downside break and enter for a sell there. My TP for the sell will be divided into 2. 1 at around 105,200. and 1 at around 99,800. Stop loss will be just above 112,900.
Anyways, Disclaimer on. Happy Trading!

BTC adjusts down, market suspects interest rate cut💎 BTC PLAN UPDATE – Early Week (08 / 25 )
🔎 BTC Analysis
After retesting the 117k resistance zone (117,566 USD), the price reacted with a sharp drop. This indicates that the selling pressure in this area remains very strong.
Currently, the price is falling near the EMA200 (red line ~111,664) – which is a key short-term support level.
📌 Key Reaction Zones
111k – 110k:
This is the confluence of EMA200 + Fib 0.5.
If the price holds, there’s potential for a rebound back to 113k–115k.
109k – 108k:
Next strong support.
If 111k breaks, this zone will be the next critical reaction point.
105k – 104k:
Major long-term support (confluence of Fib extension + old demand zone).
In a bearish scenario, the price could test this zone before bouncing back up.
🌐 Market Sentiment & Expectations
After BTC was rejected at 117k, market sentiment has turned cautious and somewhat bearish in the short term.
However, many traders still expect BTC to hold above the EMA200 to trigger a rebound → if this level holds, sentiment may shift back to bullish, targeting 115k–117k again.
On the contrary, if the price breaks deep below 110k, the market may enter short-term panic and shift focus toward the strong support at 104k.

Slight decrease in the new week, accumulation above 3330⭐️GOLDEN INFORMATION:
Fed Chair Jerome Powell signaled openness to a rate cut at the September meeting, though persistent inflation pressures could complicate that outlook. Powell described the US economy as facing a “challenging situation,” noting inflation risks remain skewed to the upside while employment risks lean to the downside.
Following his remarks, traders boosted their bets on a 25 basis-point cut next month to nearly 85%, up from 75% prior to the speech, according to the CME FedWatch tool. Powell’s dovish tone could lend support to gold prices, as lower interest rates diminish the opportunity cost of holding the non-yielding metal.
⭐️Personal comments NOVA:
Gold price decreased and adjusted, pay attention to liquidity zones 3351, 3330
⭐️SET UP GOLD PRICE:
🔥SELL GOLD zone: 3400- 3402 SL 3407
TP1: $3388
TP2: $3373
TP3: $3360
🔥BUY GOLD zone: $3330-$3328 SL $3323
TP1: $3340
TP2: $3350
TP3: $3360
⭐️Technical analysis:
Based on technical indicators EMA 34, EMA89 and support resistance areas to set up a reasonable SELL order.
⭐️NOTE:
Note: Nova wishes traders to manage their capital well
- take the number of lots that match your capital
- Takeprofit equal to 4-6% of capital account
- Stoplose equal to 2-3% of capital account

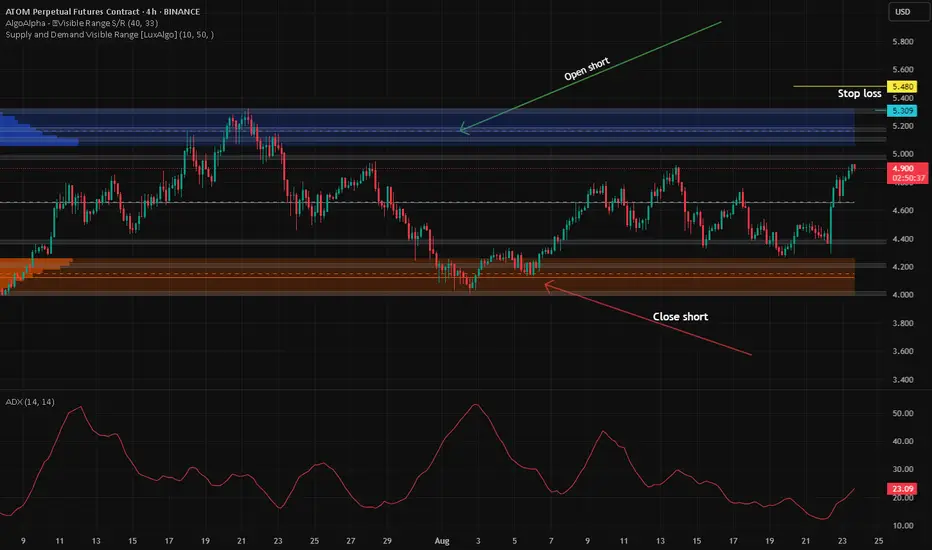
ATOM Short
Short entry positioned at $5.16, aligning with a strong supply zone and major resistance based on the 2.618 Fibonacci extension.
Stop loss set at $5.48, above recent highs and upper resistance to mitigate risk from volatility spikes and potential wicks.
Take profit targeted between $4.23 and $4.03, within a solid historical demand zone on high volume.
Setup offers favourable risk/reward ratio (approx. 1:3).
4H ADX currently at 23, indicating a modest trend but favouring range-bound trading strategies.
Main risk includes the possibility of false breakouts above resistance, leading to stop-outs before a reversal.
Price may find strong support around the take profit zone, causing potential bounce or stalling.
Broader market structure neutral to slightly bullish; range may eventually break after repeated tests.
Setup validity is reinforced if BTC and overall crypto market continue consolidating in established ranges.
BTC - Short Trade Plan Updated details for this BTC short below, with a lower entry than first plan.
DISCLAIMER - This is my personal trade only and I’m not advising you what to do with your money. Trading is risky and please use your own discretion and risk practices.
Fundamental analysis of this trade can be found on my prior posts.
Entry Range - 116,700 to 117,000
Stop Loss - 120,000
Target 1 - 88,000
Target 2 - 61,500
Target 3 - 35,000
Target 4 - 8,000
God speed. Let the dump begin.

Xauusd downtrendXAUUSD is currently trading around 3328. The market structure shows bearish momentum with sellers still in control. If this pressure continues, I expect price to push further down toward the 3288 level, which may act as the next support zone. Traders should watch for confirmation signals before entering, as volatility around key levels is likely.

Recovered and traded below 3374 , XAU today⭐️GOLDEN INFORMATION:
Gold (XAU/USD) came under renewed selling pressure in Thursday’s Asian session, stalling Wednesday’s solid rebound from the $3,311–3,312 zone, its lowest level in nearly three weeks. The release of the late-July FOMC minutes revealed a hawkish tilt, with policymakers voicing greater concern over inflation than labor market conditions. This has tempered expectations for a jumbo Fed rate cut in September, bolstered the U.S. Dollar, and diverted flows away from the non-yielding metal.
Further weighing on gold, optimism surrounding a potential resolution to the Russia–Ukraine conflict has dampened safe-haven demand. At the same time, political noise added uncertainty after President Donald Trump called for Fed Governor Lisa Cook to resign amid mortgage fraud allegations, raising questions over the central bank’s independence. This could limit aggressive USD buying and lend some support to bullion. Looking ahead, traders will eye global flash PMI readings for fresh cues before Fed Chair Jerome Powell’s highly anticipated remarks at the Jackson Hole Symposium.
⭐️Personal comments NOVA:
Short-term downtrend line, gold price maintains accumulation at 3300 - 3374, use fibo to find support reaction points
⭐️SET UP GOLD PRICE:
🔥SELL GOLD zone: 3373- 3375 SL 3380
TP1: $3366
TP2: $3354
TP3: $3344
🔥BUY GOLD zone: $3302-$3300 SL $3295
TP1: $3313
TP2: $3325
TP3: $3337
⭐️Technical analysis:
Based on technical indicators EMA 34, EMA89 and support resistance areas to set up a reasonable SELL order.
⭐️NOTE:
Note: Nova wishes traders to manage their capital well
- take the number of lots that match your capital
- Takeprofit equal to 4-6% of capital account
- Stoplose equal to 2-3% of capital account

EURJPY SHORTi see potential for EURJPY to go down to 155 level.
At the moment there are not confirmed down move yet, but the way how price is behaving at the moment i belive we will see down movment i next days/weeks.
Trade according to your strategy!

GBPUSD Short Position idea! RR 1:6Price broke the daily trend line and its tested back the trend line resistance twice on 4HR down trend fibonacci. This could be a possible pullback till the key zone. Trade with your own risk, Cheers!

EURUSD UPDATEAs you can see, EUR/USD has finally reached the upside target — the supply zone around 1.17000, where I identified an opportunity and entered short positions. This analysis was originally shared on August 3rd, and it has played out very well.
Currently, I have set three downside targets (marked with the red lines). At each level, I will closely monitor price action to decide whether to take partial profits. Depending on how the market reacts, I may also look for potential long entries in case of a reversal. If the market continues in my favor, I am satisfied with securing profits from the short trade.

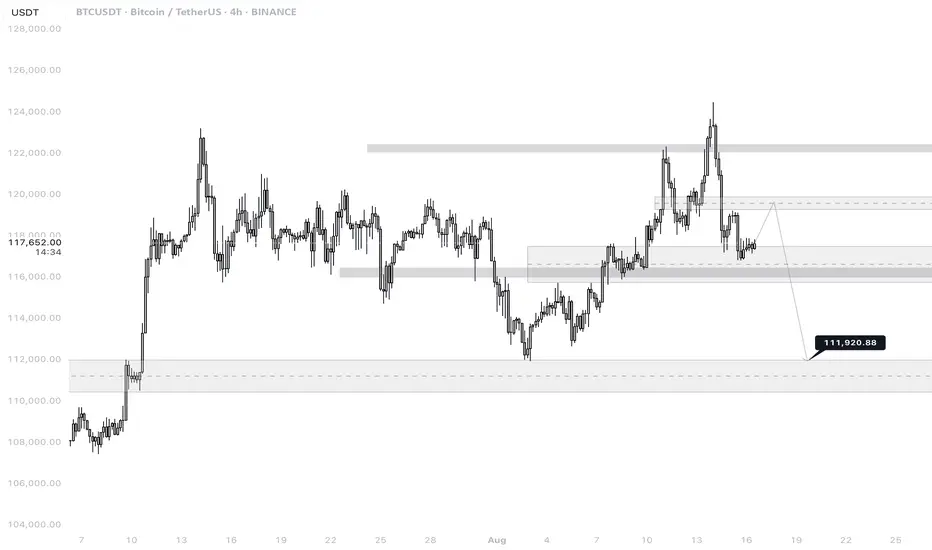
BTCUSDT 4H🔎 Chart Context
• Pair: BTC/USDT
• Exchange: Binance
• Timeframe: 4H (240M)
• Date: 16 August 2025
The chart applies price action, liquidity sweep, demand/supply zones, and FVG (Fair Value Gaps) to forecast market behavior.
📊 Key Observations
1. Major Highs & Lows
• Recent Highs: 124,474 and 123,218
• Key Resistance: 122,335.16 zone
• Significant Lows: 112,650.00 and 111,920.00 (highlighted as potential liquidity target)
These represent liquidity pools where institutional activity often occurs.
2. Current Price
• Trading around 117,621 – 118,235 zone at the time of charting.
• Price is consolidating after rejection from 124,474 top.
3. Liquidity Structure
• Market swept liquidity above 124,474 and quickly rejected, signaling a potential distribution phase.
• Below, untested liquidity exists near 111,920, which is marked as a probable downside target.
4. FVG & Demand Zones
• A Fair Value Gap (FVG) remains open around 115,200–116,500, which price could retest before further downside.
• Stronger demand lies around 111,920–112,650, likely to act as a magnet if the retracement deepens.
5. Resistance Zones
• 122,335–124,474 is a strong supply block / distribution zone, which caused the sharp rejection.
• Any bullish recovery will need to reclaim 120,247 and 119,800 to sustain upside momentum.
📈 Bullish Case (Less Likely, Countertrend Scenario)
• If BTC holds above 115,200–116,500 FVG zone and forms higher lows:
• First target: 119,800 (minor supply).
• Second target: 122,335 (major resistance).
• Reclaiming this zone could trigger a retest of 124,474.
• However, this requires strong demand and volume, which currently looks weak.
📉 Bearish Case (Higher Probability Scenario)
• After liquidity grab at 124,474, rejection suggests continuation lower.
• Likely retracement path:
• Retest 116,500–115,200 (FVG zone)
• Break below to sweep 112,650
• Final downside liquidity target: 111,920
This scenario aligns with the chart projection arrow pointing toward 111,920.88.
⚡ Trading Plan
• Short Entries (Preferred Play):
• At 119,800–120,247 (supply retest)
• At 122,335 zone (distribution block)
• Target 1: 116,500–115,200 (partial close).
• Target 2: 112,650.
• Target 3: 111,920 (main liquidity sweep).
• Stop-loss: Above 124,474 high.
• Long Setup (Countertrend, Risky):
• Entry at 115,200–116,500 (FVG)
• TP1: 119,800
• TP2: 122,335
• Stop: Below 114,700
A quick sell and easy profit on XAUUSDI believe you can get two short positions at the marked area,
Please check first and wait for approval then enter.

NasdaqAs said before, nasdaq going down, can take out highs then plummet, but time will tell. PS: my previous posts got removed. View auto supply and demand zones indicator. Dm me free for a month free. (It draws snd zones).


LINK SHORT It seems like a lower high has now formed. Following the trend positioning into a short position makes sense here.

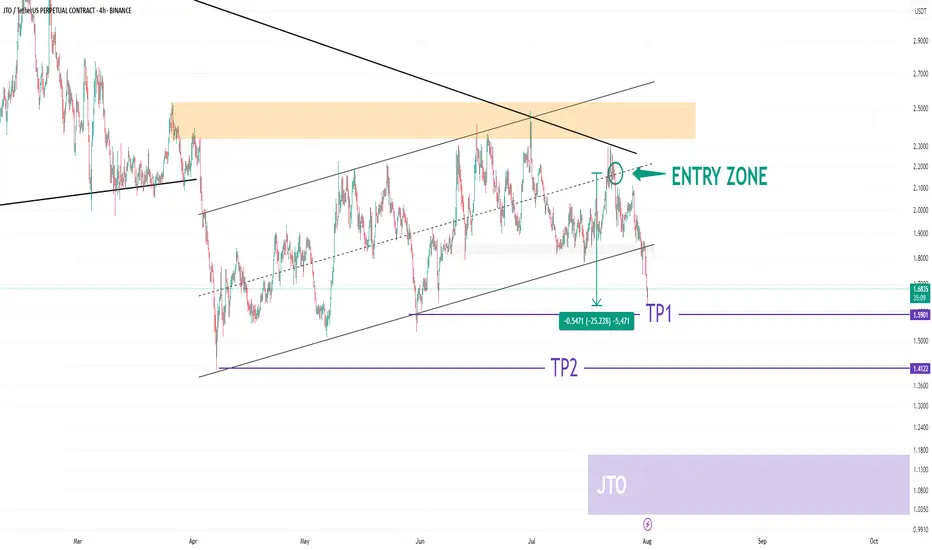
JTO USDT UpdateHELLO 😍
JTO Update
💁♂️ -25% 🔥
I shared this analysis when it was in the entry section. It would be nice to have an update of this analysis.
The JTO cryptocurrency has corrected 25% since the entry zone.
We saw a very good analysis together. What do you think? 😊💖
You can save some profit from the position in this area. 🐱
Please don't forget to like, share, and boost so that I can analyze it for you with more enthusiasm. Thank you. 💖😍
Get out now! Bullmarket might be over This is LMACD applied to GC with reduced lag. If this time is not different we just had our cycle top ~123k. Sell some coins and buy back around 2026 ~44K
