Gold Lacking Bullish Strength, Bears are Reentering StronglyTechnical Summary:
Gold is consolidating in a narrow zone between 3365 & 3330 since the beginning of the week. The prices in the recent trading sessions failed to sustain above the immediate resistance at 3365. Also, the prices are trending lower near 3362, indicating bulls are failing to breach the immediate resistance, and soon bears might overpower, signaling developing bearish strength with immediate support at the fib level 0.382 (3355.30).
Projection
If prices breaches the immediate support at the fib level 0.382 (3355.30), then it might decline to test 3330, then 3300 and even lower towards 3285
Descriptive Analysis:
The metal might weaken due to revived strength in the US Dollar, due to easing geopolitical tensions brokered by President Trump.
Data-Related Projection:
Today’s key releases include US initial jobless claims, PPI, and Trump's speech could bring a lot of volatility in the market. A rising PPI and falling Jobless claims will strengthen the dollar and weaken the demand for non-yielding gold.
Indicator Interpretation:
The Bollinger band is narrowing while trending downwards, with prices hovering near the middle band, indicating weakness in prices. On the other hand, RSI is trending in the selling zone.
Shortsetup

TRADE PLAN: Bulls vs BearsHello, fellow traders! We've created a 2-scenario trade plan based on the most recent technical, macro, and trader sentiment using 4 hour charts - because we love you!
1. BULLISH SCENARIO — rebound from support
Price is oversold on the 4H RSI and nearing key support (146.4–147.0). Fed easing expectations are already priced in, so any upside surprise in U.S. data, or lack of follow-through selling, could trigger a corrective rally.
TRADE PLAN:
Entry: 146.40–147.00 (look for a 4H bullish candle or RSI divergence confirmation)
Stop: Below 146.00 (clear break under the next support cluster)
Target 1 (Partial trade plan): 147.80 (local resistance)
Target 2 (Full trade plan): 148.50 (Aug 12 high)
SUPPORT LEVELS:
Support 1: 146.40–147.00
Support 2: 146.00
RESISTANCE LEVELS:
Resistance 1: 147.80
Resistance 2: 148.50
RISK/REWARD: ~1:2 from midpoint entry (146.70), risking 70 pips for 140 pips potential.
__________________________________________________
2. BEARISH SCENARIO — continuation lower
The pair remains in a short-term 4H downtrend after failing above 148.5. Softer U.S. CPI reinforced Fed cut odds, while Japan’s inflation remains >2% with a mildly hawkish BoJ bias — supportive for yen strength.
TRADE PLAN:
Entry: 147.80–148.00 (sell into a retest of broken support / 4H resistance)
Stop: Above 148.50 (invalidated if breakout above Aug 12 high)
Target 1 (Partial TP): 147.00 (intraday swing low area)
Target 2 (Full TP): 146.00 (deeper swing support)
RESISTANCE LEVELS:
Resistance 1: 147.80
Resistance 2: 148.50
SUPPORT LEVELS:
Support 1: 147.00
Support 2: 146.00
Support 3: 145.80
RISK/REWARD: ~1:2.5 from midpoint entry (147.90), risking 60 pips for 150 pips potential.
_________________________________________
PROBABILITY ASSESSMENT (based on our most current data)
Bearish case is slightly more probable near-term because macro backdrop favors JPY (BoJ gradually normalizing, U.S. rate cut expectations rising).
Price action still in 4H downswing with momentum (MACD) negative and resistance overhead. CFTC data shows yen longs reduced — less chance of a squeeze higher on short-covering. That said, oversold conditions mean bullish bounces are possible, but likely corrective rather than trend-changing unless U.S. data turns hawkish again.
We hope you found our analysis helpful and thank you for reading. Follow us here on TradingView for more up to date analysis. Happy trading!
__________________________________________
DISCLAIMER: Our analysis is not 100% absolute. We are not responsible for any losses incurred. Please be sure to do your own research before investing or trading.

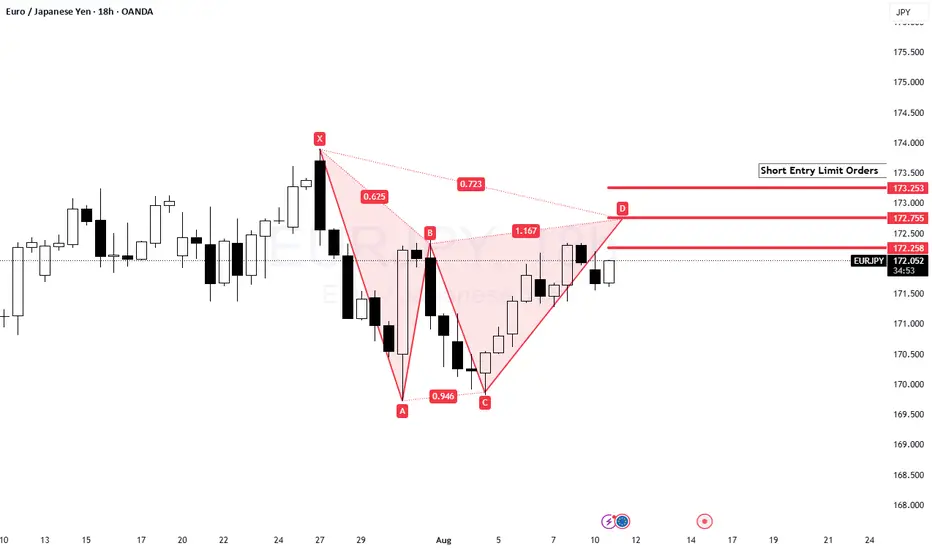
EUR/JPY Bearish BatA Bearish Bat is forming on the EUR/JPY custom timeframe chart (18hr). I'm expecting price to push through 172.00 and possibly through 173.00 before reversing. I've put in a few limit orders. If price sharply reverses I'm just going to short the market.
Make it or break itThis time double top formed and btc will not make it last chance to catch the knife.
A healthy correction is needed right now being bullish is just fine but fomo is not a great option.
Btc R:R Building slow but valid scene ready for a reaction profit taking will start as soon as you don't notice

EURUSD Technical Analysis (Educational Breakdown) EURUSD Technical Analysis (Educational Breakdown)
1. Market Structure Overview
The chart shows a clear downtrend phase that started after failing to break the major resistance around 1.1780 – 1.1820.
Price formed lower highs and eventually broke below a rising trendline, signaling a shift from bullish momentum to bearish control.
Recent movement shows a retracement toward a defined entry zone, suggesting a short-term pullback opportunity.
2. Key Levels
Resistance Zone (1.1780 – 1.1820): This area has acted as a strong supply zone in the past, rejecting bullish attempts and triggering heavy sell-offs.
Support Zone (1.1340 – 1.1380): A key demand area where previous reversals took place.
Current Entry Zone: Between 1.1697 – 1.1750, aligning with a minor resistance zone and previous supply reaction.
3. Price Action Insights
Fair Value Gap (FVG) identified earlier near 1.1700 served as a reaction zone before a push downward.
The price is now revisiting an area near the previous imbalance, which aligns with a confluence of resistance and short-term overbought conditions.
If price action rejects the entry zone, a bearish swing toward 1.1534 is likely.
4. Trade Setup Idea (Short Bias)
Entry: 1.1697 – 1.1750 (retest of broken structure).
Stop Loss: Above 1.1772 to avoid stop hunts beyond resistance.
Target: First take profit at 1.1534; extended target toward 1.1400 if bearish momentum persists.
5. Risk Management & Educational Note
This setup is based on supply & demand principles plus market structure shifts.
Always confirm entries with lower-timeframe rejection patterns before executing.
Protect capital with a maximum of 1–2% risk per trade and adjust lot sizes accordingly.
📌 Summary:
EURUSD is currently testing a high-probability short zone after a structural breakdown. If rejection occurs, sellers could push price toward mid-range support at 1.1534, and potentially deeper toward the 1.1400 zone. However, if bulls manage to reclaim and close above 1.1780, this bearish view becomes invalid.

Gold Eyes Short-Term Pullback Before Key Support Test"Gold Eyes Short-Term Pullback Before Key Support Test 🏆📉"
Market Structure
The chart shows a clear range-bound price action between the strong support near 3,303 – 3,316 and the resistance zone around 3,420 – 3,440.
Multiple Higher Lows (HL) indicate that the market has been trying to build a bullish structure, but the recent level rejection from resistance suggests sellers are still defending that zone aggressively.
2. Key Zones
Resistance (3,420 – 3,440): Price tested this level and faced a sharp rejection, marking it as a strong supply zone.
Support (3,303 – 3,316): Historical buy reactions are seen here, making it a crucial demand zone.
Entry Zone: Around 3,351 – 3,360, which is being used for the current short setup.
3. Pattern & Price Action
BOS (Break of Structure) occurred earlier on the left side of the chart, breaking above previous highs and confirming bullish strength at that time.
BOL (Break of Low) later on indicates a shift in momentum, as price failed to maintain the bullish push and created a bearish swing.
The Bullish Fair Value Gap (FVG) earlier provided a springboard for upward movement, but recent momentum failed to sustain.
4. Current Trade Idea (Short Bias)
Entry: 3,351 – 3,360 (retracement to minor resistance after breakdown).
Stop Loss: Above 3,380, protecting against a false breakout.
Target: 3,316 (mid-term) with a possible extension to 3,303 if bearish pressure continues.
5. Sentiment & Risk Factors
Bears are currently favored due to the rejection from major resistance and the inability of bulls to reclaim 3,380+.
If the price reclaims and holds above 3,380, this short setup will be invalidated, and the market could retest 3,420 – 3,440.
📌 Summary:
XAUUSD is trading in a defined range, with the current structure leaning bearish after resistance rejection. A short position from the entry zone targets the strong support below, but traders should remain cautious as higher lows in the past indicate that bulls may still attempt to defend support aggressively.

BTC accumulation, cash flow through altcoin💎 MIDWEEK BTC PLAN UPDATE (August 13, 2025 )
1. Market Structure & Wave Pattern
The chart is applying the Elliott Wave theory with a completed 5-wave upward structure (1 → 5) and is currently correcting in an ABC pattern.
The current zone is in corrective wave C, with a likely retest of a key support area before bouncing back upward.
2. Key Price Levels
• Short-term resistance: 120,500 – 120,700 (previous breakout zone).
• Nearest support: 118,800 – 119,000 (EMA34 zone + retest of the broken downtrend line).
• Stronger support: 117,500 – 117,800 (EMA200 zone + long-term trendline).
• Major resistance above:
• 122,770 (Fib 2.618, short-term take-profit zone).
• 127,260 – 127,480 (Fib 3.618, strong resistance zone).
3. EMA & Trend
• EMA34 (gold) is above EMA89 and EMA200 → medium-term trend remains bullish.
• EMA200 (red) acts as dynamic support during the correction.
4. Trend Outlook
• Main scenario: Price may continue corrective wave C toward 118,800 – 119,000, possibly testing deeper at 117,500 – 117,800, then sharply rebound in line with the main trend toward targets at 122,770 and 127,260+.
• Alternative scenario: If the 117,500 support breaks, the short-term bullish structure will be invalidated, and BTC could retreat to 115,800 – 116,000 before recovery signals appear.

Short Idea On LUMBER (LBR1!)Based on :
- Cot Data
- Supply Zone
- Inverted Hammer Candle Confirmation

BTC - Short Update Part 2This chart shows the ascending parallel channel that supports 7,000-8,000 ultimate bottom - layered with BITCOIN ONLY liquidity zones on the multi day time frame.
The majority or liquidity in the chart is long position stop losses - leveraged sell orders.
Bitcoin has been moving straight up, consolidating sideways, straight up, consolidating sideways since End 2022.
This tells us the market is collecting long position stop losses and leaving them in tact IE not allowing price to fully drop and start triggering off the cascading chain reaction of sells that is a natural phenomenon.
Happy Trading.
SHORT ON NAS100NAS has retested a major supply zone after a nice CHOC (Change Of Character)
I will be selling NAS looking to catch over 800-100 points.
DXY (USD) CPI economic news will also be a catalyst to more this trade this morning after 8:30am.
Gold on the Verge of a Big Move – Key Level in Focus!Gold on the Verge of a Big Move – Key Level in Focus!
Market Structure:
BOS (Break of Structure) signals have confirmed bullish momentum in prior swings.
Price created a Bullish FVG (Fair Value Gap) around mid-July, which provided demand for the next upward leg.
Consecutive Higher Lows indicate that buyers remain in control.
Key Levels:
Strong Support: $3,260 – A major demand area where buyers have stepped in multiple times.
Resistance Zone: $3,420–$3,440 – This is a significant supply area where price faced rejection earlier.
BOL (Breakout Level) around $3,390 – Price recently tested and is attempting to break above.
Trade Setup Highlighted:
Entry Point: $3,397 (short bias suggested by chart structure at resistance)
Potential Target: $3,370 – aligns with minor liquidity grab and possible retest of broken structure.
Market Logic:
Price is currently testing a resistance level rejection zone.
The expectation in this setup is a short-term pullback to collect liquidity before a possible continuation.
If $3,370 holds, bulls may resume toward the higher resistance zone at $3,420+.
Educational Takeaway:
BOS indicates a shift in control (bearish BOS = sellers taking over; bullish BOS = buyers taking over).
FVG is a gap in price that often acts as a magnet for retracement.
Higher Lows are key signs of a bullish trend.
Support & Resistance act as decision zones where traders can anticipate reversals or breakouts.
📌 Summary:
XAUUSD is in a bullish structure but is currently testing a resistance rejection zone. A short-term retracement to $3,370 is probable before any continuation higher. Swing traders should watch price behavior at support for a potential long continuation setup.
Bitcoin CME Closing Price: The Key to Next Week’s TrendIn this video I cover the CME closing price and go through a plan which includes a gap to the upside and a short squeeze before gravitating to the downside for lower targets .
I also give a bias for higher prices if the VAH is claimed .
This idea is modelled on the daily time frame and can play out over the course of the following week or more .
I also look at the Eth/Btc pair and the Btc dominance chart and marry whats happening on those charts with this idea .
When looking at BTC I use order flow software to further support my bias and the confluences I present in the chart.
If you have any questions then leave them below .
Support my work with a boost and Safe trading

ethusdETHUSD HEAD AND SHOULDER
Sell Trade 30 minutes 15 minutes
After extreeme bullish momentume a retrace can seen in ETH chart
H&S can be seen trade it when price brakes the neck line retest and go down before a new upside run!


GBPUSDWill we get a retracement lower next week? The price will consolidate depending on the market and news, and potentially go lower from Tuesday or Wednesday. What I won't do is call the highs; I will wait for the price to break structure on a lower timeframe and make an execution from here.

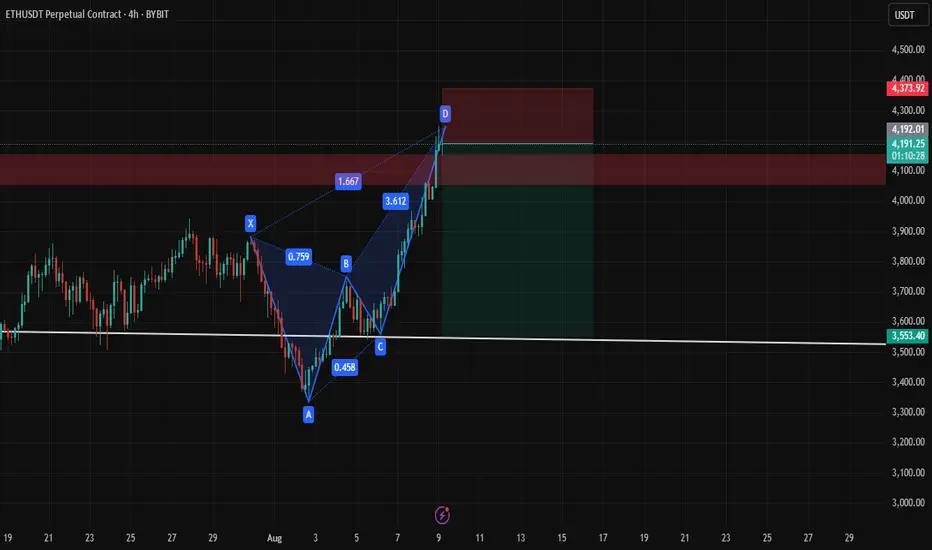
Eth Short Bearish Butterfly The Bearish Butterfly setup with price levels:
📍 Entry
Around point D, which looks close to $4,186–$4,190.
🛑 Stop Loss (SL)
Safest SL: Above 1.27 XA extension (slightly beyond D) → around $4,230–$4,240.
Conservative SL: Just above 1.618 XA extension (~$4,255).
🎯 Take Profits (TP)
We use Fibonacci retracements from the AD leg for targets:
TP1: 38.2% retracement of AD → ~$3,960
TP2: 61.8% retracement of AD → ~$3,800
TP3: Full retrace to point B area (~$3,700)
CORZ Earnings Alert — Bearish Setup Ahead of BMO Report****⚠️ CORZ Earnings Alert — Bearish Setup Ahead of BMO Report**
Core Scientific (CORZ) faces heavy fundamental headwinds with declining revenue (-55.6%) and negative margins, despite some bullish options flow and technical support near \$14.
**📉 Market Sentiment:**
* Moderate bearish conviction (75%)
* Mixed signals: cautious optimism from options flow vs. weak fundamentals
* Watch M\&A uncertainty and regulatory risks
**🛠 Trade Setup:**
* **Instrument:** CORZ
* **Direction:** PUT (SHORT)
* **Strike:** \$14
* **Entry Price:** \$0.16
* **Profit Target:** \$0.48 (200-300% gain)
* **Stop Loss:** \$0.08
* **Expiry:** 2025-08-08
* **Size:** 1 contract
* **Entry Timing:** Pre-earnings close
**🔑 Key Levels:**
* Support near \$14
* Resistance at \$15
* Expected Move: -\$2.50
**⚠ Risk Management:**
* Cut losses at 50% premium decline (\$0.08)
* Exit by market open next day if no target hit
---
**#CORZ #CoreScientific #EarningsTrade #PutOptions #BearishSetup #OptionsTrading #CryptoStocks #MAndA #RiskManagement #TechnicalAnalysis #TradingView #StockMarket #Volatility #ShortSetup**

CHFJPY CHFJPY Retracement trade Sell Plan 30 Min Time frame
Making LLs and LHs confirming downtrend
But one still need tomanage risk!
Trade plan In chart
our one trade is already running of Sell for CHFJPY

CHFJPYCHFJPY Sell Plan
SL Entry Tp Partial booking metioned in charts lets print $$$
Key Fundamental Points:
Export Shock Hits Japanese Corporates
FX Pressure Could Weaken the Yen Further — or Bolster It Short-Term
U.S.–Japan trade talks may include FX discussions, but no strong pressure is expected to strengthen the yen. Trump’s tariffs continue to weigh down Japan’s growth and could further tilt downward.

SHORT ON SPX/USDSpy has created a Double top followed by a CHOC and retest to the downside.
Their is plenty sell side liquidity to be collected as I expect a major drop on spy.
Looking to catch 300-400 points on SPY.


EURUSD Bearish Market Structure Unfolding – Liquidity Grab BelowEURUSD Bearish Market Structure Unfolding – Liquidity Grab Below Support Expected"
🔍 Technical Analysis Breakdown:
🔺 Resistance Zone (1.17500 - 1.18500)
Labelled “Strong High”, this is a high-supply zone where price previously reversed.
Multiple Break of Structure (BOS) and Change of Character (CHoCH) confirm this as a strong bearish supply area.
Any retracement toward this level could be ideal for short entries.
🟩 Fair Value Gap (FVG)
This imbalance area previously served as a magnet for price before it broke down.
Price failed to hold inside the FVG, reinforcing bearish sentiment.
🔻 Support Zone (1.13500 - 1.14000)
Marked as a "Weak Low", suggesting this level is likely to be taken out in a liquidity sweep.
Price is expected to retest and potentially break below this zone in the near term.
📉 Current Price Action
Recent CHoCH (Bearish) confirms shift in structure.
Price has made a corrective pullback and seems poised for another leg down.
Highlighted grey zone suggests price may retrace slightly higher before continuing its bearish move.
🎯 Bias: Bearish
Expecting downside continuation toward 1.13500 support, targeting liquidity below.
Traders may wait for rejection signals on lower timeframes around the minor pullback zone before executing shorts.
📚 Educational Notes:
CHoCH indicates a shift in market sentiment (from bullish to bearish).
FVG often acts as a magnet but if not respected, confirms momentum in the opposite direction.
Support/Resistance zones are used to determine institutional activity zones.

LINK SHORT It seems like a lower high has now formed. Following the trend positioning into a short position makes sense here.
