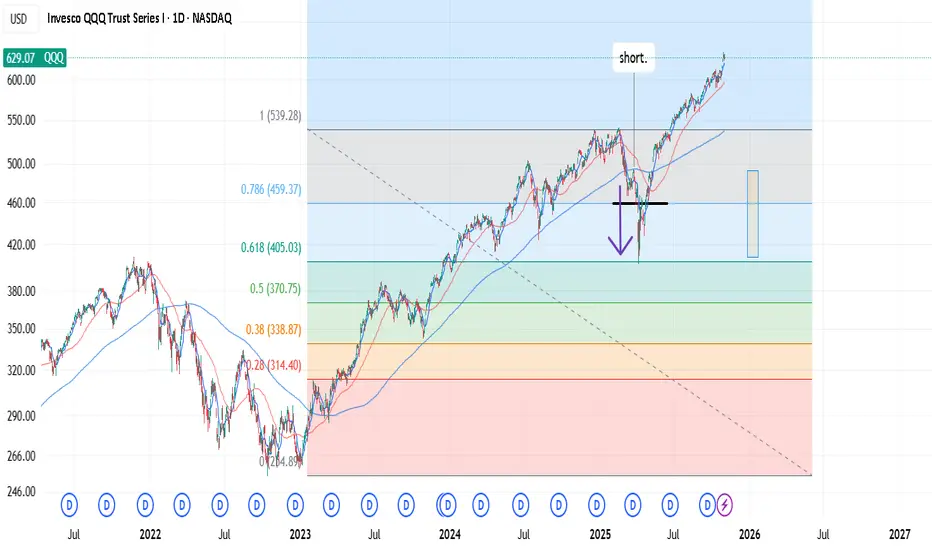
Fibonacci levels. Trading corrections.I saw a Lance B video saying that fibonacci is garbage that people use with a confirmation bias, and it doesn't work. (He says, anything besides the 50% FIB). His thesis is that fibonacci is a phenomenum from nature and at some point traders decide to test and apply it in markets.
I disagree. Using LOG trend, during corrections, prices respect the fib level ratio . It's math, more or less. I only trade tickers, if the moves are in the correlation with whole market (index). I also think, it's practical only on corrections, bear markets. 🤔
-> When the "key" level breaks, it tests the next level . Which isn't practical due to high variance.
-> which means, you build the shorts during last resistance . Where market forces pull over. (50dma death cross as a force).
(Your hedge is the inertia from 50dma DC).
I think this is a cool, powerful setup to keep it mind. 👏
Shortsetup
Gold price adjusted down below 4000 next week✍️ NOVA hello everyone, Let's comment on gold price next week from 11/03/2025 - 11/07/2025
⭐️GOLDEN INFORMATION:
Gold (XAU/USD) edges lower on Friday, slipping below the $4,000 mark as traders reassess the Federal Reserve’s (Fed) policy outlook after this week’s rate cut. The metal trades near $3,985, down about 1% on the day and heading for a second consecutive weekly loss.
A stronger US Dollar and steady Treasury yields weigh on Gold, as markets trim bets on another Fed rate cut this year. Chair Jerome Powell signaled a cautious stance, noting that a December cut is “not a foregone conclusion” and policy will depend on incoming data.
⭐️Personal comments NOVA:
Gold price lacks bullish momentum, accumulates and corrects down below 4000
🔥 Technically:
Based on the resistance and support areas of the gold price according to the H4 frame, NOVA identifies the important key areas as follows:
Resistance: $4154, $4235
Support: $3953, $3884
🔥 NOTE:
Note: Nova wishes traders to manage their capital well
- take the number of lots that match your capital
- Takeprofit equal to 4-6% of capital account
- Stoplose equal to 2-3% of capital account
- The winner is the one who sticks with the market the longest

ETH >>>>>>> ShortIn the 12-month cyclical pattern of Ethereum, I foresee a downward trend developing during 2026 and 2027.
Based on the recurring structure of Ethereum’s price movements and its historical cycle behavior, I’ve identified three potential levels (or “steps”) of decline that could act as key support zones during this corrective phase.
These three steps represent possible stages where:
The first pullback may begin .. a short-term correction or initial cooldown.
The second step could serve as a consolidation or mid-cycle stabilization area.
The third step may form the major cycle bottom, where market accumulation begins and prepares for the next upward phase.
Overall, this outlook is derived from Ethereum’s repeating annual patterns, historical cycle analysis, and its correlation with broader crypto-market dynamics.
Therefore, I expect a corrective and accumulation phase throughout 2026–2027, potentially setting the stage for Ethereum’s next major rally once the cycle resets.

Scalp Short – JELLYJELLY💎 Scalp Short – JELLYJELLY
RSI is extremely overbought across all major timeframes — 1H and 4H readings are near 100, signaling exhaustion.
A reversal pinbar has formed, confirming selling pressure as buyers hesitate to chase the top.
🎯 Plan:
→ Enter after confirmation of rejection from resistance.
→ TP: 0.1152 | SL: 1.16679 | RR: 1 : 3.35
Momentum favors the short side.
Keep positions light, trail SL as price declines.
Stay disciplined — wait for confirmation before execution.

Continue to accumulate along the 4058 trend line⭐️GOLDEN INFORMATION:
Gold (XAU/USD) faces renewed selling pressure after an early Asian uptick toward $4,046, pausing this week’s rebound from its lowest level since October 6. The US Dollar (USD) holds near a three-month high following the Federal Reserve’s hawkish stance, weighing on the non-yielding metal.
Additionally, optimism over easing US–China trade tensions dampens safe-haven demand. Still, lingering worries about the prolonged US government shutdown could limit USD strength and offer some support to gold prices.
⭐️Personal comments NOVA:
market accumulation time, sideways around 4000. ended october with volatility
⭐️SET UP GOLD PRICE:
🔥SELL GOLD zone: 4058 - 4060 SL 4065
TP1: $4050
TP2: $4040
TP3: $4020
🔥BUY GOLD zone: 3887 - 3885 SL 3880
TP1: $3900
TP2: $3910
TP3: $3925
⭐️Technical analysis:
Based on technical indicators EMA 34, EMA89 and support resistance areas to set up a reasonable sell order.
⭐️NOTE:
Note: Nova wishes traders to manage their capital well
- take the number of lots that match your capital
- Takeprofit equal to 4-6% of capital account
- Stoplose equal to 2-3% of capital account

OKE 1D Investment Short Conservative Trend TradeConservative Trend Trade
+ short impulse
+ T2 level
+ resistance zone
+ biggest volume Ut
+ weak test?
Bought a put
1 to 2 R/R ratio
1M Trend Trade
"+ short impulse
- neutral zone"
1Y CounterTrend Trade
"- long balance
+ biggest volume resistance level
+ volumed reaction bar"

Gold price trading below 4000⭐️GOLDEN INFORMATION:
Gold (XAU/USD) steadies near $3,950 per ounce in Asian trading on Thursday, snapping a four-day losing streak. Prices find support from ongoing central bank buying and renewed ETF inflows, which have tightened supply in both official and market channels. However, gains remain capped after Fed Chair Jerome Powell signaled that another rate cut in December is uncertain, pushing 10-year Treasury yields above 4% and raising the opportunity cost of holding non-yielding bullion. The Fed had earlier delivered a widely expected 25-basis-point rate cut.
⭐️Personal comments NOVA:
Gold price is moving sideways, accumulating below 4000. Gold's long-term correction downtrend
⭐️SET UP GOLD PRICE:
🔥SELL GOLD zone: 4030 - 4032 SL 4037
TP1: $4020
TP2: $4010
TP3: $4000
🔥BUY GOLD zone: 3886 - 3884 SL 3879
TP1: $3900
TP2: $3910
TP3: $3925
⭐️Technical analysis:
Based on technical indicators EMA 34, EMA89 and support resistance areas to set up a reasonable sell order.
⭐️NOTE:
Note: Nova wishes traders to manage their capital well
- take the number of lots that match your capital
- Takeprofit equal to 4-6% of capital account
- Stoplose equal to 2-3% of capital account

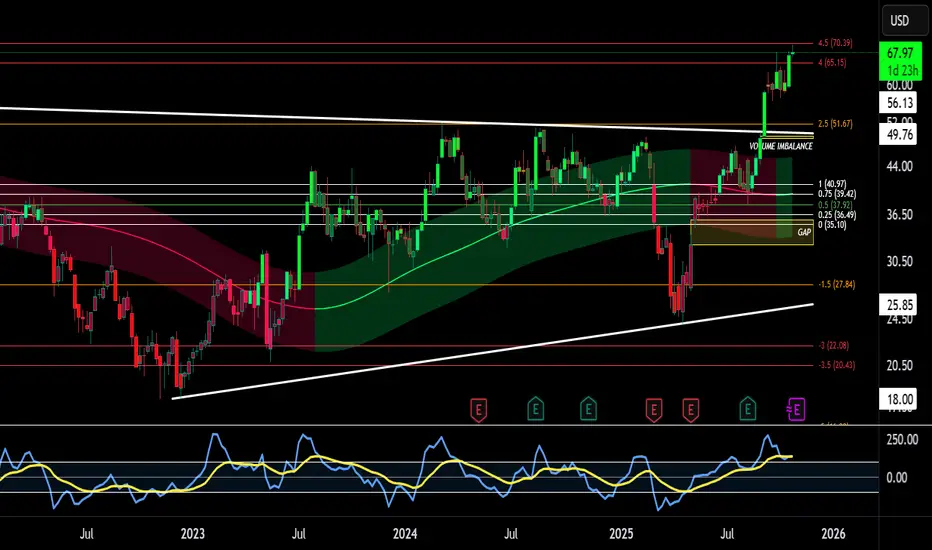
Las Vegas SPHERE showing signs of a top.SPHERE has been on an incredible run for quite some time now, but with revenues decreasing and the hype surrounding the Las Vegas Sphere fading as people tighten their wallets in the current economic climate, declining ticket sales—combined with extremely high energy costs—could trigger a sharp correction. SPHERE may move to lower levels to fill previous volume imbalances and gaps (highlighted in yellow).
Good luck everyone!
Scalp Short – ZEC💎 Scalp Short – ZEC
Higher timeframes show overbought conditions, while trading volume is weakening.
Price action signals a potential correction phase after recent strength.
🎯 Plan:
→ Enter after confirmation of rejection from resistance.
→ TP: 355.9 | SL: 374.58 | RR: 1 : 1.85
Momentum favors short setups.
Keep positions light, trail SL as price drops.
Stay patient — wait for clear confirmation before entry.

Bear Season on GBPUSD: Let's Catch This Move!!!!!! 1. Trend Direction: The 4H TF shows a clear bearish structure creating LH & LL. Although price is currently appearing choppy in a down trend, bears are still in control.
2. 1H Confirmation: Price shows a clearer market structure confirming the 4H trend direction. The fib tool was placed at the last LH & LL to wait for a pullback above the 50% zone for an entry on the LTF.
3. Entry Zone: 15m| 5m is the best TF to enter the trade. Clear structure, smaller SL & huge profits. Quick in, Quick out. Either wait for a change in structure and enter on the pullback, or wait for a candlestick pattern for entry.
Risk: 1% of your capital.
TP: KQP-1.33000 or Last 1H Low, which is approx 50pips.

Gold downtrend, accumulation below 4000⭐️GOLDEN INFORMATION:
Gold (XAU/USD) picks up modestly in Tuesday’s Asian session, rebounding from a two-week low near $3,972. A softer US Dollar, pressured by expectations of two more Fed rate cuts this year, supports the non-yielding metal. Ongoing geopolitical tensions from the Russia-Ukraine conflict also add to its safe-haven appeal.
⭐️Personal comments NOVA:
There is still selling pressure, gold is definitely correcting below 4000, the market is waiting for interest rate results
⭐️SET UP GOLD PRICE:
🔥SELL GOLD zone: 4090 - 4092 SL 4097
TP1: $4080
TP2: $4070
TP3: $4050
🔥BUY GOLD zone: 3941 - 3943 SL 3936
TP1: $3960
TP2: $3980
TP3: $4000
⭐️Technical analysis:
Based on technical indicators EMA 34, EMA89 and support resistance areas to set up a reasonable SELL order.
⭐️NOTE:
Note: Nova wishes traders to manage their capital well
- take the number of lots that match your capital
- Takeprofit equal to 4-6% of capital account
- Stoplose equal to 2-3% of capital account

Is Nasdaq Set for a Pullback? | Fibonacci Resistance Zone ahead!In this video I map out the idea of the Nasdaq being over extended and on route to approaching a key Fibonacci resistance level 27000 ,
This may set up a potential correction in the week ahead."
This is a counter-trend setup within a larger uptrend, so risk management is key. I'm not calling a top to the entire rally, but rather a healthy pullback to bring in new buyers."
I demonstrate how i see the price action moving forward over the course of the month ahead with valuable insights.
Tools used in this video Standard Fib , Fib Expansion, Fib extension + Anchored vwap and Volume profile and TPO chart

BTC recovers before interest rate announcementBitcoin (BTC/USD) – Daily Chart Analysis
Bitcoin is currently trading around the 114K–115K zone after rebounding from the ascending support trendline near 108K. This reaction confirms that buyers are still defending the broader bullish structure, but significant resistance lies ahead.
Key Observations:
Resistance Zone (117K–118K):
This area has acted as a strong supply zone in the past, where price was previously rejected twice (marked by red arrows). It also aligns with the EMA 89 and volume cluster, making it a critical barrier for bulls.
Support Zone (108K–102K):
The lower trendline and horizontal support near 102K–104K remain vital for the long-term bullish structure. A break below this region would open the door for deeper correction toward 100K.
EMA Confluence:
The short-term moving averages (EMA 34 and 89) are attempting to turn upward, suggesting early signs of recovery—but confirmation requires a daily close above 118K.
Possible Scenarios:
Bullish Case:
If BTC successfully breaks and closes above 118K, momentum could accelerate toward 127K–128K, where the upper trendline and major resistance coincide.
Bearish Case:
If price faces rejection at the 117K–118K zone, a retest of 108K, or even 102K, is likely before the next major move.
Outlook:
Bitcoin remains in a neutral-to-bullish phase short term, but traders should closely monitor the 117K–118K resistance for potential rejection or breakout confirmation.

SHORT ON AUD/JPYAUD/JPY has made a pullback to a major supply area while also mitigating a FVG (fair value gap) in the same zone.
Jpyx index has major potential to rise. I expect AJ to fall and from this zone.
Looking to make 200-300 pips throughout the week.

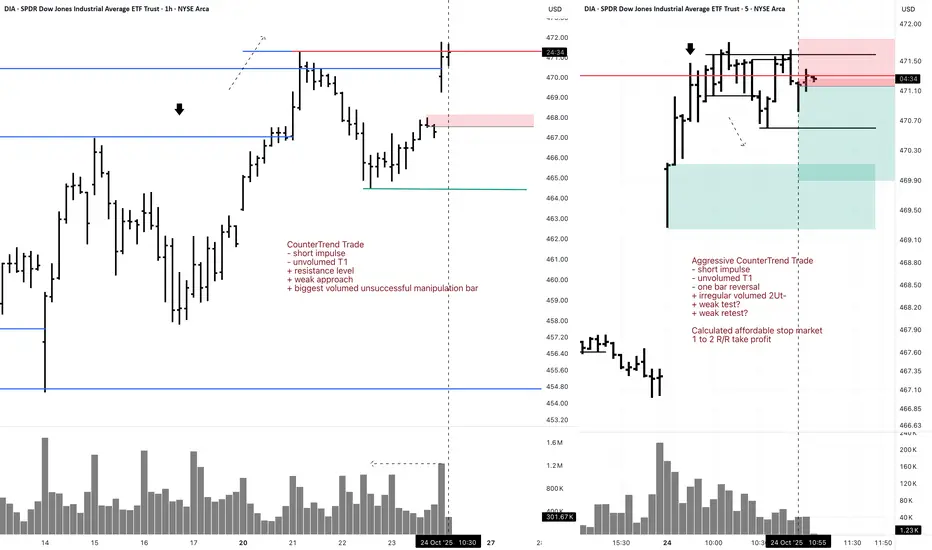
DIA 5M Short Aggressive CounterTrend DayTradeAggressive CounterTrend Trade
- short impulse
- unvolumed T1
- one bar reversal
+ irregular volumed 2Ut-
+ weak test?
+ weak retest?
Calculated affordable stop market
1 to 2 R/R take profit
1H CounterTrend
"- short impulse
- unvolumed T1
+ resistance level
+ weak approach
+ biggest volumed unsuccessful manipulation bar"
1D CounterTrend
"- short balance
+ expanding CREEK
+ weak approach"
1M countertrend
"- long impulse
- neutral zone
+ exhaustion volume?"
1Y CounterTrend
"- long impulse
+ beyond rotation point
- neutral zone"
IDOL - Scalp Short🎯 Trade Setup – SHORT
Reason: Strong bearish momentum signs — RSI shows clear divergence (price rising while RSI drops) → signal of weakening buying strength.
Volume is declining despite price increase, indicating low participation and possible exhaustion of the up-move.
Short‐term uptrend support line has been broken → structure shift favouring downside.
📌 Trade Plan:
Entry: After confirmation of trend-line breakdown + momentum/volume confirmation.
TP (Take Profit): 0.03086
SL (Stop Loss): 0.04007
Risk/Reward (RR): ~ 1 : 2
✅ Key Guidelines:
Size position accordingly: risk defined by SL.
Only enter after breakdown and/or bearish confirmation (e.g., bearish candle, retest failure).
If momentum fails (volume picks up on rises) then abort.
Maintain discipline — trust the plan, not the hope.

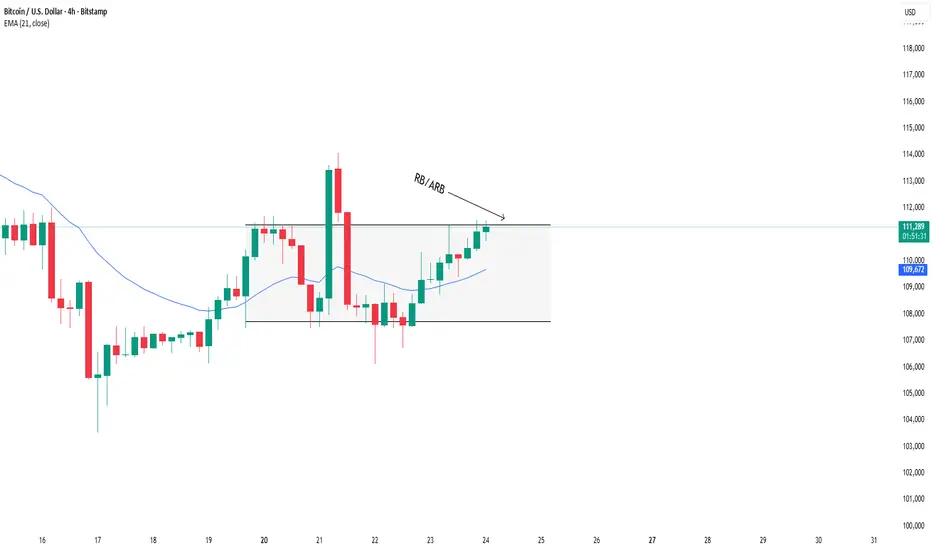
BTCUSD: Waiting for breakout confirmation near the range highBTCUSD – Analysis for October 24, 2025
Yesterday, we had two trading setups for BITSTAMP:BTCUSD .
The IRB setup played out as planned when the price rebounded from the EMA, formed a consolidation zone within the range, and then broke out strongly, pushing up toward the upper boundary of the range.
This move shows that bullish momentum is still present, although the resistance near the range high remains a key area where short-term profit-taking may occur.
Today’s Trading Plan
Wait for the price to compress and form a tight consolidation zone near the upper boundary of the range.
Confirmation condition: No candle closes below the EMA, which would confirm that buying pressure remains in control.
Once a RB or ARB setup appears, that will be our signal to enter long positions.
Bullish Scenario (primary bias):
Entry: On confirmed RB/ARB setup near the upper edge of the range
Stop Loss: Below the nearest EMA
Take Profit: Targeting extended resistance levels above the range
Alternative Scenario:
If the price closes below the EMA and breaks the compression structure, we’ll stay out of the market and wait for a new setup once the structure stabilizes.
Summary
BTC continues to show strength, but the upper range boundary remains a key test.
Today’s plan: Wait – Confirm – Execute. Avoid FOMO until a clear confirmation appears.
Daniel Miller @ ZuperView
Gold price is consolidating around 4100⭐️GOLDEN INFORMATION:
Gold (XAU/USD) slips below $4,150 in Friday’s Asian session, weighed down by a firmer US Dollar and cautious sentiment after recent sharp losses. The end of India’s Diwali festival may also curb physical demand. However, lingering US government shutdown risks, global trade tensions, and expectations of US rate cuts could lend support to the non-yielding metal.
⭐️Personal comments NOVA:
Gold's downward correction is still continuing, accumulating below 4200. Buying power is weakening and there is not much momentum to increase prices this week.
⭐️SET UP GOLD PRICE:
🔥SELL GOLD zone: 4217 - 4219 SL 4224
TP1: $4202
TP2: $4190
TP3: $4170
🔥BUY GOLD zone: 3954 - 3956 SL 3949
TP1: $3970
TP2: $3990
TP3: $4015
⭐️Technical analysis:
Based on technical indicators EMA 34, EMA89 and support resistance areas to set up a reasonable SELL order.
⭐️NOTE:
Note: Nova wishes traders to manage their capital well
- take the number of lots that match your capital
- Takeprofit equal to 4-6% of capital account
- Stoplose equal to 2-3% of capital account

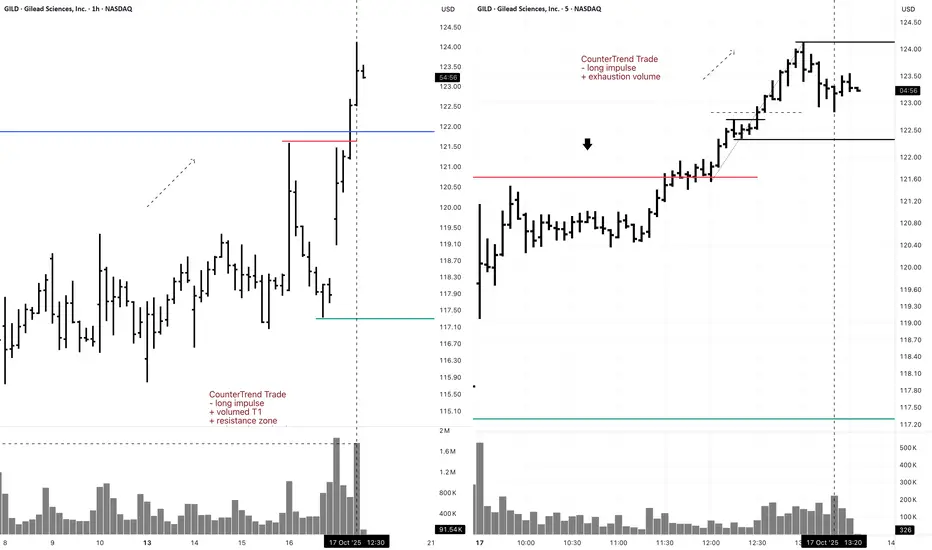
GILD 5M Short CounterTrend Daytrade (Buy Put to Open)5M CounterTrend Trade
- long impulse
+ exhaustion volume
1H CounterTrend
"- long impulse
+ volumed T1
+ resistance zone
+ volumed reaction bar"
1D CounterTrend
"- long impulse
- unvolumed T1
+ resistance level
+ volumed manipulation bar "
1M CounterTrend
"- long impulse
+ volumed T1 level
+ resistance zone"
1Y CounterTrend
"- long impulse
- unvolumed T1
+ resistance zone"
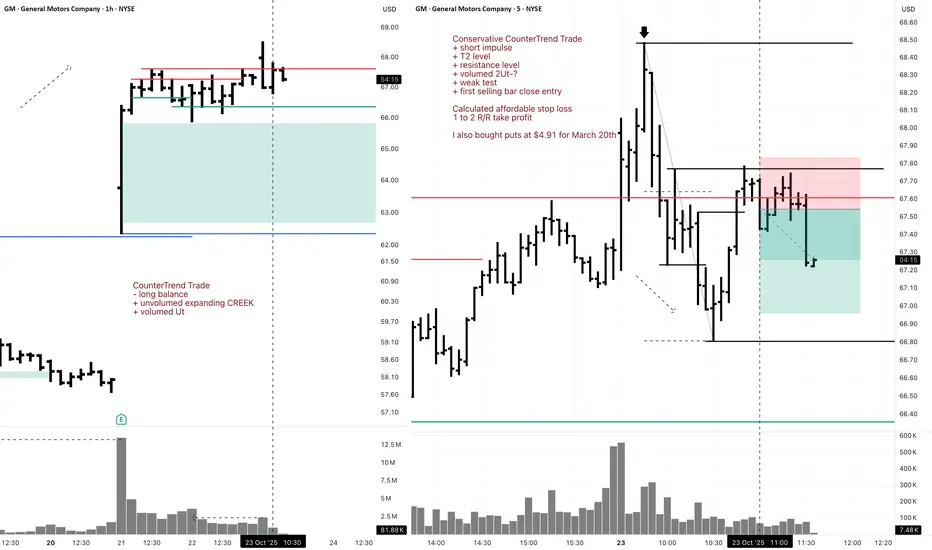
GM Short 5M DayTrade Conservative CounterTrend TradeConservative CounterTrend Trade
+ short impulse
+ T2 level
+ resistance level
+ volumed 2Ut-?
+ weak test
+ first selling bar close entry
Calculated affordable stop loss
1 to 2 R/R take profit
I also bought puts at $4.91 for March 20th
1H CounterTrade
"- long balance
+ unvolumed expanding CREEK
+ volumed Ut"
1D CounterTrend
"- long impulse
- neutral zone
+ exhaustion volume?"
1M CounterTrade
"- long impulse
- unvolumed T1
+ resistance zone
+ volumed manipulation bar
- volumed reaction bar looks for break
- volume distribution is long"
1Y CounterTrend
"- long balance
+ expanding volumed CREEK
+ resistance level"
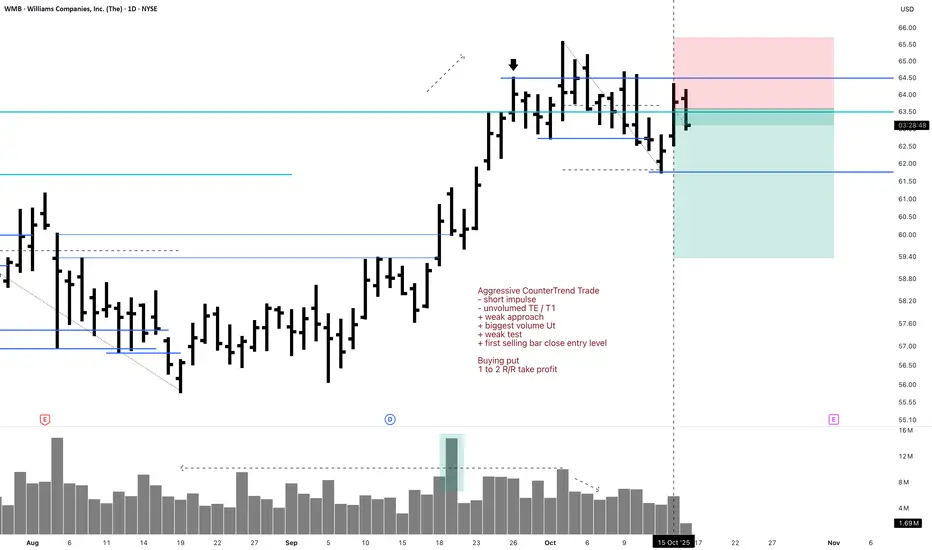
WMB 1D Short Aggressive CounterTrend Trade (Put Buy to Open)Aggressive CounterTrend Trade
- short impulse
- unvolumed TE / T1
+ weak approach
+ biggest volume Ut
+ weak test
+ first selling bar close entry level
Buying put
1 to 2 R/R take profit
Monthly CounterTrend
"- short balance
+ volumed expanding CREEK
+ resistance level
= wrong volume distribution weak approach"
Yearly CounterTrend
"- short balance
+ volumed expanding CREEK
+ resistance level
= wrong volume distribution weak approach"
Bitcoin - Ultimate Swing Short As a compilation and summary of my previous ideas explaining in depth this signal - the why, when, how - here are the specific details for this swing short position.
Entry - 109,000 to 109,200
Stop Loss - 113,600
Target 1 - 97,600
Target 2 - 81,000
Target 3 - 63,400
Target 4 - 34,800
(Here is where I’ll potentially be signalling for a hedge long on Bitcoin from 34,700 to 80,000 - trading the retracement wave)
Target 5 - 20,000
Target 6 - 8,000
Ultimate wick bottom expected to be 7,200 to 7,800 range.
Good luck to all and any questions at all, please comment below.
I’ve linked any related ideas to this post here which you can view below.
- DD

Is this a Bump and Run Reversal for Nike - 60% gains potential In this video I cover what could potentially be a reversal pattern playing out on Nike .
I cover the price action from the ATH down to the lows and present the idea of a bump and run
reversal pattern which could generate 60% gains .
Setting alerts is key and watching volume as explained in the video .
Please like and support my work any questions then ask below the chart .
Safe trading
