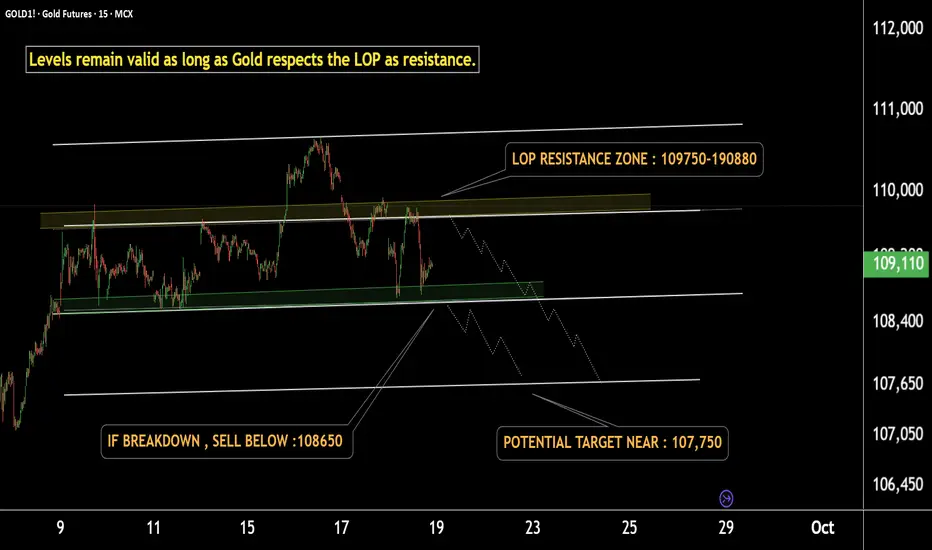
Gold setup indicates a fall ahead – Stay alert, traders!This is the 15-minute chart of GOLD1!
Gold is moving in a well-defined parallel channel and currently respecting the LOP resistance zone at 109750–109850.
The channel’s lower boundary near 108650 may act as short-term support.
If Gold breaks down below this support, the projected downside target is near 107750.
In case of range-bound movement, the ideal sell zone remains at the LOP (109750–109850).
If this resistance level sustains, Gold may fall and test the lower targets.
Additionally, a Head & Shoulders pattern has formed within the channel, with its downside target aligning with the channel projection.
Thank you.
Shoulder
GBPUSD at make or break level ahead of a split BOEThe BOE faces a pivotal moment as it prepares to announce its latest interest rate decision.
With MPC members split between hawkish concerns about stubborn inflation and dovish worries over a weakening job market, expectations are swirling about the path forward.
Will the BOE signal a pause after this cut, or will inflation surprises force a more cautious, hawkish stance going into the end of the year?
Traders are watching for clues in the updated forecasts, as even a minor shift could spark major volatility in GBP/USD.
If the BOE sounds hawkish—maybe they raise their inflation forecasts, or the vote split shows strong resistance to further cuts, or they signal a pause in easing—then GBPUSD might have found a bottom for now.
On the flip side, if the BOE puts more emphasis on economic risks, reduces its GDP outlook, or if the vote split shows a strong push for even bigger cuts, then the pound could come under pressure.
On the charts, Cable is clinging to 1.3375, with a potential developing head and shoulders pattern threatening a deeper move lower if the neckline breaks.
Will the upcoming BOE decision be the make-or-break catalyst for the pound?
This content is not directed to residents of the EU or UK. Any opinions, news, research, analyses, prices or other information contained on this website is provided as general market commentary and does not constitute investment advice. ThinkMarkets will not accept liability for any loss or damage including, without limitation, to any loss of profit which may arise directly or indirectly from use of or reliance on such information.

Yes the chicken man - PPC Short?PPC is at the bottom of a monthly box and at VAL of the daily and weekly anchored volume profile. It could catch a bid here and retest $45.60s(VPOC).
If the retest ends in a rejection of that area, and a daily close below the previous low around $41.95 then I expect short continuation and validation of the H&S.
I would especially like this trade after a retest and rejection of box bottom around $43.41 - $43.30.
My targets would be 40.11, 38.98, 37.27,35.96 then 33.72.

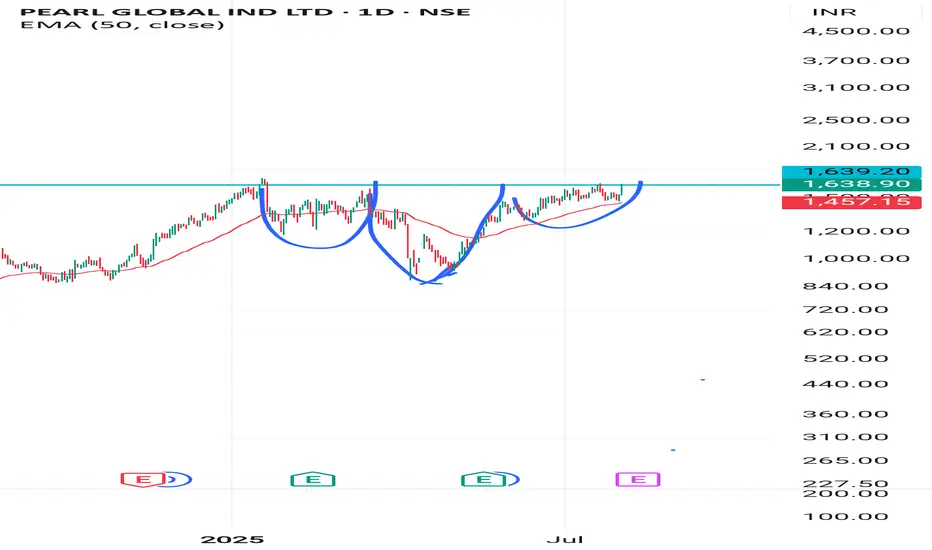
PGIL IS FORMING HEAD AND SHOULDER IN DAILY CANDLE ANALYSISAfter a long consolidation and up and downs , a bullish pattern is formed and ready to breake the neck line.
Above neckline
Target 1 1999.
Target 2 2349
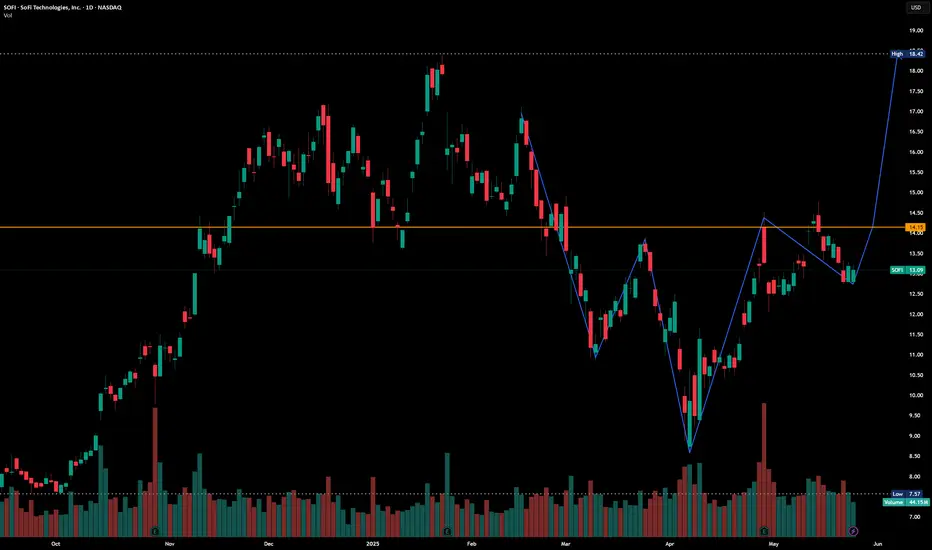
SOFI Charts are interesting.. SOFI is in making of Inverted head and Shoulder pattern. Current market Price is nearly $13. If cross $14.90 and sustain , it may got to $18 and $20.
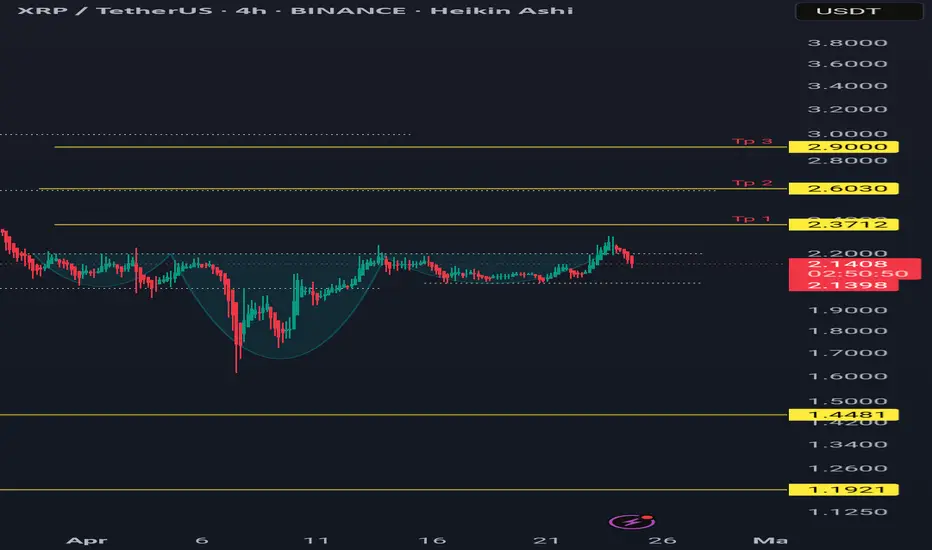
Xrpusdt formed a ihead and shoulder patternXrpusdt formed a ihead and shoulder pattern
Buy area
2.2-2.05
Targets are 2.37 tp 20%
2.6 tp 50% then move to breakeven
2.9 100%
Invalidation bellow the right shoulder
2.02
Who knows ?SUZB3 is in an uptrend channel on the monthly chart, specifically at the lower edge of this channel, in a region that would indicate a buy, however, at this position on the 2-hour chart it presents a head and shoulders pattern at the end of a downtrend line. Meanwhile, the RSI shows divergence indicating a reversal to an uptrend.

Bitcoin Breakdown Head & Shoulders Pattern Death Cross in Play?This daily BTC/USD chart is showing a potential Head & Shoulders pattern, which is a classic bearish reversal structure. But that’s not all Bitcoin is also at risk of forming a Death Cross, signaling deeper downside potential. Here’s what stands out:
🛑 Key Bearish Signals:
🔻 Head & Shoulders Formation: The pattern consists of a peak (head) with two lower peaks (shoulders) on either side, indicating a loss of bullish momentum.
🔻 Neckline Breakdown: BTC is testing the neckline support around $76,000—a break below this level could trigger further downside.
🔻 Death Cross Forming: The 50 SMA (yellow) is sloping downward, getting dangerously close to crossing below the 200 SMA (blue)—a well-known bearish signal that could accelerate selling pressure.
📉 Bearish Targets if Breakdown Confirmed:
If BTC breaks below $76,000, the measured move projection suggests a possible drop toward $50,000-$52,000, aligning with previous structure support.
🚀 Bullish Case – Can BTC Recover?
For bulls to regain control, Bitcoin must reclaim $88,000+, invalidate the breakdown, and push above key moving averages. Otherwise, downside pressure remains strong.
⚠️ Final Thought: Death Cross + Head & Shoulders = Bearish Storm?
A Death Cross happening alongside a Head & Shoulders breakdown is a dangerous combination for bulls:
- A Death Cross occurs when the 50-day moving average crosses below the 200-day moving average, signaling a long-term trend shift to the downside.
- Historically, BTC has seen major sell-offs after this formation, especially when combined with bearish structures like we see now.
- If BTC loses $76,000, the next stop could be $50,000-$52,000—but if bulls defend this level and reclaim FWB:88K +, they can avoid disaster.
Verdict : Bitcoin is at a make-or-break moment—either bulls step in now, or we could see a steep drop ahead. Will you short, or do you think this is a bear trap? Let’s discuss! 🧐🔥

SOL/USDT: Are We Gearing Up for a Big Move?Take a step back and look at the big picture for SOL/USDT. There's a long-term head and shoulders pattern forming that could redefine where Solana is headed. Pair that with the Hurst cycles, and we have a cocktail of signals that just… works.
If this plays out, we might see a week-long breach of the upper trend line in the next 18 months—a move that would confirm higher highs are on the horizon.
This is the kind of setup that rewards patience. Do you see it breaking out, or is this just wishful thinking? Follow and share your thoughts below—let’s see how this one plays out. 🚀

$BTC 1D looking good boys! Possible Head?I’m not sure but if it is a head for the second shoulder instead and this is the half way point in this last end of the Bull Run maybe months left but it’s coming to the MAIN part then it will slow up and go sideways if not down A LOT.
Just be prepared for it and know a plan or strategy to get out with profit even to a stable coin or flipping coins that profit at different times and flip them when one coin pumps the other dumps and vice versus some ppl have done this virally and got Insta famous and rich.
Don’t not experiment here. Buy something you wouldn’t think you would but be sure it’s a good bag first due diligence is always needed.
This chart and my talk IS NOT FINACIAL ADVICE AS I AM NOT ONE .

btc reversal trendline + left shouldersbtc hit the lows after 8 months or so of consolidation and was quickly bought back up
"weak to strong hand transfer" is a fitting name for what is happening
a close above previous "failed" support would form a nice left shoulder buy setup

EUR/CHF ⬆️ Long Trade setup ⬆️Hello Everyone.
Head & Shoulders
💲 Entry Point : 0.94737
🟢 TP 0.95489
🔴 SL 0.94361
Please support us with like & comment & Follow
Disclaimer
---------------
Trading is risky we all take loses
your responsibility is to not take more than 1% to 2% loss per trade and double your profits.

Reliance Head and Shoulder Pattern Hourly ChartHead and Shoulders Pattern: This is a popular chart pattern in technical analysis that can indicate a potential trend reversal. It consists of three peaks: a higher peak (head) between two lower peaks (shoulders). It suggests that the stock's price might change direction from an upward trend to a downward one.
Left Shoulder, Head, and Right Shoulder: These refer to the three peaks in the pattern. The left shoulder has a high of 2543, the head has a high of 2630, and the right shoulder has a high of 2559. The head is the highest point among the three.
Breakdown Target: In a head and shoulders pattern, analysts often measure the potential downward movement after the pattern completes. The "height of the head" is the vertical distance from the head's high to the neckline (more on this in the next point). In this case, the height of the head is 2630-2473=2316.
Neckline: The neckline is a support level that connects the lowest points of the two troughs between the peaks (shoulders) in the pattern. In this case, it seems like the neckline is at a value of Rs. 2473.
Breakdown of the Neckline: A significant event occurs when the stock's price breaks below the neckline. This is seen as a confirmation of the pattern and a potential signal for a trend reversal. In this scenario, if Reliance's stock price drops below Rs. 2473 (the neckline), it suggests a potential further decline in price.
Downside Target: The "156 point downside in reliance" refers to the expected price movement if the breakdown occurs. It's calculated by taking the "height of the head" (difference between head high and neckline) and subtracting it from the neckline value. So, 2630 - 2473 = 156.
In summary, the analysis suggests that if Reliance's stock price breaks below the neckline value of Rs. 2473, there could be a potential downward movement of 156 points in the stock, based on the head and shoulders pattern on the hourly time frame. This type of analysis is used by traders and investors to make informed decisions about buying or selling stocks.
The information provided here is for educational and informational purposes only. It does not constitute financial advice, and I am not a financial advisor.
Disclaimer: Trading stocks and making investment decisions involves inherent risks, and you should always conduct thorough research and consider seeking advice from qualified professionals before making any financial decisions. The analysis presented, including the target price calculation, is based on technical patterns and historical data, which may not accurately predict future price movements. The actual performance of stocks can vary widely from any analysis or prediction. Always exercise caution and due diligence when making investment choices.
Thank you.

Head and shoulder pattern breakout in SIEMENSSIEMENS INDIA LTD
Key highlights: 💡⚡️
✅On 1Hour Time Frame Stock Showing Breakout of head and shoulder pattern.
✅ Strong Bullish Candlestick Form on this timeframe.
✅It can give movement up to the Breakout target of 3858+.
✅Can Go short in this stock by placing a stop loss above 3695-

MShort

USDJPY HEAD AND SHOULDERSHead & Shoulders forming on USD/JPY. We will use downside targets using the Fib extension. This chart is based on the weekly timeframe.

Inverse Head and Shoulder BTCUSDBased on the current Bitcoin chart, we can see a potential inverse head and shoulders pattern forming. The neckline is around the $24,600 level, and if Bitcoin breaks above this level, it could confirm the pattern.
If the inverse head and shoulders pattern is confirmed, the target price for Bitcoin would be the distance between the head and the neckline projected upwards from the neckline. In this case, that would give a target price of around $26,111.
It is important to note that the inverse head and shoulders pattern is not a guarantee of a trend reversal. Traders should always use other indicators and analysis techniques to confirm their trading decisions. Additionally, the cryptocurrency market is highly volatile, and prices can move quickly and unpredictably. Therefore, traders should always use proper risk management techniques and be prepared for unexpected price movements.

Head and Sholders. BTCUSDT moves down along this patternBTCUSDT has been moving down Head and shoulders for several days. Probably further movement down this figure. The head and shoulders are automatically identified by my script:


Potential Head & Shoulders in play on BTC so watch out Potential Head & Shoulders in play on BTC so watch out
We could be looking at dropping down to $21k this week with a head & shoulders forming. IT would make about sense with that heading back to the CME gap along with an unfilled weekly pivot.

Russel 2000 Head and Shoulders in playAfter another head and shoulder that broke to the downside, we find a similar pattern playing out. As the RSI is pointing down whilst there is a downtrend in play, we are looking for the head and shoulders to be completed and break down.
The next target corresponds with the previous supports of dec. 2018 and aug. 2017.


Head and shoulder pattern 11-1-2023,
Head and shoulder pattern seen in kotak bank
In 1D timeframe
This analysis might not be perfect, nor we are sebi registered
This is our own opinion
Do not take any trades by just seeking this, take it on your own risks
