EURUSD Analysis – The Calm Before the BreakIf we exclude the sharp spike down from early August and the spike up in mid-September, EURUSD has been stuck in a sideways range for nearly three months, between 1.1600 and 1.1800 — quite a narrow band, even for such a stable pair.
In the past week, this consolidation has tightened even more, with price action trapped inside a mere 50-pip range between 1.1710 and 1.1760.
This kind of prolonged congestion usually ends with only one possible scenario — a breakout.
• Upside scenario:
A clean break above 1.1760 could trigger momentum buying, opening the way for a move toward the 1.1900 spike high.
• Downside scenario:
A decisive drop below 1.1710 would likely confirm a continuation to the downside, with 1.1500 emerging as the natural target zone.
At the moment, I’m out of the market, but my bias leans toward the downside — patiently waiting for the stars to align before taking action. 🌘
Signalprovider

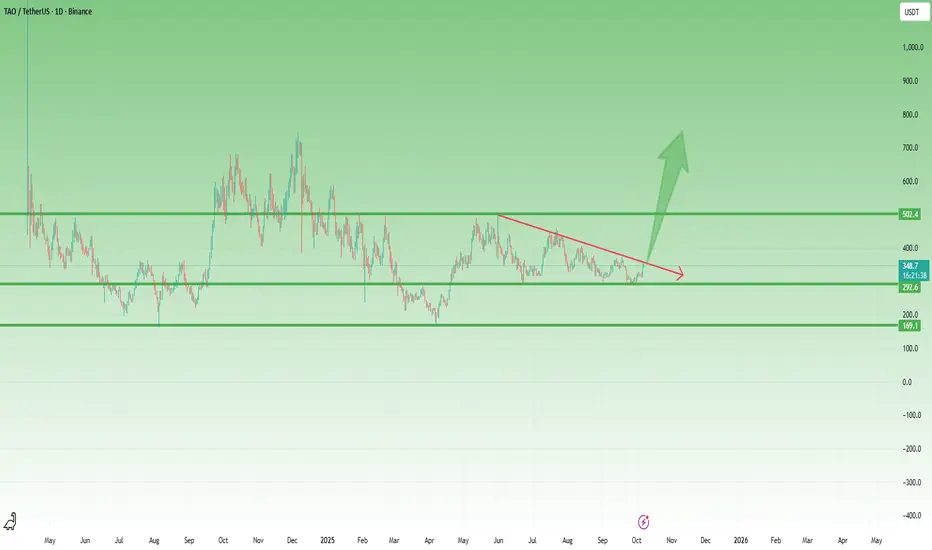
TAO – Constructive Recovery and Key Levels AheadTAO made a significant low in April, just like most crypto assets. Interestingly, this low is perfectly aligned with the one from August 2024, suggesting a strong structural base in the market. From that point, price started to rise in a very constructive and orderly manner, confirming a shift in sentiment.
After the initial rally, TAO touched the 500 zone, a key psychological and technical level. As expected, the market corrected from there, dropping just below 300. What’s notable is that the recent low sits precisely around this 300 area, now acting as a strong support level.
At the time of writing, the price is around 350, currently testing the falling trendline from previous highs. If we see a confirmed breakout above this line, I expect acceleration to the upside, with an initial and conservative target around 500.
However, if momentum continues to build, the next significant resistance lies near the 700+ area, which could translate into a 100% gain from current levels — a solid move if the trend structure holds.
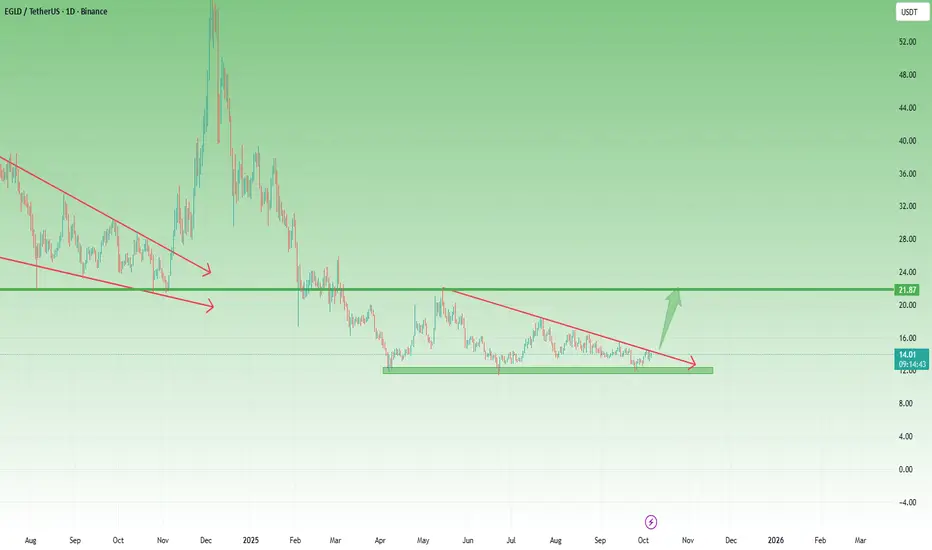
EGLD – Third Touch at $12 Support Could Ignite a Major ReversalEGLD has been on my radar for quite some time...
After forming a major low in April and rallying back toward the $22 zone, the coin pulled back again — effectively confirming that level as strong support.
By the end of September, price revisited the $12 area for the third time, and once again buyers stepped in decisively, triggering a solid rebound. Now, EGLD trades around $14, sitting just below a falling trendline that has capped upside momentum for months.
________________________________________
Technical Outlook
• Support: $12 (triple-tested, major demand zone)
• Resistance: Falling trendline around $14–15
• Soft target: $22 (key resistance and prior reversal area)
________________________________________
My Trading View
Given the strength of this repeated support and the contracting structure, I believe this trendline resistance is likely to break soon. If momentum follows through, EGLD could accelerate sharply to the upside, mirroring past explosive moves.
The setup remains constructive — buying dips above $12 could offer a strong risk–reward opportunity heading into the next leg higher.
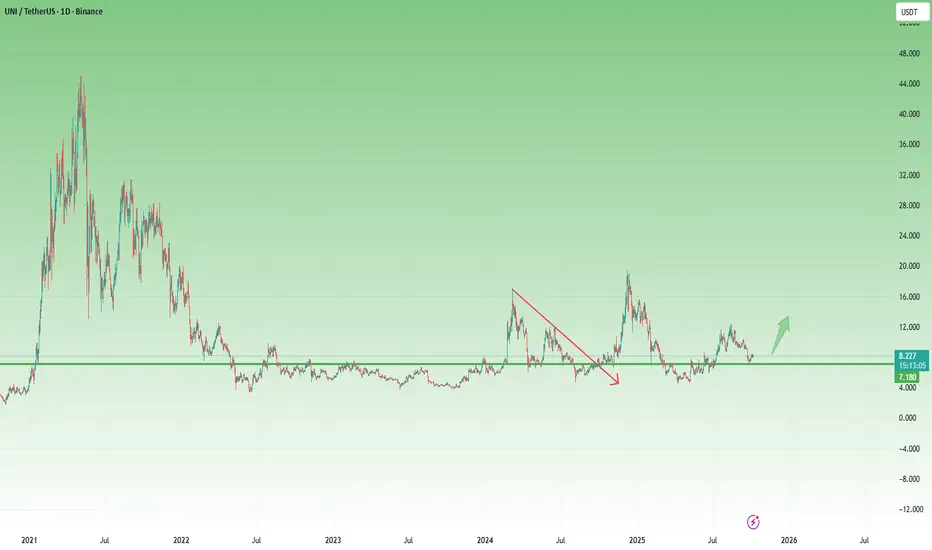
Uniswap Holding above $7 — Bullish Setup AheadAfter the massive 90% drop from its 2021 peak, Uniswap has been consolidating within a wide range. Each attempt to break higher has so far been followed by a return toward the lower end of the structure — a clear sign of prolonged accumulation.
What’s particularly interesting is how the $7 zone has consistently acted as a median level. Every time price dipped below it, UNI found demand and reversed back up. Recently, a solid support base has been confirmed around $5, further strengthening the bullish technical structure.
With the majority of altcoins now positioned for potential upward continuation, Uniswap could also be preparing for a significant leg higher, with a medium-term target around $14 per coin.
However, negation of this bullish setup would come with a clear breakdown below the $7 zone, which could open the way for a retest of the $5 support once again.
From a trading perspective, this setup offers an attractive 1:5 risk-to-reward ratio, making it an opportunity worth keeping on the radar — provided the $7 level holds.
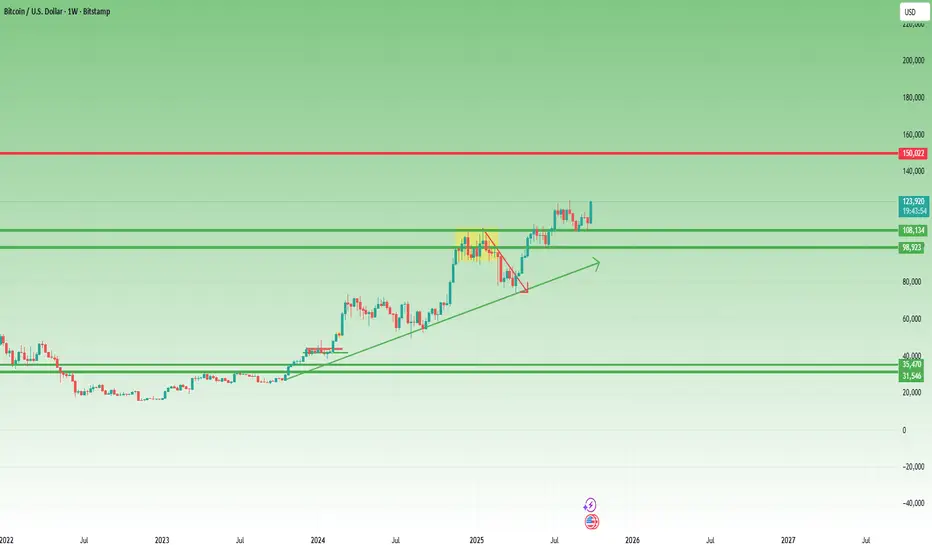
BTC Bulls in Control: 140K–150K Next?In my previous BTC analysis, I mentioned that 125K was the next target and that as long as 112K remains intact, bulls have nothing to worry about.
Since then, the price continued its ascent and is now flirting with the all-time high.
________________________________________
1️⃣ Is BTC Going to Make a New ATH?
From my point of view, it’s no longer a question of if , but how high it can go.
The trend is strong, momentum is building, and technically, we’re entering uncharted territory.
________________________________________
2️⃣ T echnical Context
After nearly three months of consolidation, clearly visible on the weekly chart, the breakout above the rectangle pattern gives us a measured target around 140K.
That’s the logical projection based on structure and continuation strength.
________________________________________
3️⃣ Can BTC Reach 150K?
Absolutely possible.
That’s only about a 20% move from current levels, and for Bitcoin, such moves are almost routine.
As long as 112K support holds, bulls remain fully in control.
________________________________________
Conclusion:
BTC seems ready to explore new highs.
Now the only question is — how far can this go? 🚀
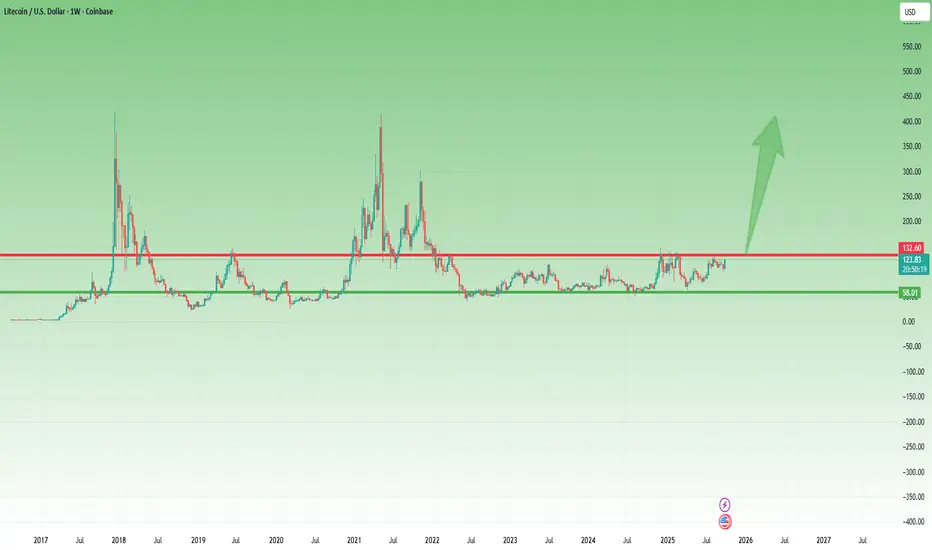
Litecoin Ready to Explode After 3 Years of SleepIn recent years, with the flood of new crypto projects, Litecoin has quietly faded into the background.
Since the local low in May 2022, the price action has been rather lethargic, contained within a well-defined range between 60 and 130 USD.
However, since April 2025, something interesting has been happening — Litecoin seems to be waking up, quietly and almost secretly, as if not to attract too much attention.
From that point onward, LTC/USD has been steadily printing higher lows, and if we zoom out to the longer-term chart, the structure looks remarkably clean — almost textbook — for a potential breakout setup.
Even recently, after another touch of the resistance zone, the correction that followed took the form of a bullish flag, and last week’s strong engulfing candle practically erased an entire month of pullback, now pressing once again against the key resistance level.
In my opinion, it’s time for this cryptocurrency to wake up.
A clear break above 130 would be a strong technical confirmation of that view.
While Litecoin might not deliver the “10x hype” potential that newer tokens promise, it has consistently proven to be one of the most stable and resilient assets in the crypto space.
After three years of accumulation, a breakout could easily trigger an explosive move to the upside.
📈 I’m personally buying Litecoin, with a target around 300 USD in the medium term.
Sometimes, the coins everyone forgets about are the ones that surprise the most. 🚀
ICP: False Break, Bullish Reversal in PlaySince the low from early April, ICP has traded within a well-defined range between $4.5 and $6.0.
Recently, the price broke below the range support, reaching as low as $4.0, but this move lacked follow-through. Instead, ICP quickly rebounded — a classic false break signal.
This rebound also resulted in a break above the descending trendline that started in mid-August, giving the chart a decisively bullish tone.
At this stage, all signals point toward further upside continuation, with the upper boundary near $6.0 as the first natural target.
However, considering that false breaks in one direction often lead to real breaks in the opposite, there’s a strong possibility that ICP could break above $6.0 in the medium term, potentially accelerating toward the key $10.0 zone.
________________________________________
✅ Key Takeaways:
• Range: $4.5 – $6.0
• False break below $4.0 reversed quickly
• Trendline from August broken to the upside
• Bullish outlook → targets $6.0 and possibly $10.0

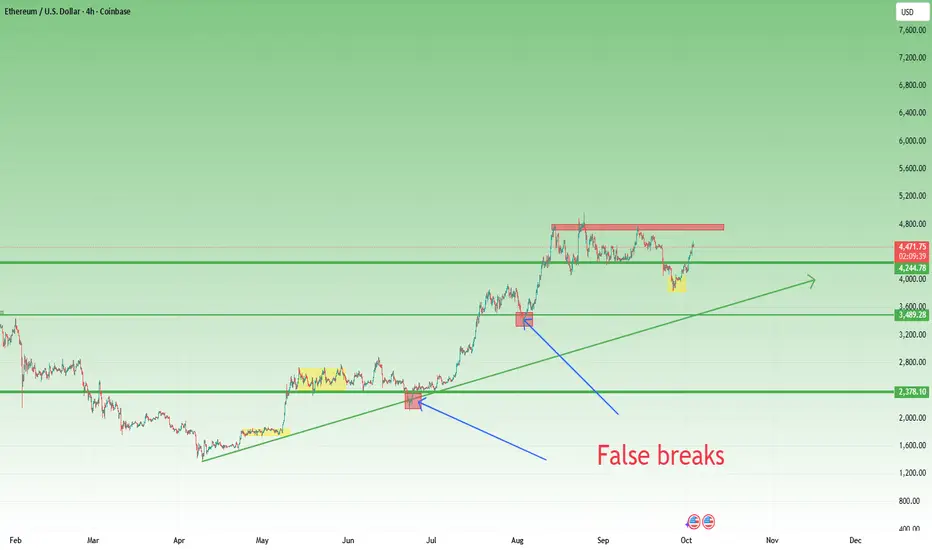
Ethereum: Bulls in Control, But Time for a BreatherIn my previous ETH analysis, I pointed out the high probability of a false breakdown under the 4100 technical support and the 4000 psychological level.
The reasoning was simple: during the strong bull leg from 1350 to 4900 (since April), ETH had already shown this type of price action twice.
That call proved correct. ETH reversed higher, hit my 4400 target, and even pushed further, printing highs close to 4600.
Now, after a nearly 15% rise since last Friday, the market may be due for a pause — a chance to consolidate or correct part of the gains.
________________________________________
Technical View
• Support: 4300 is the key level. As long as this holds, bulls remain in control.
• Resistance: Immediate pressure sits near 4600, the recent top.
• Structure: The trend remains strong and healthy, but after such a rapid move, short-term cooling is normal.
________________________________________
Trading Plan
The strategy remains simple: buy dips against 4300.
As long as that support is intact, ETH’s bull case stays firmly alive. 🚀
Gold: Start for a Meaningful Correction?Since Monday, I’ve been writing about the high probability of a correction after Gold’s impressive rise that started on 20 August.
My point was simple: even the strongest bullish trends are not one-way streets — retracements are part of the journey.
Yesterday proved that idea once again. After initially finding support near the 3860 zone, Gold staged a weak bounce, even printing a fresh but fragile ATH.
However, that move was quickly reversed as sellers stepped in aggressively, triggering four consecutive hours of selling, almost a mirror image of Tuesday’s drop.
From the local low at 3818, Gold managed a rebound and, at the time of writing, trades around 3846 — a natural recovery after such a sharp decline.
________________________________________
The Bigger Picture
The broader trend is undeniably bullish, and I don’t expect that to change anytime soon. But a more meaningful correction looks increasingly likely in the coming days.
Why do I call it meaningful? Because if we zoom out on the daily chart, we see that since late August, Gold has been in a near straight-line rise. Apart from a two-day pullback in mid-September and a minor setback on the 24th, every dip has been shallow, intraday, and quickly erased.
This type of price action cannot last forever. Markets need breathers, even in uptrends.
________________________________________
Key Technical Levels
• Resistance: The 3900 zone now acts as a strong ceiling, capping bullish attempts.
• Support: Bears could eye the 3790 zone first, with the potential for a deeper move toward 3700 if pressure intensifies.
________________________________________
Trading Plan
The strategy, in my view, remains unchanged: sell rallies until a proper correction develops.
The big trend is still bullish — but even bulls must allow the market to breathe. 🚀

Rare Sell Opportunity on Bitcoin , target 114KBitcoin is currently approaching the 124,000 – 124,500 zone, which represents its all-time high and the strongest resistance level the market has ever seen.
From a technical perspective, this zone provides a golden and rare opportunity to enter a short trade, based on the following:
Price reaching an unprecedented all-time high.
Clear overbought signals on momentum indicators (RSI – MACD).
High probability of a significant profit-taking move from these levels.
🎯 Trading Plan:
Short entry: 124,000 – 124,500
Main target: 114,000
Stop-loss: Above 125,000
⚠️ This is not financial advice, but rather a personal technical analysis based on current market conditions.

Bitcoin Harmonic Pattern , Target 105,000On the daily chart of Bitcoin, we can see the formation of a Gartley Pattern, one of the most well-known Harmonic Patterns. These patterns rely on Fibonacci Ratios and are typically used to anticipate a trend reversal after a strong move either upward or downward.
Recently, Bitcoin has reached a very important resistance zone between $120,000 – $121,000. The completion of the Gartley pattern in this zone increases the likelihood of a bearish correction.
Factors supporting a downside move:
Harmonic Pattern – Gartley: Completion at resistance provides a reversal signal.
PRZ (Potential Reversal Zone): Located near $120K.
Technical Indicators:
RSI shows overbought conditions, suggesting buying pressure is weakening.
MACD is close to a bearish crossover, another negative signal.
Volume: Buying volume is declining at recent highs, which often signals a distribution phase by large players and institutions.
📉 Support Levels:
The main target for the pattern is $105,500, a strong support level where price previously rebounded.
🎯 Trading Plan (Expected Scenario):
Potential Entry Zone: Between $120,500 – $121,000 (near resistance).
Targets (Take Profit):
TP1 = $114,000
TP2 = $110,200
TP3 = $105,500 (main target).
Stop Loss: Daily close above $121,800.
✅ Conclusion:
Bitcoin is currently at a very critical level, with the Gartley pattern completing right at resistance, combined with weakening technical indicators and declining volume. This supports the idea that the market may enter a short-to-medium term bearish correction with gradual downside targets ending near $105,500.
At the current zone, this is not considered a safe buying opportunity. Instead, it looks more like a selling opportunity or a case for waiting until price corrects to more favorable levels.
👍 Don’t forget to boost this trading idea if you found it helpful,
and follow me for more daily crypto insights and trade signals.
⚠️ Please note:
This is not financial advice – I’m only sharing my personal trades.
Always do your own research before taking action.
Best of luck 🌹

New ATH, Same Fragility – Why I’m Still Selling Gold RalliesYesterday’s Picture
Gold opened the month with strength, pushing into uncharted territory and printing yet another all-time high, just shy of the 3900 figure. However, momentum faded quickly, and the market corrected lower, currently holding around the 3860 support zone — roughly 300 pips under the peak.
2. Key Question
Has the correction already played out, or are we just at the beginning of a deeper move?
3. Why I See More Downside Ahead
• Fragile bids: Looking back just two sessions, Tuesday’s sharp intraday selloff highlighted how quickly buyers can step aside at these stretched levels.
• Short-term technicals: Price is still above immediate support and the rising trendline, keeping the structure bullish on paper — but this doesn’t erase the vulnerability.
• Risk/reward misbalance: Buying directly into support after a fresh ATH might look attractive, but the risk of a sharp drop outweighs the potential reward.
• Bigger picture context: Even if gold spikes once more to marginal highs, the corrective leg is unlikely to be over — in fact, it may only be starting.
4. Trading Plan
My strategy remains unchanged: sell rallies. I’ll be watching for short-term strength to fade, especially around intraday resistance zones. For me, chasing longs here is not worth the exposure.
5.Final Thoughts
The market remains technically bullish until support breaks, but under the surface, gold is fragile. From my perspective, the real move is still to the downside — and patience will pay off. 🚀

3830: The Line Between Bullish Control and a Waterfall Drop1. Recap of Yesterday’s Key Move
Yesterday was a decisive day for Gold traders, and it perfectly confirmed what I have been pointing out since Monday: at these elevated levels, Gold is extremely vulnerable.
After printing yet another All-Time High overnight, the yellow metal sold off aggressively for nearly 5 hours straight, with losses amounting to almost 800 pips.
Importantly, the bounce came exactly from the 23 September ATH level and by the end of the session, bulls managed to step in and regain control.
________________________________________
2. Overnight Price Action
Overnight, the asian session was once again bullish – Gold reached a fresh ATH at 3875, only to retreat slightly, which for now can be classified as nothing more than a shallow correction.
Despite the recovery, what matters is not the new high, but the fragility revealed during yesterday’s sell-off. Momentum looks stretched, and price action confirms the market’s increasing instability.
________________________________________
3. Technical Outlook
From a structural point of view:
• Price is still contained within the upper bullish channel.
• Bulls have also managed to reclaim the median line, suggesting they are still in control.
• However, the 800-pip collapse proved that even in such a strong uptrend, cracks are starting to show.
Key levels to watch:
• 3830 → if this level breaks, the market could trigger a waterfall of selling.
• 3785-3790 → support that held before, but I believe this time it won’t survive.
• 3700 → the logical corrective target if 3780 is breached.
________________________________________
4. Trading Mindset & Strategy
Yesterday, I couldn’t sell into the initial drop — and that’s fine. Such a move was more about timing luck than pure skill. No frustration, because the analysis was right: fragility is here.
From now on, my plan is clear:
• I’ll be looking for structured patterns with larger targets.
• Minimum: +1000 pips setups.
• Stretch target: +1500 pips.
________________________________________
5. Conclusion
Gold remains in bullish mode on the surface, but yesterday’s sell-off clearly revealed how fragile and overstretched the trend has become.
If 3830 fails, that could be the decisive moment when bulls finally lose control and the long-awaited correction accelerates.
Until then, I will stay patient and disciplined, waiting for the market to provide a clean pattern with a strong risk/reward setup. 🚀
GBPJPY – Calm Before the Storm: 200-Pip Range About to Break1. Market Context
For the past 6 weeks, GBPJPY has been trapped in a narrow 200-pip range between 200.50 and 198.50. This is unusual for such a volatile pair, and historically, when GBPJPY compresses like this, the eventual breakout tends to be explosive.
________________________________________
2. Distribution or Accumulation?
In my view, this is not healthy consolidation but rather distribution. The market looks heavy, and every test of support adds pressure on the downside.
________________________________________
3. Technical Perspective
• The pair is pressing against support.
• A clean break below here opens the door for an immediate 300-pip drop.
• For a larger swing move, the downside target extends much deeper – towards the 188.00 zone, which is the next major support level.
________________________________________
4. Trading Bias
As long as 200.00 holds as resistance, my bias remains bearish.
The longer the range persists, the bigger the breakout that will follow — and in this case, I believe it will be to the downside.
________________________________________
5. Conclusion
GBPJPY has been unusually quiet, but pressure is building. Once support breaks, the move could be fast and violent, in classic GBPJPY style.

Daily ETH Signal: Sell Now , target 4000ETH is currently showing signs of strength as it tests the key resistance level around 4150.
the price retest the level
My Personal Short Setup
Entry : Sell Now from current Price 4153
can wait for Price 4180
🎯 Target 1: 4059
🎯 Target 2: 3961
❌ Stop-loss: 4250
👍 Don’t forget to boost this trading idea if you found it helpful,
and follow me for more daily crypto insights and trade signals.
⚠️ Please note:
This is not financial advice – I’m only sharing my personal trades.
Always do your own research before taking action.
Best of luck 🌹

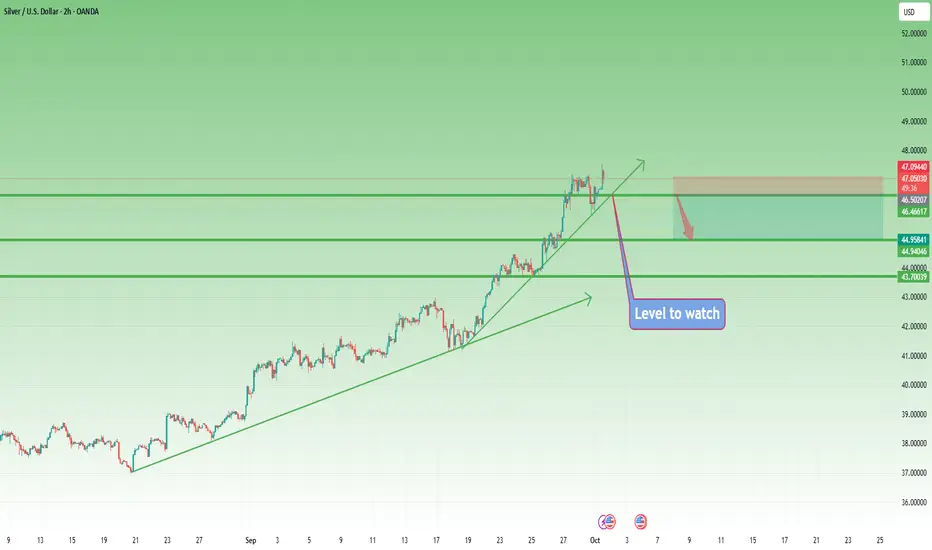
Silver Analysis – Multi-Year Highs but Correction LoomsSeptember has been a remarkable month for Silver, with prices running from the 40 zone all the way to 47.50, marking an impressive 20% gain and printing a new multi-year high.
Just like Gold, the long-term trend remains strongly bullish – no doubts there.
However, also like Gold, the recent rally looks overstretched, and history tells us that sharp corrections often follow such aggressive moves.
Yesterday, after touching above 47, Silver sold off hard and dipped to an intraday low of 45.78. Bulls quickly stepped back in, and overnight the market managed to print new highs around 47.57.
For now, the price remains elevated, but with correction looming, I believe the bearish side will eventually prevail in the short-term.
🔑 Technical Perspective:
• Key support to watch: 46.80.
• If this level fails to hold, we could see a stronger sell-off than yesterday’s, with the most appropriate near-term target sitting around 45.00.
🚀 As always, the market needs to confirm, but at these elevated levels, caution is warranted for late buyers.
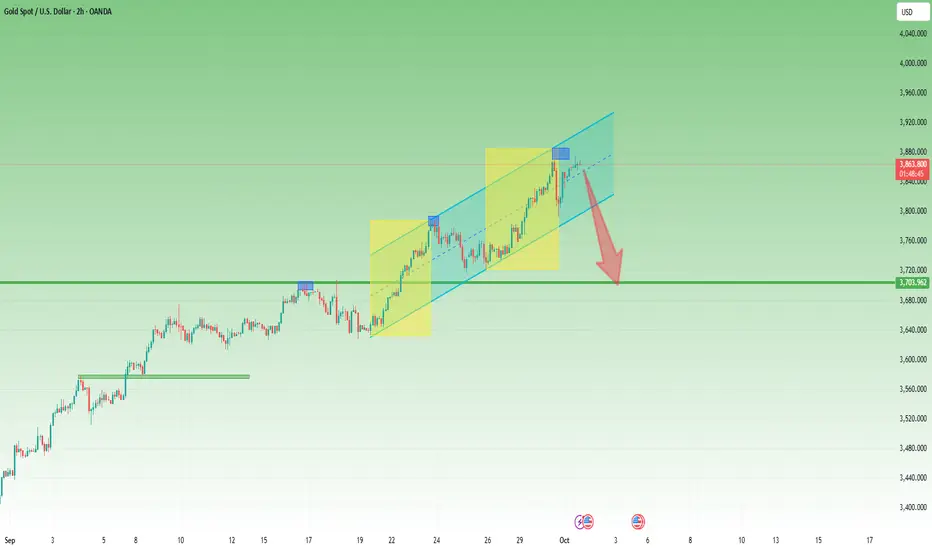
Gold – Straight Up, Straight Question1. Yesterday’s Move Recap
Like everyone else these days, I’m trying to make some sense of Gold’s move. Let’s be honest: even if you were extremely bullish, you wouldn’t have expected this kind of vertical line in the past 6 weeks or so.
The market is clearly overextended, and while momentum is impressive, technical traders know what usually follows such parabolic moves.
2. Key Question
Is Gold about to enter a much-needed correction, or can this euphoric rally defy gravity for longer?
3. Technical Observations
• Since the 2700 ATH zone in September, Gold has been carving out a repeating rhythm:
o Monday: explosive new ATH push
o Tuesday: spikes and volatility
o End of the week: corrective drop
• The last strong move (Friday the 19th → Wednesday the 23rd) measured around 1600 pips.
• If we project a similar extension from last Friday’s start, the measured move points toward 3885–3890 — right at the top of the newly formed channel.
This zone is not a certainty but an interesting confluence of measured move symmetry and technical channel resistance.
4. Why I Expect a Correction
• Gold has recently shown a tendency to correct after Wednesday.
• We are already in stretched territory with limited room for new buyers at these levels.
• Corrections are not only natural but necessary for healthy continuation.
5. Trading Plan
For me, the only trade that makes sense here is shorting spikes into resistance — anticipating a strong correction. I’m currently flat, but if we see exhaustion signs near 3885–3890, I’ll consider positioning short. The same strategy worked well last time,so...
6. Closing Thought
Patterns don’t always repeat perfectly, but they rhyme. If Gold follows its recent script, a midweek top followed by correction wouldn’t surprise me at all. 🚀

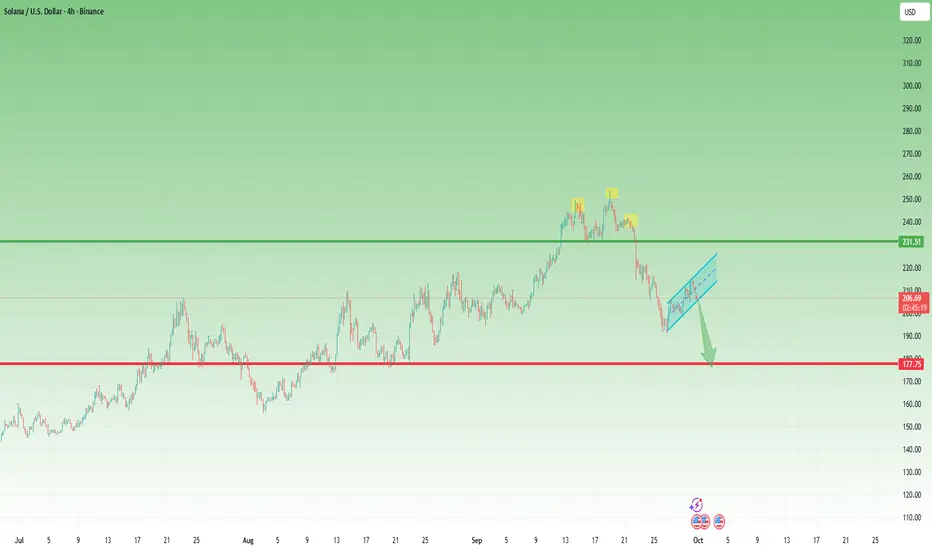
Solana: From 254 Highs Back to the 200 Line – What’s Next?At the end of August, I wrote that as long as 190 remained intact, Solana had room to rise toward 250, and I suggested a buy around the 200 level. That trade worked beautifully, with price reaching as high as 254.
From there, Solana started to roll over. At first, it looked like a normal correction, but the picture changed after a weak bounce attempt. Price broke decisively below 230, and the recent low was set right back at 190.
Currently, Solana is recovering once again. However, the structure of this bounce looks corrective in nature, forming what appears to be a bearish flag.
🔑 Key levels to watch:
• A break below the flag’s support – and more importantly below 200 – would likely trigger another leg down.
• In that case, the market could head toward a 175–180 major support zone, which is the next critical area for buyers to defend.
Until then, the bias remains cautious: Solana must prove it can break free from the corrective structure before bulls can regain control. 🚀
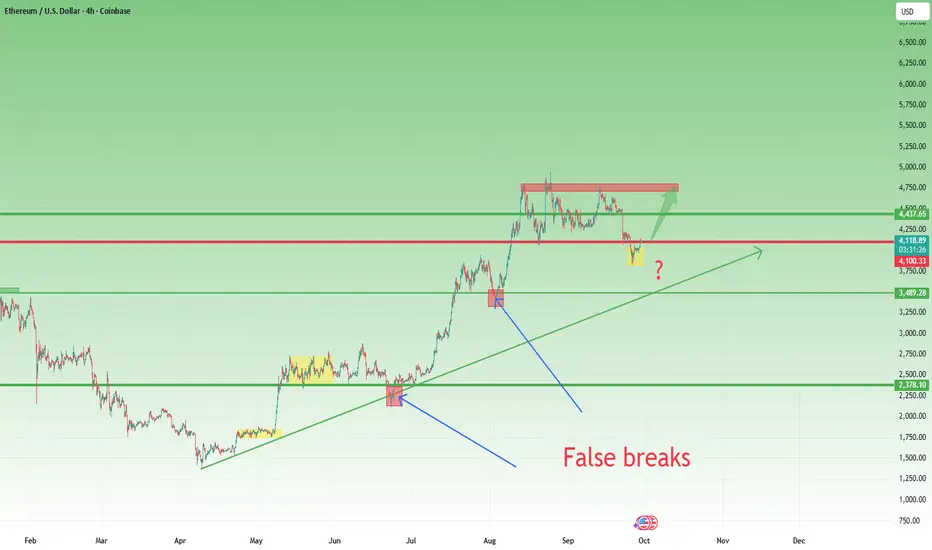
ETH Repeats the Pattern – $4800 Next Target?In my previous ETH analysis, I pointed out that while the price broke below the $4100 technical support and the $4000 psychological level, this move could represent a false break. But for this scenario to be valid, the market needed confirmation.
Since then, ETH has stabilized above $4000 and is now hovering around the $4100 level again.
📌 Looking back at the April rally (from $1400 upwards), we can already identify two similar cases of temporary breakdowns followed by strong recoveries.
• Each time, the market shook out weak hands before resuming the bullish leg.
• This repetition builds the case for another potential rebound, even if no outcome is ever guaranteed.
⚡ Trading Outlook:
• Bullish scenario: I expect ETH to rebound towards the $4400 zone, with the possibility of a retest of the $4800 resistance.
• Invalidation: A daily close back under $4000 would cancel this bullish setup and reopen the downside risk.
• Confirmation: A strong daily close near the highs of the day will add conviction to the bullish continuation.
👉 For now, the structure remains intact, and the bias stays bullish. The key levels to watch are $4000–4100 supports and $4400–4800 for resistance. 🚀
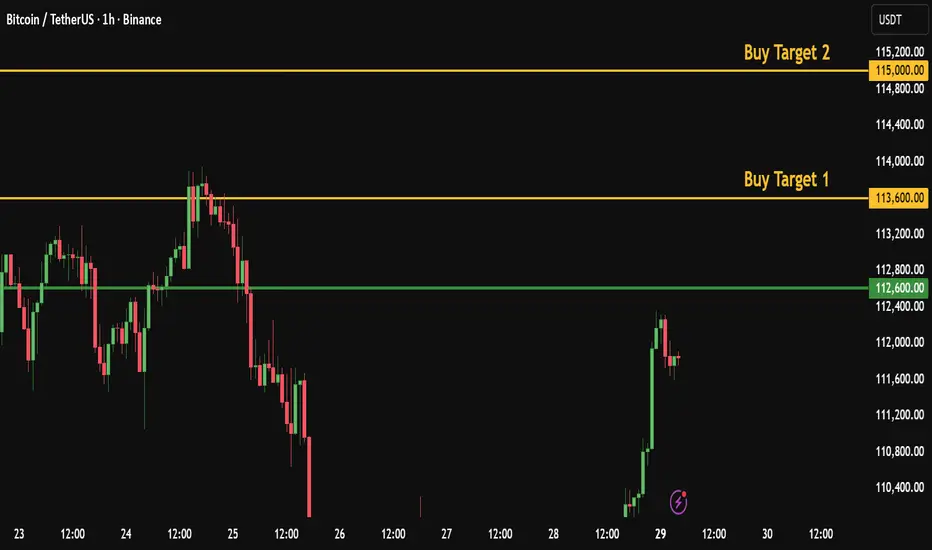
Daily Bitcoin Signal: Watching the 112,600 Breakout, target 115K
Bitcoin Daily Numeric Analysis
Bitcoin is currently showing signs of strength as it tests the key resistance level around 112,600. A confirmed breakout above this zone could trigger fresh bullish momentum, opening the door for higher targets in the short term.
My Personal Long Setup
If price breaks and closes a 1H candle below 109,150, I will enter a short trade.
🎯 Target 1: 108,250
🎯 Target 2: 107,500
❌ Stop-loss: 110,600
👍 Don’t forget to boost this trading idea if you found it helpful,
and follow me for more daily crypto insights and trade setups.
Please note:
This is not financial advice – I’m only sharing my personal trades.
Always do your own research before taking action.
Best of luck 🌹
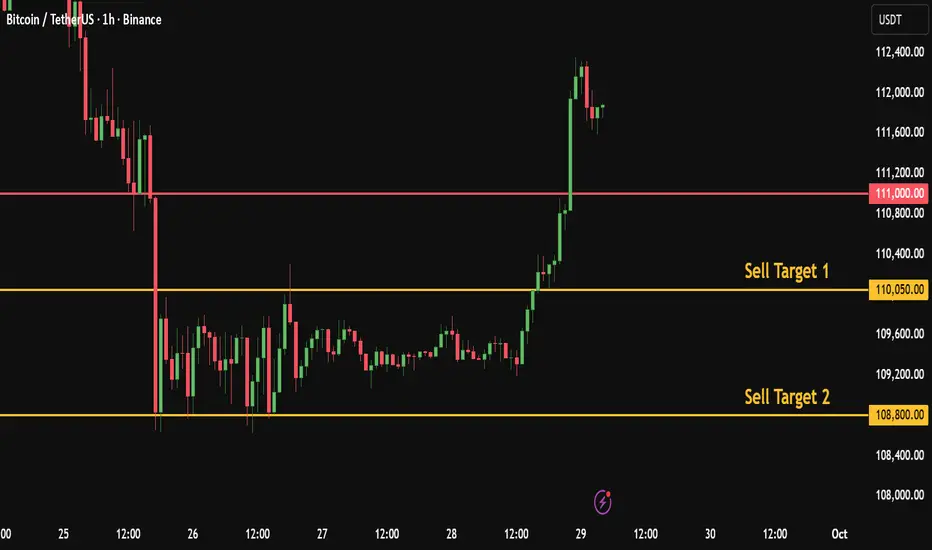
Daily Bitcoin Signal: Watching the 111K Breakout, target 108KBitcoin Daily Numeric Analysis
Based on my numeric analysis, Bitcoin is showing potential weakness near key support.
My Personal Short Setup
If price breaks and closes a 1H candle below 111K, I will enter a short trade.
🎯 Target 1: 110,050
🎯 Target 2: 108,800
❌ Stop-loss: 112,700
👍 Don’t forget to boost this trading idea if you found it helpful,
and follow me for more daily crypto insights and trade setups.
Please note:
This is not financial advice – I’m only sharing my personal trades.
Always do your own research before taking action.
Best of luck 🌹
Daily Bitcoin Signal: Watching the 110,500 Breakout, target 113KBitcoin Technical Signal
Bitcoin is currently showing signs of strength as it tests the key resistance level around 110,500. A confirmed breakout above this zone could trigger fresh bullish momentum, opening the door for higher targets in the short term.
Here’s my personal trade plan:
If the price breaks and closes a 1H candle above 110,500, I will enter a long position.
🎯 Target 1: 111,650
🎯 Target 2: 113,200
🛑 Stop-loss: 109,500
Please note:
This is not financial advice – I’m only sharing my personal trades.
Always do your own research before taking action.
👍 Don’t forget to boost my trading idea if you found this useful, and feel free to follow me for more analysis of this kind.
Best of luck 🌹

TRX/USDT – Long-Term Buying Opportunity?1. Quick Market Recap
Since the double top near 0.37 in mid-August, TRX has been under pressure. A strong spike down early September briefly shook the market, but buyers stepped in quickly, recovering the price back into the 0.35 zone.
However, momentum faded, and the coin started to roll back again.
2. Key Question
Is this pullback simply a healthy correction in a broader bullish trend, or the start of a deeper breakdown?
3. Why I Lean Toward a Buying Opportunity
• The overall trend remains bullish despite the correction.
• The quick recovery from the September spike showed strong buyer interest.
• Supports at 0.30 and 0.2750 align with attractive long-term accumulation zones.
4. Trading Plan
• If price breaks below 0.33, I will watch for a retest of the 0.30 support — a strong level that held earlier this month. For me, this is a medium to long-term entry opportunity.
• If the correction extends deeper toward 0.2750, I plan to DCA (dollar-cost average) into the position.
• My medium/long-term target remains 0.50, aligning with the bullish structure of TRX.
5. Final Note
Corrections in bullish markets are often where the best opportunities appear. TRX fits this pattern well, and in my opinion, it’s shaping up as a solid candidate for accumulation with a 0.50 target 🚀
