BTC – Base Before Break?After the ATH at 125k on 25 Aug, BTC pulled back to 107k and has been consolidating. The latest structure looks more like a base for reversal than a continuation pattern: price is back into the 113.3k zone, which coincides with resistance, and we’ve printed a sequence of higher lows—a classic pressure build under supply.
What I’m watching
• Bullish trigger: A clean break/close above 113.3k opens the path toward 120k (both a technical target and a psychological level).
• Continuation potential: If 120k is reclaimed with momentum, a 123–125k retest comes into play.
• Support: 110k is the line in the sand; below it, risk shifts to 100k zone (the correction low).
Trading plan
• Breakout: Look for acceptance above 113.5k and a successful retest to validate upside toward 120k.
• Buy-the-dip zone: If we pull back, watch 111–112k for signs of bid absorption and continuation.
Bias: I’m bullish while 110k holds. A failure below 110k would likely send us back to 107k and even 100k.
Signalprovider

Gold Analysis – Correction Not Yet Over (IMO)Yesterday, after printing a new ATH at 3674, Gold sold off aggressively and overnight reached a low of 3620.
Now the key question: Is Gold done correcting?
👉 My answer: Not yet.
Here’s why:
1. The 550 pip drop from the top is barely scratching the surface compared to the 3500 pip rally in the last two weeks.
2. Yesterday’s daily candle is a bearish pin bar. While this pattern is weaker in strong uptrends, it can still trigger continuation.
3. Structurally, the market looks like it’s forming an ABC correction. The current rebound may be wave B, with wave C expected to target the 3570 zone.
4. Confluence supports act like magnets once corrections begin. The zone I’m watching aligns with the 23% Fibonacci retracement, which fits perfectly with the correction scenario.
📌 Trading Plan:
As long as 3675 holds, I remain bearish in the short term. The best strategy is to sell rallies against the ATH, targeting deeper retracement levels.
EURUSD – Weakness Ahead?For over a month, EURUSD has been stuck in a choppy range:
• Support: 1.1580 zone
• Resistance: just above 1.1700
As always, such tight consolidations usually precede strong moves. The question is: which way?
🔑 Factors pointing lower:
1. On the DXY, I expect a potential upside reversal – most bad news is already priced in.
2. Yesterday’s reaction to the NFP revision → USD strength, not weakness, which confirms the shift in sentiment.
3. A false break above resistance on EURUSD adds to the bearish case.
📌 Conclusion:
I expect further EURUSD weakness, with confirmation if the price breaks below 1.1650.

BNB/USDT: Bullish Momentum Sustains Within Upward ChannelThe BNB/USDT market continues to trade within a strong ascending channel, having rebounded from the 865 support zone, which reaffirmed bullish momentum. The price action displays a clear pattern of higher lows and a steady rise along the upward trendline, signaling firm buyer control.
Currently, the price is aiming for the 932 level, with a possible extension toward the 970 resistance zone if momentum remains intact. While a mid-channel rejection could lead to short-term consolidation, the overall structure supports the likelihood of a continuation rather than a reversal.
As long as the channel holds, the bulls are well-positioned to challenge the overhead resistance zones, keeping the uptrend scenario firmly in play.

FET: Still on My Radar, Still Looking BullishA few weeks ago, I pointed out that FET is one of the alts firmly on my radar and that I was looking to add more to my bag. The market has delivered exactly what I wanted to see:
• The coin reinforced support just above 0.55, proving that buyers are very active at this level.
• From there, FET has started to rise again, showing constructive price action
This is in line with my broader outlook from the Total Excluding Top 10 analysis , where I argued that acceleration to the upside could be the next big move for alts.
Trading Plan
For FET specifically, the picture is clear:
• As long as 0.55 holds, dips should be treated as buying opportunities.
• The next logical target in such a breakout scenario is 1 USD, which is both a round psychological level and a strong resistance from the past.
🚀 Strategy: Buy dips against 0.55. Targeting 1 USD in the coming wave.

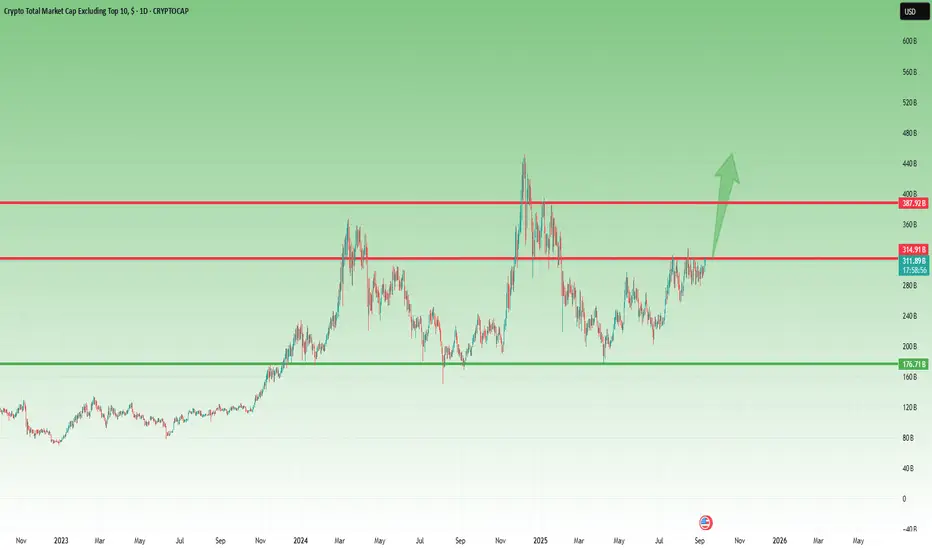
Smaller alts, a constructive outlookThe Big Question: Will We Finally See Moves on Alts?
The past month – or rather the past 6 weeks – has been nothing short of frustrating for altcoin traders. Most individual charts looked stagnant, choppy, or simply lacked momentum. But zooming out to the Total chart, the picture is much clearer, and the answer looks like a confident YES .
What the Chart Tells Us
• After the December 2024 top, we witnessed a deep correction, which finally bottomed on 7 April, during the infamous tariff mania .
• From there, an initial leg up developed, reaching resistance around the 300B mark.
• The correction that followed was healthy: it established a higher low, confirming that the bottom was not just a dead cat bounce.
• The next attempt pushed even deeper into resistance, creating a higher high – a strong bullish sign.
• Since the end of July, things have turned even more interesting: the market has been pressing hard into resistance, and we could even argue the formation of a continuation Head & Shoulders setup.
Where We Are Now
At the time of posting, the Total chart is testing resistance at ~310B once again. The more this level gets tested, the weaker it becomes. A breakout from here doesn’t just look possible – it looks almost unavoidable .
What to Expect Next
When that resistance finally breaks, the tension built up over months of sideways action – and the frustration of traders who have been waiting for more than half a year – will likely unleash a strong acceleration.
In my view, we could easily see a 50% rally, taking the Total chart back to the December 2024 highs.
🚀 The stage is set. All that’s missing is the trigger.
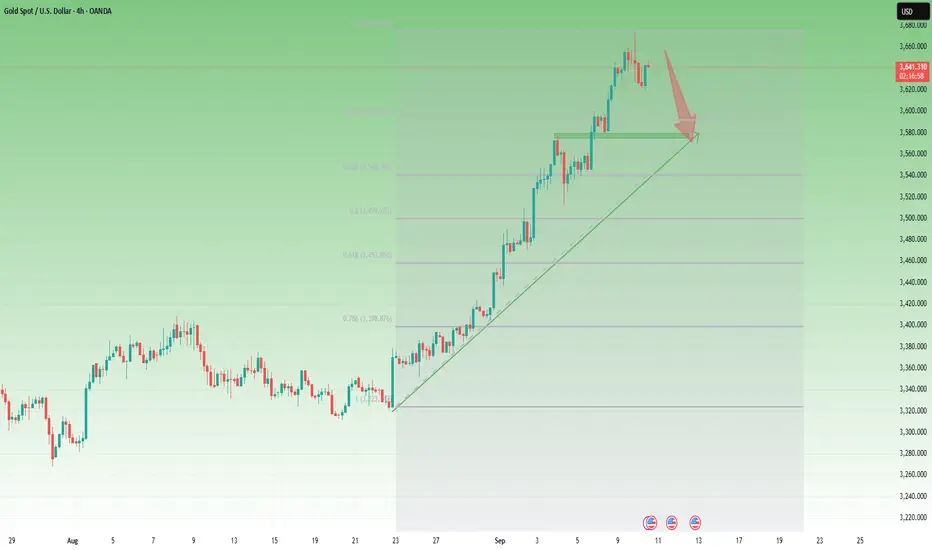
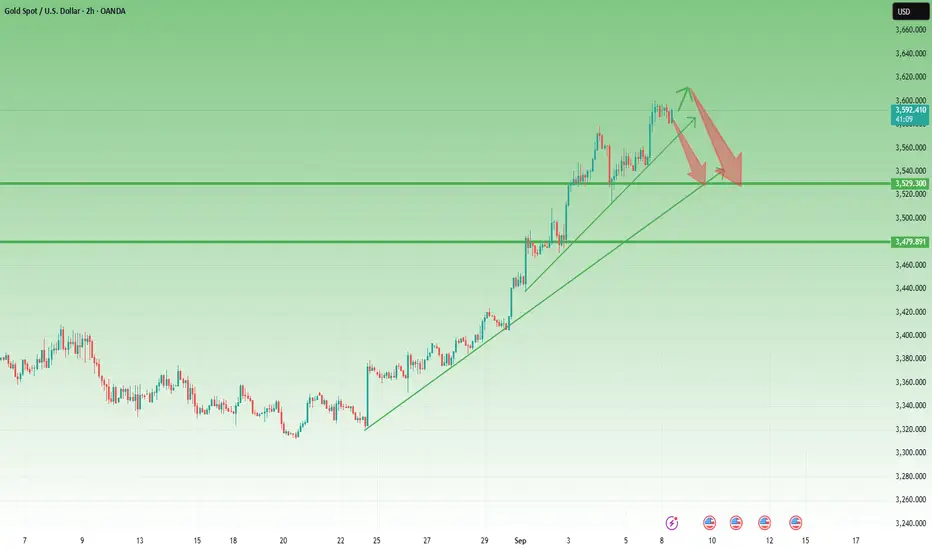
Fearless Bulls, Straight-Line Rise – But Mean Reversion CallsLast week Gold bulls were fearless – we witnessed three all-time highs within a single trading week. The market closed on Friday just below 3600, locking in an impressive 1,500 pips weekly gain. There is no doubt: the trend remains firmly bullish.
But let’s add some perspective. Even if XAUUSD were to drop 1,000 pips from current levels, that move would count as a minor correction within the dominant bullish trend. That’s how extended this rally has become.
📌 Another element supporting the correction scenario is the parabolic nature of the latest move. From the 3300 zone, the rally has been almost a straight vertical line, leaving gold strongly overextended and far away from the mean. Markets rarely sustain such deviation without at least a temporary pullback.
🔑 Trading Plan: While acknowledging the risks of counter-trend setups, I will look for short opportunities. In my view, there is more room to the downside than upside in the short term.
Target for correction: 3530 confluence support zone.
As always, the trend is still bullish, but corrections are part of the game. A disciplined trader must know when to step aside – and when to take the contrarian shot. 🚀
ETH to $5,000 - Whales Are Withdrawing & Storing in Cold WalletsEthereum , After ETH failed to break the strong support around $4,000 – $4,100,
a double bottom pattern has formed, signaling the beginning of a potential major rally toward $5,000.
What strengthens this bullish outlook is the recent on-chain and exchange data:
Ethereum balances on major exchanges like Binance and Coinbase have dropped significantly.
Between August 23 and September 5:
Around 700,000 ETH left Binance
Around 900,000 ETH left Coinbase
In total, exchange reserves dropped by more than 2.6 million ETH over the last two months.
This massive decline in ETH reserves usually means that investors are moving coins into private wallets for long-term holding — an accumulation signal, not selling.
When exchange supply shrinks while demand remains steady (or increases), it often triggers a Supply Shock, pushing prices higher.
What does this mean?
➡️ Big players and whales are withdrawing ETH into cold storage.
➡️ This reduces the immediate sell-side liquidity and opens the door for a potential Supply Shock.
With lower supply and strong demand (especially with Ethereum upgrades and growing institutional interest), the natural outcome is: higher prices.
🎯 Logical next target = $5,000
Reminder:
The market is always driven by supply, demand, and whale behavior. That’s why liquidity flow is often more important than any indicator.
Question for you:
Do you see this exchange outflow as a clear sign of an upcoming rally?
Or do we still need confirmation on the chart first
✅ Write a comment with your favorite altcoin hit the like button, and I'll provide my analysis in the reply. Trading is simpler with the right coaching.
My analyses are personal opinions, not trade setups.
Thank you for your support, and I wish you successful trades 🌹

XAUUSD Analysis – Buyers Keep Stepping InIn yesterday’s analysis, I mentioned that Gold looked overstretched, with high chances of a continuation of the correction after the recent 3579 ATH.
During the day, price rejected my selling zone twice, and once more overnight. However, buyers kept stepping in, forming higher lows and pushing price back toward the 3560 resistance zone. This behavior signals upward pressure.
If this resistance finally breaks, the probability of seeing yet another ATH towards 3600 increases significantly.
For now, I’m out of the market, with but looking to buy if buying pressure persists

Rebound or Trap? Why I’m Selling RalliesYesterday’s Move
After printing a fresh ATH, profit-taking started late in the New York session. This was followed by stronger selling pressure during the Asian hours, which dragged the price overnight down to 3510. Currently, we see a rebound, with price trading around 3530.
Key Question
Is this rebound the start of a recovery—or just a pause before another leg down?
Why I Expect the Correction to Continue
- The market sold off 650 pips from the new ATH, confirming a local top.
- Momentum becomes fragile after 2k pips rise in just 10 days
- Selling pressure could easily return, especially if buyers struggle to hold above 3550.
Trading Plan
I’ll be looking to sell rallies against the recent top, targeting first the 3500 psychological level, and then the 3470 technical confluence support.

Gold Analysis – ATH Again, But Correction Ahead?1. Yesterday’s Move
Yesterday, after a small intraday correction to the 3470 zone, Gold quickly reversed and pushed higher, printing a new all-time high near 3550. The bullish trend remains intact, but the latest surge looks overextended.
2. Key Question
Has Gold finished its run for now, or will we see another immediate push higher without a deeper correction?
3. Why a Correction is Probable
• The recent move is stretched, with limited room for risk-reward on the long side at these highs.
• 3470 stands out as a confluence support, and markets often retest such levels before continuation.
• Chasing longs at ATHs leaves traders vulnerable to sharp pullbacks.
4. Trading Plan
The best setup is to wait for price to retrace into 3470 and look for buying opportunities in that zone, aiming to rejoin the broader uptrend.
Selling here is very risky – high probability of upside spikes could easily hit stop losses before any meaningful retracement.

Gold Hits New ATH – Is a Pullback Coming?Hello traders,
Gold has just hit a new all-time high at 3508, surpassing the previous ATH of 3500. I’m anticipating a pullback toward 3450.
On lower timeframes, we can see clear rejection from the highs, leading to a break in market structure, which suggests sellers may be defending these levels. I’ve identified a supply zone between 3490–3500. My expectation is that Gold could retrace to a nearby demand zone around 3440–3450.
What’s your take on Gold? Drop your thoughts in the comments below!

The Bigger Picture in Gold: A Complete Cross-Market ViewFor directional swing traders, Gold’s summer price action has been particularly challenging. Strong impulsive moves have frequently been followed by tight consolidations and equally strong reversals, making it difficult to capture clean continuation trades.
In such environments, the most effective strategy is often to step back and reassess the broader context.
In this article, I will attempt to do just that — to strip away the noise of short-term fluctuations and focus instead on the bigger picture shaping Gold’s market direction.
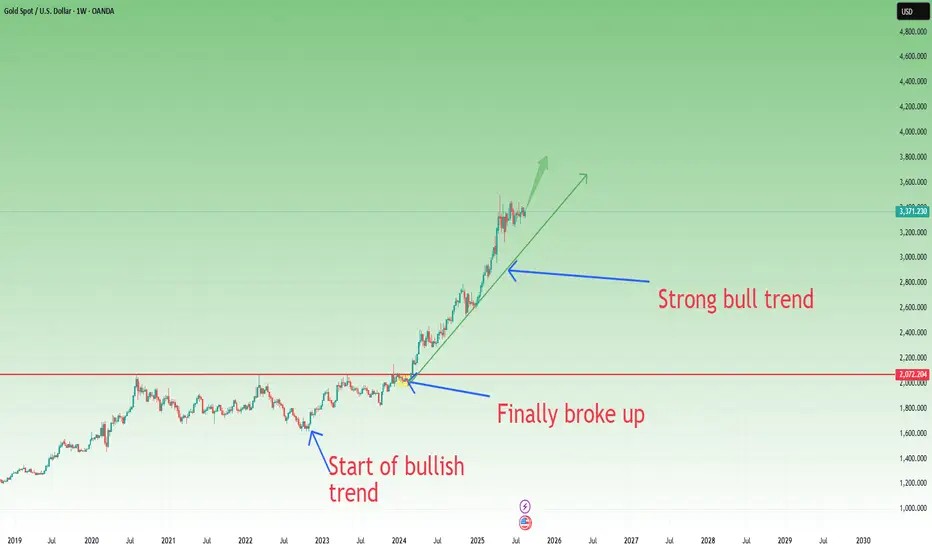
XAUUSD on the Weekly Chart
Looking at the weekly timeframe, the beginning of the current uptrend can be traced back to October 2022.
However, it wasn’t until March 2024 that XAUUSD finally broke decisively above the 2000 level. Only after this breakout did the trend accelerate meaningfully to the upside.
From that point, the long-term trend has been clear and technically consistent, with pullbacks and corrections that are typical in such strong advances.
Following the all-time high in late April, XAUUSD entered another corrective phase, and since then the market has been consolidating.
Two key observations stand out:
1. A congestion zone is forming, with both highs and lows tightening over the past four months.
2. An ascending triangle structure is becoming increasingly visible.
On the daily chart, this congestion is even more evident—especially in the past four weeks. Moreover, last week produced an interesting pattern: two strong bullish engulfing candles, the latest triggered by Powell’s remarks on Friday.
Conclusion
In the bigger picture, XAUUSD continues to look bullish as long as price holds above the 3300 level. The consolidation is healthy within the broader uptrend, and the ascending triangle suggests a potential continuation higher once the market resolves this range.
Gold Futures
The picture on Futures is broadly similar, with the uptrend starting in October 2022 and gaining momentum after March 2024. The key distinction here is that the consolidation is forming an ascending triangle, and last Friday’s bullish engulfing candle coincided with a reversal directly off the trendline support.
Note: From my perspective—and I’ve said this before—when I trade Gold, I care about Gold itself as an asset. That’s why I ignore the DXY in my analysis. Instead, I focus on how Gold performs across multiple currencies, which I find far more relevant to understanding its true strength.
XAUEUR
Here as well, the trend is clearly to the upside—confirming what I mentioned earlier: Gold has strengthened regardless of the currency it is priced in.
Over the past month, a well-defined support has formed around 2840. Last week, price action confirmed that level with a strong bullish engulfing candle, followed by two consecutive bullish pin bars.
XAUGBP
The picture is very similar to XAUEUR: the uptrend remains intact, with a clear support base forming. Last week’s price action delivered a bullish engulfing candle followed by a double bullish pin bar, reinforcing the case for continued strength.
XAUJPY
When it comes to the yen, the chart tells a different story. The series of all-time highs began back in 2022, driven not only by Gold’s global strength but mostly by the yen’s pronounced weakness.
Over the past year, price action has remained contained within an ascending channel. While the structure differs from other Gold crosses, it nevertheless continues to suggest underlying strength.
In conclusion, the overall, the bigger picture remains bullish for Gold as long as key supports hold, with the potential for continuation once current consolidations resolve.
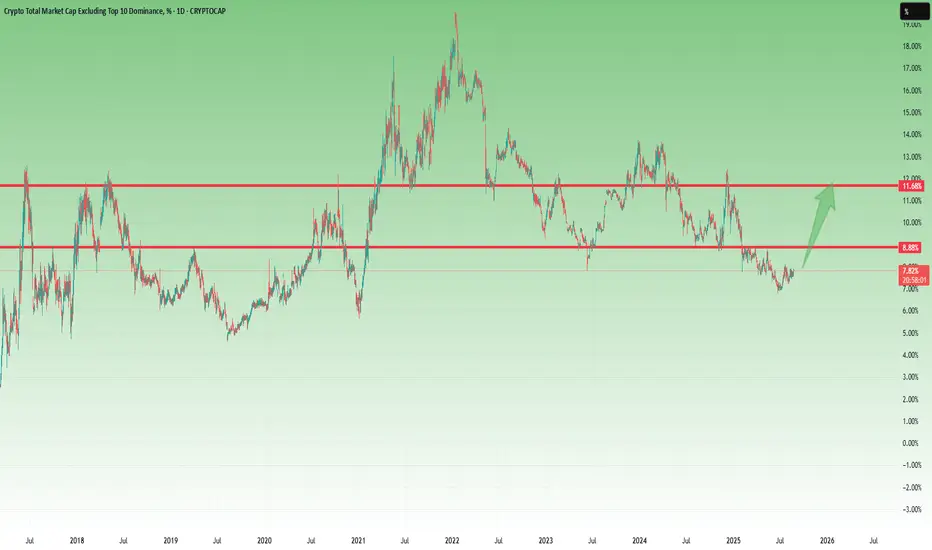
Crypto Market Cap (Others) – Ready for Breakout?When it comes to trading or investing, for sure we all want the best return possible. With both BTC and ETH at or very near ATHs, most of us are naturally looking at lower cap alts for opportunities.
For this reason, let’s analyze the chart for Crypto Market Cap excluding Top 10 and stablecoins.
Note: Although since the 2021 bottom there have literally been hundreds of thousands of new coins launched, I still consider this chart highly relevant.
The recent price action is clear:
• Since the July bottom, “Others” has shown a timid but constructive recovery.
• A higher low was confirmed at the beginning of August.
• A tight consolidation is now pressing against resistance.
On the 2H chart, this consolidation looks very promising, with pressure building for a breakout. Technically, a move above 7.88% dominance could trigger acceleration toward 8.88%, and if the optimism holds, even a medium-term extension toward 12% is possible.
📈 Trading Plan:
Look for coins in the Top 100 (excluding Top 10) that already show bullish chart structures. Combining this with the strong setup in the “Others” chart could be a solid approach to maximize returns in this phase of the market.
Solana at the Gates of Breakout- 250-300 in sight1. What happened lately
After the sharp drop that started on July 23 and bottomed at 155 in early August, Solana has shown strong recovery.
The rebound pushed price back to the 207 resistance zone, followed by a pullback to 175, confirming it as a solid demand area. Yesterday, in line with the entire crypto market, SOLUSDT rallied strongly, and today, after a quick dip below 200, buyers stepped back in, pushing price once again toward resistance.
2. The key question
Is Solana ready to finally break above resistance and continue higher into a new bullish leg?
3. Why I expect continuation to the upside
• Positive fundamental backdrop across the crypto sector.
• Constructive technical structure with consecutive higher lows since April.
• 175 confirmed as a strong support zone, with buyers stepping in twice this month.
• 207 resistance under pressure again, showing growing bullish momentum.
4. Trading plan
As long as the daily close holds above 190, Solana remains firmly bullish.
A clear breakout above 207 could open the path toward 250, and in a more extended scenario, even 300 in the medium term.

Buy opportunity on Gold with overall target at 3358Hello traders,
I’m looking at a potential long setup on Gold around the 3329 zone. Here’s why:
During mid-London session, price dipped into the 61.8% Fibonacci retracement level (3327).
This level also aligns with the midpoint of a daily imbalance (FVG), making it an area of high confluence.
On the 4H chart, Gold has already shown rejection from this zone, suggesting buyers are stepping in to defend it.
Based on this, I expect today’s low could be set around this area.
Trading plan:
Entry: 3329–3333
Targets: 3342 and 3358
Stop loss: 3321
If you find this helpful please give this idea a boost. Thank you!

Gold Analysis – Slight Bearish Bias After Failing at 3350Yesterday I wrote that after the false break and the bullish daily engulfing, Gold could reverse to the upside and the correction that started from the 3400 zone might have been finished.
With this idea in mind, I went long, and the entry turned out to be a real sniper one as Gold started to rise strongly exactly after my entry, reaching once more the 3350 zone.
Here, however, price action turned “boiling” and, in the end, bulls couldn’t push through decisively.
After another attempt to conquer 3350 at the beginning of the Asian session, Gold failed again. During the night (my night), I decided to close my trade with +120 pips profit. It was not the outcome I expected, but still a positive one.
Looking back, this decision seems correct so far since price is now back around my entry level from yesterday.
________________________________________
Where Do We Go From Here?
So far, the week has no resolution. Neither bulls nor bears are in full control.
However, after the repeated failure to break 3350, my outlook leans slightly bearish at this moment.
• Plan: I will look to sell rallies during the day if I can find a good risk:reward setup.
• Target: 3280 is the bearish objective.
• Invalidation: If bulls finally manage to resolve the 3350 level, this outlook is negated.
________________________________________
Final Note:
Gold has become very unpredictable these days. What is true at the time of posting could change quickly during the session. That’s why I update my analyses during the day.
👉 If you want to be notified of these updates, don’t forget to like this idea.
💬 And if you have questions, feel free to use the comment section — I will try to respond to all.
🚀
Disclosure: I am part of TradeNation's Influencer program and receive a monthly fee for using their TradingView charts in my analyses and educational articles.

XAUUSD – Bullish Outlook Confirmed1. Yesterday’s Context
In my yesterday’s analysis, I mentioned that although Gold had broken below the 3330 support, it was most probably a false break.
Yesterday’s price action confirmed this view: Gold pushed back above the broken level, accelerated higher, and even broke above the falling wedge trendline, reaching a high around 3352. On top of that, the daily chart closed with a strong bullish engulfing pattern.
________________________________________
2. The Key Question
Is this the start of a larger bullish continuation?
________________________________________
3. Why the Setup Looks Bullish
• False break below 3330 quickly reversed.
• Break above the falling wedge trendline = strong bullish signal.
• Daily bullish engulfing confirms momentum shift.
• Technical structure now favors continuation to the upside.
________________________________________
4. Trading Plan
At the time of writing, Gold is in a normal correction after yesterday’s strong rally.
• I remain bullish.
• I am looking to buy dips into support zones.
• Target: around 3380 as the next upside level of interest.
________________________________________
5. Final Note 🚀
The outlook remains unchanged: the bias is bullish, and yesterday’s breakout gives conviction that buying dips is the right strategy.
Disclosure: I am part of TradeNation's Influencer program and receive a monthly fee for using their TradingView charts in my analyses and educational articles.

GBPJPY – Bears Just Getting Started?1. Market’s Context
In my previous two analyses, I highlighted the high probability of a drop in GBPJPY and noted that as long as resistance holds, the preferred scenario is to look for selling opportunities.
Yesterday, the market finally broke below the 199.00 support, reaching a local low around 198.90.
________________________________________
2. The Key Question
Was this just the first step of a deeper bearish move?
________________________________________
3. Why the Bearish Case is Strong
• Resistance remains intact, limiting upside potential.
• Break of 199.00 support confirms bearish momentum.
• Current price action looks more like a corrective rebound than a reversal.
• Structure suggests the decline could just be starting.
________________________________________
4. Trading Plan
• I remain bearish.
• Selling rallies is back in play.
• Target: the 195.00 zone remains my focus.
________________________________________
5. Final Note 🚀
GBPJPY has confirmed the break—now it’s all about execution. Sell the rebounds, aim for 195.
Disclosure: I am part of TradeNation's Influencer program and receive a monthly fee for using their TradingView charts in my analyses and educational articles.

BTC Trendline Broken: 110k Support Is the Last Stand1. Recent Context
In my previous BTC analysis, I wrote that as long as the ascending trendline held, bulls had nothing to fear. But on Monday, that line was broken to the downside. After a few hesitations, I decided to close my long positions around 116k.
________________________________________
2. The Key Question
Can bulls defend 110–111k, or are we heading for a deeper correction?
________________________________________
3. Why the Chart Looks Weak Short-Term
• The trendline break changes the bullish structure.
• Bulls must defend 110–111k; if this zone cracks, the damage could be significant.
• To regain momentum, BTC must break back above 120k. Without that, upside looks limited.
________________________________________
4. Trading Plan
At this point, I’m out of the market.
• I won’t buy into 111k support even if a rebound is probable.
• Instead, I’ll treat that rebound as a chance to sell short at better prices.
• 120k zone is the ideal level for a short setup, both technically and from a risk/reward perspective.

XAUUSD – Waiting for the Market to Show Its Hand1. Yesterday’s Setup
In my yesterday’s analysis, I mentioned that while I am bullish overall, I could not ignore the pressure Gold was putting on the 3330 support. I also noted that for bulls to regain control, a break above 3345 was needed.
The market reacted with textbook precision: price rallied exactly to 3345 before breaking down through 3330, reaching a low of 3311. Currently, we see a normal rebound, but inside a bearish short-term structure.
________________________________________
2. The Key Question
Is this just a continuation of the downtrend, or a trap before the real bullish move?
________________________________________
3. Why I’m Not Convinced by the Bears
• The recent drop doesn’t look impulsive—it’s overlapped and choppy, more like a stepway accumulation phase.
• The pattern is contained inside a falling wedge, a structure that usually favors upside breaks.
• Bears had their chance yesterday, but the follow-through looks weak.
________________________________________
4. Trading Plan
At this moment, I’m out of the market, waiting for confirmation.
• Buy zone: around 3300–3305 for a potential re-entry long.
• Bullish confirmation: if price climbs back above yesterday’s high (3345), it would negate the breakdown and confirm a false break.
• With price now at 3322, I prefer to stay patient, watching how it reacts at the key levels.
________________________________________
5. Final Note 🚀
Gold is now right in the middle of my interest range. For me, it’s not about predicting—it’s about waiting for the market to reveal the next high-probability setup.
Disclosure: I am part of TradeNation's Influencer program and receive a monthly fee for using their TradingView charts in my analyses and educational articles.

NASDAQ – Is the Top Finally In?In my past two NAS analyses, I argued that the index was overstretched and vulnerable to a deep correction. Even the fact that from the April bottom to mid-August it surged nearly 50% should have raised big red flags — that kind of move rarely sustains without a meaningful pullback.
At this moment, the technical picture has shifted significantly. The index has broken two critical levels:
1. The ascending trendline drawn from the recent low.
2. The horizontal support defined by the previous all-time high.
Losing both of these supports in quick succession suggests the bullish momentum is fading and a top may already be in place.
If this scenario unfolds as expected, selling pressure could intensify in the coming sessions. My first downside target stands in the 22,700 zone, with further weakness possible if the correction develops into a broader risk-off cycle.
Disclosure: I am part of TradeNation's Influencer program and receive a monthly fee for using their TradingView charts in my analyses and educational articles.

False Breaks, Fading Bounces – What’s Next for Gold?1. Introduction – what happened yesterday
Yesterday Gold made a false break below 3330 support, only to reverse sharply back to 3360 resistance before dropping again. After that move, the market slipped into an irregular range with no real direction.
During the night session, another dip under 3330 was rejected, but this time 3340 capped the upside.
________________________________________
2. The key question
Has the correction ended, or is Gold preparing for a continuation to the downside?
________________________________________
3. Why Gold looks vulnerable
• 3330 is under constant pressure, and rejection bounces are getting weaker.
• Bulls need a break and stabilization above 3345 to regain control.
• A clean break under 3330 would likely trigger a continuation towards 3280.
________________________________________
4. Trading plan
I’m currently holding a long trade, slightly in the red. My approach:
• Bullish case: Break and hold above 3345 → upside open towards 3380.
• Bearish case: Break below 3330 → downside continuation to 3280, which also means stop loss for me.
For those not in the market, the best choice is to wait for clarification before entering.
________________________________________
5. Closing note
Gold is at a decision point. Very soon, the market will confirm the next direction. Until then → patience and discipline are the best strategy. 🚀
Disclosure: I am part of TradeNation's Influencer program and receive a monthly fee for using their TradingView charts in my analyses and educational articles.
