GBPJPY – Critical Zone Between 199 and 200Last week, I mentioned that I was watching both GBPJPY and EURJPY closely, as a strong drop could be just around the corner.
Given its higher volatility, I chose to open a short on GBPJPY, which I closed Friday with a negligible profit after the pair reversed once more from just under 199.
Despite that, my overall outlook hasn’t changed – in fact, it has been reinforced by yet another failed attempt to conquer the 200 zone.
📌 Trading Plan:
- I’m looking to re-enter short on GBPJPY.
- My initial target remains the 195 zone.
- Confirmation: A daily close under 199 would signal that a top is likely in place.
- Negation: If the market stabilizes above 200, this bearish scenario is off the table.
In other words, GBPJPY is at a critical juncture – either it confirms the top and accelerates lower, or the 200 level finally gives way.
That being said, I’m prepared for the short side. 🚀
Disclosure: I am part of TradeNation's Influencer program and receive a monthly fee for using their TradingView charts in my analyses and educational articles.
Signalprovider

XAGUSD – Silver Shining Brighter Than Gold?
At this moment, Silver looks technically stronger than Gold – and here’s why:
• Last Monday’s drop: Both Gold and Silver fell sharply, but what followed made the difference. While Gold moved sideways in consolidation, Silver bounced faster and even printed a new local high at 38.80, touching key resistance.
• Friday’s candles: Gold closed the day with a bearish pin bar, while Silver showed the opposite – a bullish pin bar, signaling demand at lower levels.
• Asian session behavior: Gold made a new low, but Silver instead printed a higher low, adding further strength to the bullish case.
📌 Conclusion:
As long as 37.50 holds, Silver’s structure remains constructive.
• A confirmed breakout above 38.80 resistance will open the way for a new leg higher.
• In that scenario, I expect the 40+ zone to be tested.
Silver is quietly building relative strength against Gold – a signal traders shouldn’t ignore. 🚀
Disclosure: I am part of TradeNation's Influencer program and receive a monthly fee for using their TradingView charts in my analyses and educational articles.

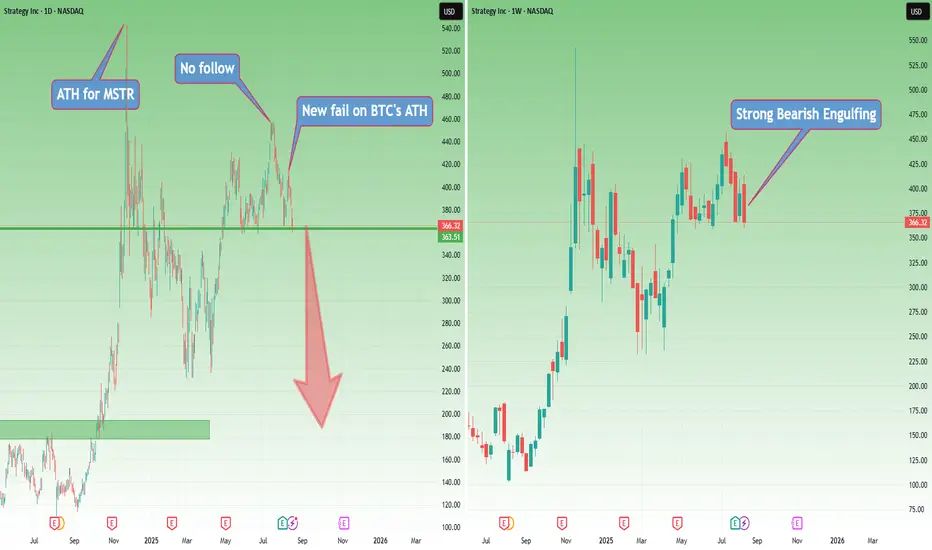
MSTR: A Giant with Feet of ClayExactly two weeks ago, I wrote an article with a rhetorical question: “Why should you buy Strategy if you want exposure to BTC?” and argued that MSTR could fall—and fall hard.
Two days ago, BTC printed a new ATH. That move was visible in MSTR as well; however, we’ve got a lower high and a new fail for the stock.
Even more, this fail has formed the right shoulder of an H&S pattern.
On the weekly chart, there’s a strong bearish engulfing that ended exactly at the neckline of the pattern.
This type of price action is far from bullish, regardless of what one may want to dream of.
BTC is above confluence support. If it breaks this level, Strategy will fall even harder.
In my last post, out of 12 comments, 5 were hate comments—because “how can I say such enormities, that Strategy could fall.”
The answer is simple: the chart doesn’t look good at all.
Even if BTC reverses from this support, in my opinion the reflection in MSTR will be minimal.
And anyway, I trade what I see, not what Saylor sells me.
That being said, a drop of BTC under confluence support will most probably lead to a break below the neckline for Strategy. And if BTC delivers a meaningful correction, Strategy will fall like a giant with feet of clay that it is.
3330 Under Pressure – New York Could Decide the MoveYesterday’s Move
Yesterday, after the initial rejection from the 3370 resistance zone, Gold broke below the 3350 confluence support and tumbled toward the 3330 key support. Since then, the price has been consolidating, with low volatility — largely due to the European bank holiday.
Key Question
Has the market gathered enough energy for another leg down, or will buyers manage to defend 3330?
Why a Bearish Continuation Is Possible
- The 3330 zone is now being tested repeatedly, showing weakening buying interest
- A confirmed break under 3330 would open the way toward the 3280 support zone.
Trading Plan
I will watch for a clear break under 3330 during the New York session, aiming for a move toward 3280. Any long position becomes interesting only if we get a daily close above 3360.
Final Note
The market still needs to confirm — patience is key.
Disclosure: I am part of TradeNation's Influencer program and receive a monthly fee for using their TradingView charts in my analyses and educational articles.

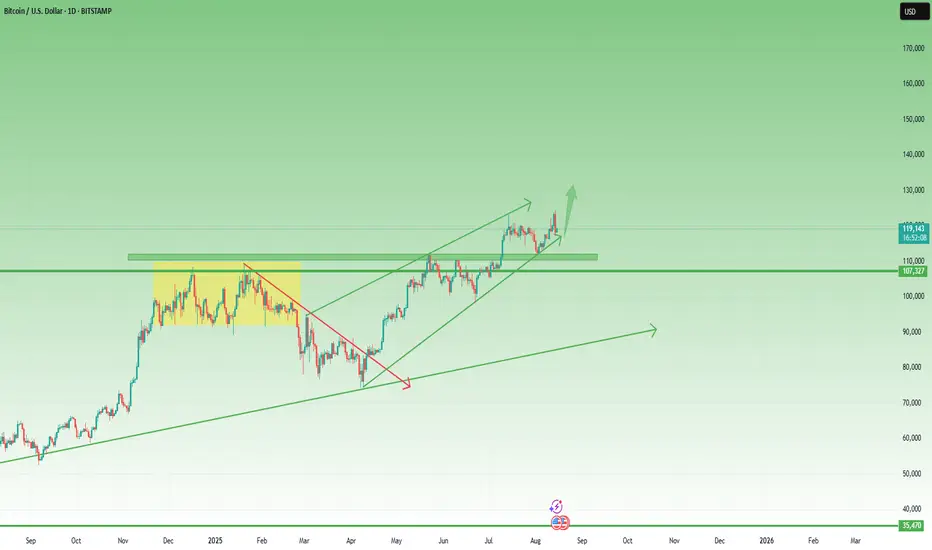
This BTC Pullback Doesn’t Break the Bullish StructureYesterday, BTC dropped around 5% from its freshly printed intraday ATH, reaching a low of 117,300. Should bulls be worried?
In my view, this drop can’t be seen as more than just a correction — while it was indeed quite deep, the overall structure remains fully intact.
Price is still comfortably above the ascending trendline that started in April, and even higher than the nearest horizontal support.
Bottom line: As long as BTC stays above the 110–112k zone, there’s no real reason for concern.
For short-term traders, this dip could even be seen as a buying opportunity — anticipating a push towards a new ATH above 125k. 🚀
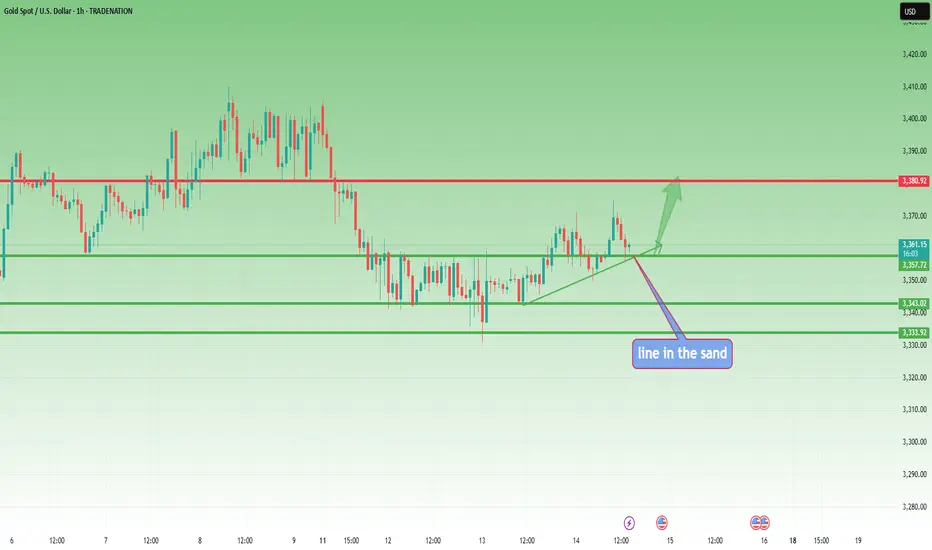
Gold: From Bullish Bias to Bearish Shift- N.Y UpdateIn this morning's analysis, I mentioned that Gold was still in bullish territory, but the line in the sand was the 3350–3355 zone.
In fact, I bought at that level — but given the choppy price action and the sharp rejection from the 3375 resistance, I kept the position size small. Good thing I did, as the stop loss was eventually hit.
With price now falling below the 3350 zone and showing what can be categorized as a strong reversal from resistance, the odds have shifted decisively to the bearish side.
Trading plan: Any rally above the 3350 zone should now be viewed as an opportunity to sell into strength. 🚀
Disclosure: I am part of TradeNation's Influencer program and receive a monthly fee for using their TradingView charts in my analyses and educational articles.

EUR/JPY – Lower High in the Making?As explained in my JPY Index analysis , alongside GBP/JPY, EUR/JPY is another strong candidate for a meaningful drop.
From the chart: after reaching a high near 174 — close to the 2024 ATH — the pair had its first leg down. When price dipped to the 170 psychological level, bulls stepped in, attempting a push to new highs.
However, at 173, it was the bears’ turn. The pair reversed again, potentially forming a lower high.
I believe we are in the early stage of a stronger drop, and in my view, rallies around 172 should be sold. The downside target is around 166.50, with this scenario negated on a break above the recent high. 🚀
Disclosure: I am part of TradeNation's Influencer program and receive a monthly fee for using their TradingView charts in my analyses and educational articles.

JPY Index – At a Critical JunctureLast month, I pointed out that the JPY Index was sitting in a very important support zone, making pairs like GBP/JPY and EUR/JPY worth keeping on traders’ radar.
Indeed, the index rebounded, which translated into a drop for both EUR/JPY and GBP/JPY. After the initial bounce, the index returned to test that zone once more.
What’s interesting now is that if the index continues higher, it will also break above the falling trendline. This could trigger an acceleration — and for GBP/JPY and EUR/JPY, that could mean a 500-pip drop.
JPY pairs should definitely be closely monitored from this point on. 🚀

Gold – Bulls Still in Control, but Caution NeededIn yesterday’s analysis, I mentioned that Gold could reverse to the upside and challenge the 3375–3380 resistance zone. Throughout the day, dips were consistently bought, and last night the price briefly tapped into that area.
The overall structure remains bullish, but there are a few important notes:
1. Price action continues to be choppy.
2. Gold reversed quickly from 3375 overnight, which calls for caution from the bulls.
3. The 3350–3355 zone is the line in the sand — it is imperative for bulls to keep the price above this level.
That being said, and with the caution mentioned above, I remain bullish and expect another test of 3375, and potentially even a move beyond 3380. 🚀
Disclosure: I am part of TradeNation's Influencer program and receive a monthly fee for using their TradingView charts in my analyses and educational articles.
GBP/JPY – Possible False Break Above 200After confirming 195 support at the beginning of August, GBP/JPY posted 7 consecutive daily gains, bringing the pair back to resistance and even spiking above it — briefly crossing the important psychological level of 200.
Today started with a sharp drop, suggesting that the 200+ zone is a significant milestone and hinting at a potential false breakout.
Trading Plan:
I will work with the assumption that GBP/JPY bears will hold firm around 200. The ideal sell zone is near 199.50, with a swing target back to the 195 support area, offering a risk–reward ratio of 1:5.
A sustained move above 200 would invalidate this scenario. 🚀
Disclosure: I am part of TradeNation's Influencer program and receive a monthly fee for using their TradingView charts in my analyses and educational articles.

Gold Coils for a Big Move – Here’s My Plan1. Market Recap
Monday was a nasty day for Gold bulls, with the price slowly bleeding lower until it reached 3340 support.
Since then, price action has been trapped in an annoying range, swinging violently between support and resistance — just like in the final days of last week. Even yesterday’s CPI release failed to spark a real directional move, adding nothing but short-lived noise.
2. The Key Question
Has Gold finished consolidating, and is it ready to break out of this range?
3. Why I Lean Bullish at this Moment
• The recent spike down to 3330 support aligns perfectly with the Fibonacci golden zone.
• Stabilization around 3350 suggests the market is finding a short-term balance point.
• Resistance at 3360 is the critical barrier — once cleared, it could confirm a reversal.
4. Trading Plan
I hold a bullish bias for the near future.
• A confirmed break above 3360 could open the path to 3380 resistance and possibly a fresh test of 3400.
• A sustained drop below 3330 would cancel this scenario and shift the focus back to the downside.
5. Closing Note
Gold is coiled in a range — the next breakout will set the tone. Let’s see if the bulls have the fuel for a move higher. 🚀
Disclosure: I am part of TradeNation's Influencer program and receive a monthly fee for using their TradingView charts in my analyses and educational articles.

EUR/AUD – Second Chance for Bears?About a month ago, I drew attention to a potential long-term short setup on EUR/AUD, highlighting that the pair had formed a measured move pattern after the sharp drop from 1.85.
Since then, price broke below the rising trendline, but at that moment the drop lacked follow-through, and EUR/AUD bounced back. This bounce may now be a retest of the broken ascending trendline.
If this is the case, bears could get a second chance to enter at higher levels, with the overall bearish structure still intact.
Trading Plan: Selling around 1.79 could offer a solid medium-to-long-term opportunity, with a risk–reward ratio of approximately 1:2.5.
Disclosure: I am part of TradeNation's Influencer program and receive a monthly fee for using their TradingView charts in my analyses and educational articles.

Bullish Setup: ICP Eyes 70% Gain if Resistance BreaksAfter the strong drop that started in December last year — a move of almost 70%, from 15.5 down to around 4 — ICP entered a 4-month consolidation/accumulation phase.
The range is well defined:
• Support: around 4.5
• Resistance: slightly above 6
With Total3 showing a bullish outlook, there’s a high probability that ICP will finally break above 6 and accelerate towards the 10 USD key zone.
That would mean roughly a 70% upside, and with a 1:3 risk-to-reward ratio, this setup deserves your attention.
📌 Plan : Watch for a confirmed breakout above 6 and manage risk according to your trading rules.
🚀

EURUSD Bulls Defend 1.16 – Break Above 1.17 Could Ignite RallyOn Monday, I mentioned that EURUSD could extend its ascent thanks to a short-term pennant formation.
For this reason, I bought into dips and, fortunately, my stop loss was well placed — the pair reversed only 5 pips above it.
Now, the trade is sitting comfortably with a 40-pip profit, and in my view, the upside potential isn’t over yet.
Technical view:
• On Monday, EURUSD dipped to test the 1.1600 support zone.
• The bounce from there resumed the uptrend that started after this month’s NFP release.
• The pair is now challenging the horizontal resistance around 1.1700.
A clean break above 1.1700 would likely open the door to the 1.1800 area.
Bias: EURUSD remains bullish as long as 1.1600 holds. 🚀
Disclosure: I am part of TradeNation's Influencer program and receive a monthly fee for using their TradingView charts in my analyses and educational articles.

Silver at a Crossroads – 38.50 Break or 38.00 Collapse?Right now, Silver is worth keeping on the radar.
After falling from multi-year highs near 40 down to 36.20, the metal reversed and broke above both the falling trendline from the top and the 37.80 resistance.
Similar to Gold, the final sessions of last week were marked by range trading, with a clear top at 38.50 and bottom at 38.00.
Looking ahead:
• Bullish case: A break above 38.50 would be significant for buyers and could open the door for another test of the 40.00 zone.
• Bearish case: A daily close below 38.00 would be very negative, confirming a lower high at 38.50 and raising the probability of an ABC-type correction. In this scenario, 35.50 support becomes a likely target, with potential for a 2,500-pip drop.
Disclosure: I am part of TradeNation's Influencer program and receive a monthly fee for using their TradingView charts in my analyses and educational articles.

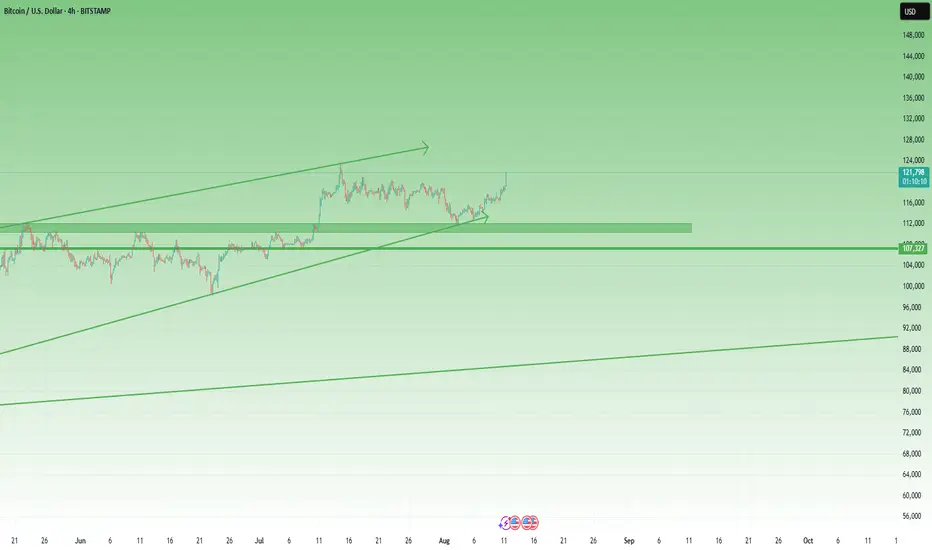
BTC Bulls Back in Control – 130K in SightIn my previous BTC analysis, I highlighted that the price was sitting right in a confluence support zone, with strong odds for a bullish reversal.
That scenario played out well — bulls regained control. After a retest of the low pruces in the middle of last week and a modest initial bounce, momentum accelerated today, pushing BTC close to its previous all-time high at the time of writing.
Looking ahead, I don’t expect the old ATH to be a major obstacle for buyers. A clean break above should open the path toward 130K+ as the next logical upside target.
For now, as long as BTC trades above 114K, bulls have no reason for concern.
Range, Gaps, and Whipsaws: Gold Awaits Its Next Big MoveThe final days of last week have been frustrating for Gold traders, to say the least.
Starting Thursday, when the price tested the waters around 3400, we entered a range — but not a calm one. The moves inside this range were sharp and violent: a quick rally to 3400 followed by an equally quick drop to the 3380 zone, and so on.
Even the final hours of Friday mirrored this behaviour, with Gold dipping to 3380 only to recover and close the week near 3400.
The Asian open a few hours ago brought another twist — a gap above 3400 that was quickly filled, followed by continued downside in what could be described as a classic “gap and crap” scenario.
From a chart perspective, the bigger picture is still unclear. We do, however, have two critical levels to watch:
• 3365 → important support
• 3400 → key psychological resistance and technical level
Until we get a clear and decisive break above or below one of these zones, direction remains uncertain.
Personal plan:
• I would avoid trading an immediate breakdown below support today — in such a case, I’d prefer to wait for the daily close before committing.
• On the other hand, if price pushes back towards 3400, I suspect we might finally see a breakout, so I’ll be preparing for long positions in that scenario.
For now, a wait-and-see approach seems most prudent.
Disclosure: I am part of TradeNation's Influencer program and receive a monthly fee for using their TradingView charts in my analyses and educational articles.

Gold Futures Hit $3,534 – Spot Lags by $100. What Could Mean?I don’t usually track Gold Futures every single day, but today a fellow trader drew my attention to something — and it’s impossible to ignore.
Gold Futures just printed an all-time high at $3,534, while spot gold (XAUUSD) topped at $3,409 — a $120 spread at the peak, now narrowed to about $100 at the time of writing.
A spread like this is highly unusual and, more importantly, unsustainable. By the time the August 27th contract expires, futures and spot must converge to the same price.
That means one of two things is about to happen — and either way, the move would be explosive.
1. Bullish Scenario – Futures Are Right
If the futures market is telling the truth, spot gold will have to accelerate higher to close the $100 gap.
If XAUUSD stabilize above $3,400, the odds of a push toward its own ATH become significant — and the move could be fast and aggressive.
________________________________________
2. Bearish Scenario – Futures Are Overreaching
If futures are overshooting, they will have to correct — hard.
From a technical standpoint, if spot will drop below $3,370, the door to a continuation is open toward at least $3,330 support.
A 400-pip drop in spot could translate into at least a 1,000-pip drop in futures, bringing the spread back toward its more typical 20–30 range.
________________________________________
Why This Matters?
Regardless of direction, $100+ spreads do not last. In the next three weeks, one side will be proven wrong, and the prices will snap back together.
Looking back at this year’s price action, spot and futures have always mirrored each other with an average spread of 20-30usd, depending on conditions and expectation, and for example:
• The spot ATH at $3,500 matches $3,509 in futures.
• The May low was identical in both markets.
This current divergence is the outlier — and it’s screaming that a major move is coming.
________________________________________
Bottom line: If futures are right, spot gold is about to rip higher. If spot is right, futures are about to collapse.

Gold Price Action Update: Neutral to Bearish BiasThis week, apart from my short trade on Tuesday, I’ve maintained a bullish outlook on Gold, suggesting buying the dips with the expectation of a breakout above the 3380-85 zone. I was targeting an acceleration above 3400 and eventually 3440. I followed through with this idea and bought in anticipation of the move.
However, something about Gold's recent price action raised a red flag for me, prompting me to close my buy positions. Let’s break it down:
Starting yesterday morning, the price action became erratic. Initially, we saw the expected breakout, but it was quickly reversed, and the price action turned choppy. Then came a series of quick pumps, followed by quick reversals—each time the market would move up, only to fall back again. As of writing, we’re sitting at 3388.
This kind of erratic movement usually suggests that we’re nearing a top, and even if Gold spikes again above 3400, I don’t want to hold positions in a market that’s so volatile and unsustainable in either direction.
So, I’m out for now, adopting a neutral to bearish stance.
If the price drops below 3370, it would indicate a likely top formation, and at that point, I’ll be looking to sell rallies; till then, wait and see.
Disclosure: I am part of TradeNation's Influencer program and receive a monthly fee for using their TradingView charts in my analyses and educational articles.

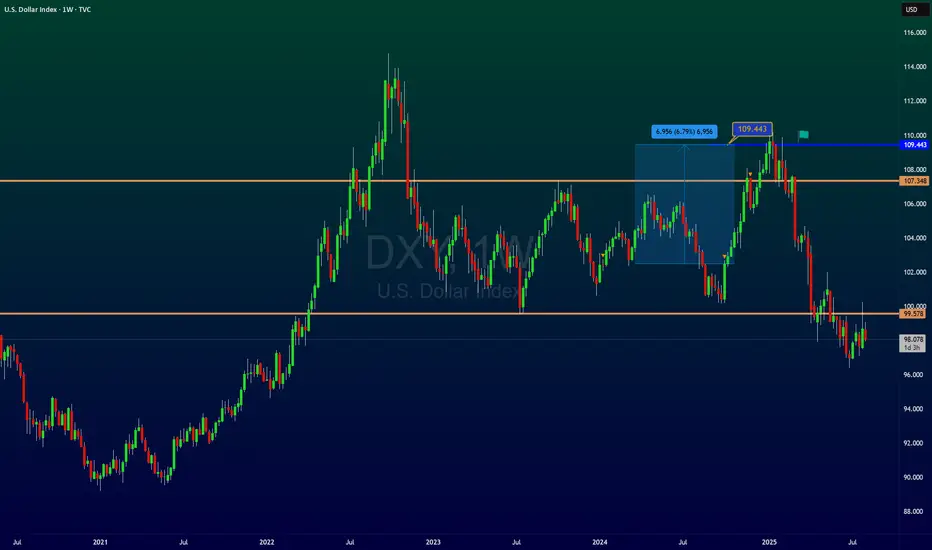
DXY and a huge profit Resault: &$& pips ProfitAfter a long time, I'm back with new and profitable analyses, but before that, let's take a look at the previous analyses and update them.
stay with me and support my ideas
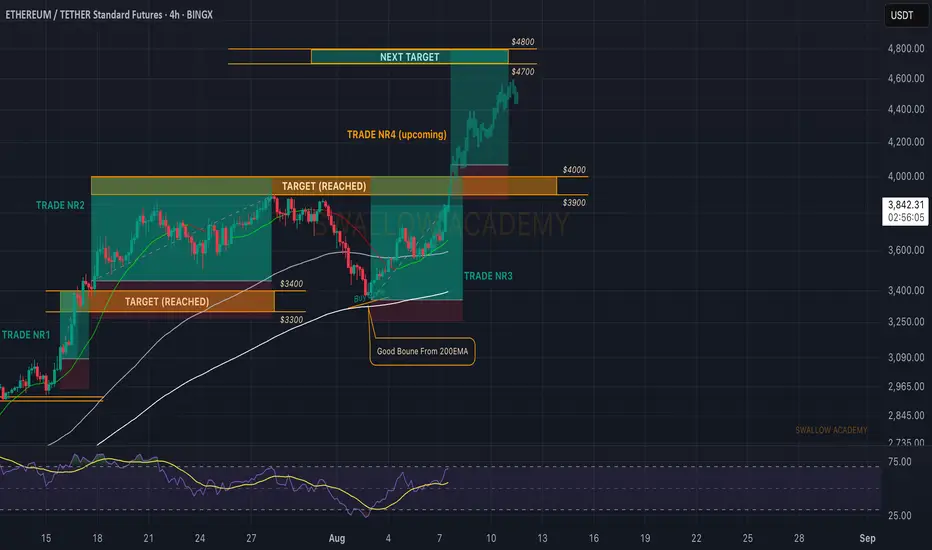
Ethereum (ETH): On Fire, Heading For Another Breakout Attempt ETH is on fire, where the price is catching the buyside momentum and probably going for that $4000K breakout attempt once again, where our trade will be closed as well (in the region of $3950-$4000).
So we wait for that zone to be reached and once we break it there, we will be looking for another entry for a long to $4800!
Swallow Academy
Gold – Bulls Hold the Line, Pressure Builds for Upside BreakoutIn yesterday’s analysis, I argued that following Tuesday’s reversal — which printed a strong continuation bullish Pin Bar — buyers had regained control despite the intraday pullback.
For this reason, I suggested looking to buy dips, as the structure remained constructive.
And once again, during yesterday’s session, the scenario repeated itself.
The drop toward the 3360 zone was met with renewed buying interest, keeping the bullish structure intact.
________________________________________
🔍 Technical Context – Higher Lows Building Pressure
At the time of writing, Gold is trading around 3380, a short-term resistance area that has capped gains so far.
However, the technical picture remains bullish:
Starting with Monday’s low at 3340, which came after a strong impulsive leg up, price has printed a clear succession of higher lows.
This behavior strongly suggests increasing buying pressure and builds the case for a potential breakout to the upside.
________________________________________
🎯 Trading Bias – Holding My Long Position
My bias remains bullish.
In fact, I’m currently holding a long position, entered yesterday, which is now running with a 150 pips unrealized profit.
I’m sticking with the trade, anticipating that a confirmed break above 3380–3390 could trigger upside acceleration toward my final target — a 750 pips profit objective.
________________________________________
🔄 What to Watch Next
• Daily close: A close above 3380=3385 zone would add confirmation to the bullish thesis.
• Key support: The zone around 3360 is now support.
• Breakout trigger: A move above 3380–3385 could unleash momentum buying and open the path to higher levels.
________________________________________
Let’s stay patient and let the market confirm the breakout.
Until then, the structure favors the bulls. 🚀
Disclosure: I am part of TradeNation's Influencer program and receive a monthly fee for using their TradingView charts in my analyses and educational articles.

XAUUSD – Bears Gave It a Shot, But Bulls Still in Control1. Quick recap of yesterday
In yesterday’s analysis, I highlighted the possibility of a short-term correction on Gold and noted that, although risky, a short trade could be justified. Acting on that conviction, I took a short with a sniper entry, capturing over 250 pips in floating profit. However, Gold found strong support around 3350 and reversed aggressively. I closed the trade with a more modest +140 pips gain.
2. Key development: NY session reversal
Despite early signs of weakness, the New York session flipped the script, sending Gold back toward the top of the daily range. The daily close near highs tells us one thing:
➡️ The bulls aren’t done just yet.
3. Technical outlook
• Resistance remains firm at 3375–3380+ zone
• A clear breakout above this zone opens the door for 3400+, with a likely magnet at 3430
• As long as the market holds above this week’s low, dips are buyable opportunities
4. Trading plan
For now, the bias shifts back to the long side. I’m watching for intraday dips to build longs, with invalidation below this week’s low. The structure favors continuation — but only if 3380 gives way we have confirmation.
5. Final thoughts
Gold may have teased the bears, but the real power still lies with the bulls. If momentum kicks in above 3380, we could be on our way to test 3430 soon. 🏹
Disclosure: I am part of TradeNation's Influencer program and receive a monthly fee for using their TradingView charts in my analyses and educational articles.
