BTC at a Critical Inflection Point Following a Decisive Sell-OffHello, I'm Camila.
Price declined decisively, reflecting strong bearish momentum as sellers maintained clear control over the market. However, once price reached a key support area, selling pressure began to fade, suggesting that buyers were starting to show interest.
This was followed by a strong rebound that broke above the short-term descending trendline, marking the first meaningful sign of a potential trend shift. This breakout indicates that buyers are returning to the market and actively attempting to regain control.
The immediate upside target is located around the 107,000 USD area, which aligns with the 0.5–0.618 Fibonacci retracement zone. This region often acts as a magnet for price, attracting corrective moves before the market commits to its next directional decision.
If buyers are able to hold above the recent breakout level and build momentum, a deeper recovery move may unfold. On the other hand, failure to sustain price above this level could lead to a pullback into the demand zone for a retest before the next advance.
In summary, buyers are cautiously probing the market. The key question now is whether they can maintain control above the breakout point and confirm the shift in market structure.
Wishing you disciplined and successful trading.
Signals

Lingrid | GOLD Trend Continuation After Corrective PhaseOANDA:XAUUSD remains within a well-defined upward channel after completing a healthy corrective move from the recent higher high. Price has respected the 4,300 support zone, printing a higher low directly on the rising trendline — a key signal that bullish structure is still intact.
This area acts as a technical demand zone, combining support and prior consolidation, making it a high-probability zone for continuation. As long as price holds above 4,350, buyers are expected to defend the structure and push price back toward 4,510 initially, with a potential extension into the higher resistance zone.
➡️ Primary scenario: support holds → continuation toward 4,510
⚠️ Invalidation: decisive breakdown below 4,350 shifts bias to deeper correction
If this idea resonates with you or you have your own opinion, traders, hit the comments. I’m excited to read your thoughts!

Technical Rebound at Key EMA, Medium-Term Uptrend Remains IntactHello everyone,
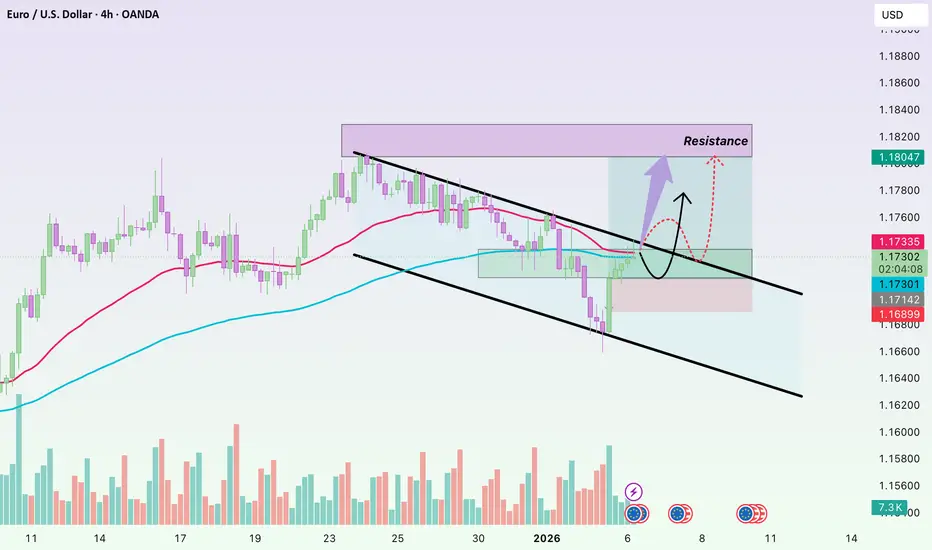
EUR/USD has just completed a fairly deep but well-controlled correction. The prior sell-off pulled price back toward the medium-term EMA zone around 1.1680–1.1700, and the subsequent rebound suggests selling pressure is no longer expanding, while buyers have started to step in to defend the broader structure.
Although price briefly printed a lower low in the short term, the medium-term picture has not been broken. At the moment, EUR/USD is fluctuating around the confluence of EMA 34 and EMA 89 near 1.1730–1.1740 — a key decision area. Holding above this zone would give the market room to continue consolidating and recovering; failure here could open the door for a retest of the prior lows.
From a macro perspective, the current backdrop does not place significant pressure on the euro. The Fed remains cautious and data-dependent, limiting the upside in US Treasury yields. Meanwhile, the ECB continues to maintain a moderately firm stance, helping EUR hold a stable price base. Upcoming data such as services PMI and US jobless claims may trigger short-term volatility, but in my view, they are unlikely to alter the medium-term trend unless a major surprise emerges.
XAUUSD – Geopolitical Rally, Market Near Trend ConfirmationHello everyone, this is Domic.
During the Asian session, gold rebounded sharply from the 4.33x area to above 4.39x, signaling a clear return of defensive flows after news that the US launched a military operation in Venezuela and detained President Maduro. Although the military action itself has concluded, Washington’s announcement of a temporary takeover to stabilize the country and oversee oil production has kept geopolitical uncertainty in Latin America elevated. In this context, gold continues to be favored as a safe haven rather than higher-risk assets.
Another notable factor is crude oil pulling back toward the 57 USD/barrel area. This suggests the market is viewing the Venezuela situation primarily through a geopolitical risk lens rather than as an immediate threat to energy supply. Rising uncertainty without a corresponding spike in oil-driven inflation expectations creates a more supportive short-term backdrop for gold.
On the H4 timeframe, technical signals are turning more constructive. Price remains above the slower EMA and has reclaimed the faster EMA after the year-end pullback. In hindsight, the decline from the 4.55x area down to 4.28x appears corrective rather than distributive. The strong reaction from the demand zone and the ability to sustain the rebound indicate that buyers have regained short-term control, placing the market in a phase where the uptrend is being confirmed rather than challenged.
Wishing you all effective and successful trading!

EURGBP | Retail 80% Long: Selling the RallyOn the daily timeframe, EURGBP continues to move inside a well-defined descending channel. The latest bearish impulse pushed price directly into the 0.865–0.860 demand zone, where we’re seeing an initial technical reaction — but still no clear signs of a full reversal.
RSI is hovering near oversold territory, which increases the probability of a corrective bounce. However, as long as price stays below the 0.872–0.878 supply area, the dominant bias remains bearish.
The COT report provides a more structural perspective:
institutional traders remain net long EUR and net short GBP, meaning that — in the medium term — the broader context still favors a bullish EURGBP. However, in recent weeks we’ve noticed:
• a slowdown in the growth of EUR long positions
• early signs of short covering on GBP
This does not invalidate the EUR>GBP narrative, but it does suggest that the euro’s advantage is weakening.
Seasonality in January is historically slightly negative for EURGBP: the month often starts with weakness and only stabilizes later. This is consistent with the current downside move.
Retail sentiment, on the other hand, is extremely skewed:
more than 80% of retail traders are long EURGBP.
From a contrarian perspective, this supports the idea of further downside.
Overall picture suggests:
• bearish technical structure
• COT still pro-EUR, but losing momentum
• unfavorable seasonality
• retail heavily exposed on the long side
For that reason, I currently treat EURGBP as a “sell the rally” market:
any rebounds into 0.872–0.878 (or mid-channel) may offer short setups with potential targets:
→ 0.860
→ 0.855
→ and, in extension, deeper liquidity pockets below
The bearish bias would be invalidated only by a daily close above 0.880–0.882, especially if supported by renewed COT strength and an improvement in sentiment.

EUR/USD: A Healthy Correction Ahead of the Next RallyHello everyone, Camila here!
On the H4 timeframe, the bullish structure remains clearly intact. Price continues to form higher highs and higher lows, while the ascending trendline drawn from key swing lows is still being respected by the market. This indicates that the primary buying pressure has not left the market.
After breaking out of the compression area and printing a new high, EUR/USD has entered a correction to retest the previous breakout zone. This is a very common technical behavior associated with institutional money flows. The market often returns to recently broken levels to confirm the role shift from resistance to support.
The current correction, in my view, represents a healthy pullback rather than a distribution phase. Selling pressure has not expanded, downside momentum remains controlled, and the bullish structure has not been compromised. In particular, the 1.1650–1.1660 area stands out as a key support zone, as it aligns with prior structural support and the 50% Fibonacci retracement of the latest bullish impulse.
In the scenario I am monitoring, EUR/USD may continue to decline toward the 1.1650–1.1660 area to test demand. If price holds this zone and fresh buying signals emerge, the market is likely to rebound toward the 1.1740–1.1760 resistance zone. A strong break above this resistance would open the door for further upside extension in the medium term.
From a news and macroeconomic perspective, EUR/USD is receiving a degree of support. Expectations that the Fed will maintain a dovish stance throughout 2026 continue to put pressure on U.S. Treasury yields, leading to a relatively weaker U.S. dollar. Recent U.S. economic data point to slowing growth, while inflation is gradually easing, increasing the likelihood of monetary policy easing going forward.
In Europe, the ECB continues to maintain a cautious stance without signaling aggressive easing, which helps the euro preserve relative stability. Amid ongoing global economic and geopolitical uncertainty, capital flows are becoming more flexible rather than being concentrated entirely in the U.S. dollar as in previous periods.
In conclusion, in my personal assessment, EUR/USD does not appear weak at this stage. Instead, the market is undergoing a necessary phase of consolidation and technical correction. The 1.1650–1.1660 area will be the key zone that determines the next directional move. As long as price remains above the ascending trendline, I continue to prioritize a trend-following long scenario, patiently waiting for confirmation rather than chasing short-term volatility.
Wishing you successful trading.

Gold —Resistance Reached at 4450–4460. Reversal or Continuation?At the beginning of the year, I mentioned the possibility of Gold pushing higher toward the 4450–4460 zone. That scenario has now materialized — and we even saw a brief spike above this resistance area.
However, as discussed in yesterday’s post, Friday’s decline and the subsequent rebound may still be part of an emotional reaction, rather than a clean trend continuation.
Now that the key resistance has been reached, the market sits at an important decision point:
👉 Reversal — or continuation of the bullish move?
🔎 Current Market Perspective
From my point of view, Gold may not be done correcting yet.
The structure still suggests that the more probable scenario is:
➡️ a renewed move back toward the 4350 support zone
Until buyers demonstrate sustained strength above the current highs, upside momentum remains questionable.
📌 Trading Bias
My stance for now:
👉 Bias: bearish, with 4350 as the primary downside objective
⚠️ Scenario is invalidated if price holds above 4500 with strong buying pressure
As long as 4500 caps the upside, I continue to favor a corrective rotation rather than immediate bullish continuation. 🚀

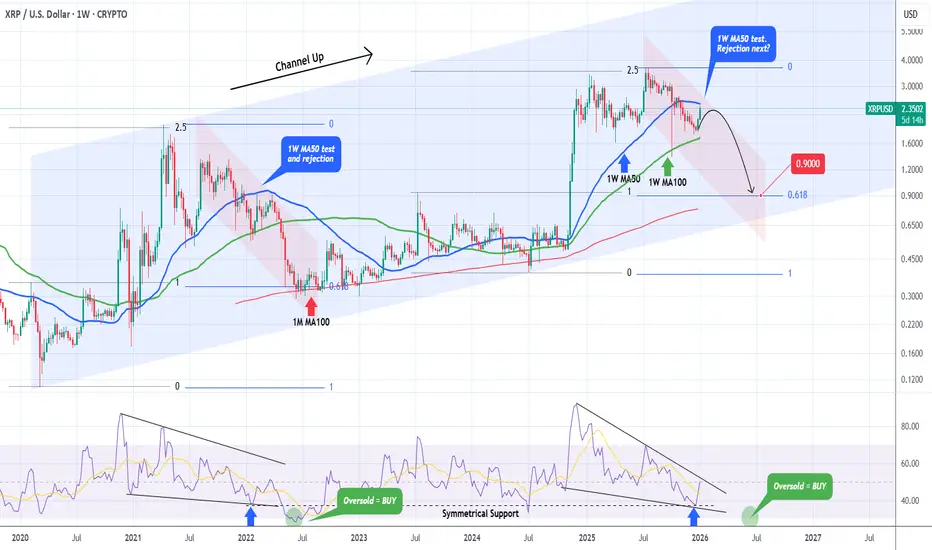
XRPUSD Testing its 1W MA50. Rejection to 0.900 starting?XRP (XRPUSD) is on a strong 2-week rise following a Low late in 2025 on the 1W MA100 (green trend-line). This rally is about to test its 1W MA50 (blue trend-line) for the first time in 2 months.
Practically, the market has been ranging between the 1W MA50-100 Zone in a similar way it did back during the previous Bear Cycle. Basically this is not the first time we present to you this chart, we first published it 2 months ago claiming that XRP has already started its new Bear Cycle following its July 2025 All Time High (ATH) and that this Cycle is the Bearish Leg of the market's 5-year Channel Up pattern.
If the market continues to replicate the 2021/22 structure, then this 1W MA50 test should produce a rejection that will take us to the 2nd stage of the Bear Cycle, which is a break below the 1W MA100 within 2 months time and an eventual bottom on the 0.618 Fibonacci retracement level and 1M MA100 (red trend-line) test at $0.9000.
Notice also how similar the 1W RSI structures are among the two Bear Cycle fractals, with the current rebound taking place on he Symmetrical Support (blue arrows) just like it did on January 22 2022.
** Please LIKE 👍, FOLLOW ✅, SHARE 🙌 and COMMENT ✍ if you enjoy this idea! Also share your ideas and charts in the comments section below! This is best way to keep it relevant, support us, keep the content here free and allow the idea to reach as many people as possible. **
---
💸💸💸💸💸💸
👇 👇 👇 👇 👇 👇
S&P500 This is the level that confirms the Bear Cycle.The S&P500 (SPX) has reached a point where it could be on the verge of initiating a new Bear Cycle as the price action that led to the end of 2025 (mostly Q4) has been very similar with the one in late 2021 that kick-started the 2022 Bear Cycle.
What confirmed that Bear Cycle was the market closing a 1W candle below the 1D MA100 (red trend-line). This is extremely critical as it has already proven its role as a catalyst during the most recent short-term pull-back in November, where it held upon tested on the week of November 17 2025 and thus rebounded. This is exactly what took place in November 2021, with the index eventually closing a 1W candle below the 1D MA100 almost 2 months later on the week of January 17 2022. That confirmed the 2022 Bear Cycle as the sell-off was accelerated and in just 1 week, the market even hit the 1W MA50 (blue trend-line).
The structure between the two fractals is so far very similar, with a huge 1W RSI Bearish Divergence (Lower Highs against price's Higher Highs) leading the index towards a potential Top. If the price action continues to repeat that of 2022, then we are looking at the very real possibility of a -27.60% overall correction within roughly 12 months time, with the first potential Target being the 1W MA200 (orange trend-line) around 5350 and second the full -27.60% extension at 5050. Those two levels technically form the potential Buy Zone for the next Bull Cycle.
The metric though that cannot be ignored as far as long-term buying is concerned, is the 1W RSI, which has historically given optimal buy opportunities when it turned oversold (i.e. 30.00 or below). If this level is hit before any of the above two Targets, we will be turning into long-term buyers again regardless.
---
** Please LIKE 👍, FOLLOW ✅, SHARE 🙌 and COMMENT ✍ if you enjoy this idea! Also share your ideas and charts in the comments section below! This is best way to keep it relevant, support us, keep the content here free and allow the idea to reach as many people as possible. **
---
💸💸💸💸💸💸
👇 👇 👇 👇 👇 👇

Lingrid | GBPJPY Momentum Continuation Trade OpportunityFX:GBPJPY remains firmly inside a well-defined upward channel, with price holding above both the ascending trendline and the former consolidation zone. The recent pullback formed a higher low, confirming trend strength and continuation intent.
Momentum is rebuilding after consolidation, and price is now positioned for a push toward the 213.8 resistance zone, which aligns with the upper channel boundary. As long as price stays above the 211.4 support area, the bullish scenario remains intact.
➡️ Primary scenario: higher low holds → continuation toward 213.8
⚠️ Invalidation: sustained break below 211.4 would weaken the bullish structure
If this idea resonates with you or you have your own opinion, traders, hit the comments. I’m excited to read your thoughts!

So, Maduro's capture is good for BITCOIN ??Bitcoin (BTCUSD) and especially the altcoin market, has been rising strongly every since Maduro's capture by the U.S., which is the most dominant macro geopolitical event since perhaps Trump's global tariffs a little less than a year ago.
So what does that mean, that such an act is good for the crypto market? Well not quite. Macro economic and geopolitical unrest events like this have acted as catalysts for major market movements that rarely are to the upside.
Some may argue that BTC is purely acting on its original inception role, a safe haven against times of uncertainty/ volatility. But what we see on these first trading days of 2026, is that the market is so far following the historical Bear Cycle print that all previous cycles followed.
What's that? It broke above its 1D MA50 (blue trend-line) for the first time in over 2 months, marking the first Low of the new Bear Cycle. What all previous Bear Cycles did when that break-out took place, was a short-term rebound (counter trend rally) that always hit the 1D MA200 (orange trend-line) and got rejected. In 2 times out of 3, it also tested the 0.5 Fibonacci retracement level from the recent Low.
After that 1D MA200 test was concluded, the bearish trend was resumed and the price bottomed towards the end of that year. In 2 out of 3 Cycles again, the bottom was at or below the 0.382 Fibonacci retracement level from the previous Cycle Low. Only the 2014 Cycle differed but that's to be expected as it was the first one and at the same time most aggressive. The current 0.382 Fib with a Target price of $56700, would be much less aggressive, which is natural due to the Theory of Diminishing Returns and Bitcoin's price stabilization as mass adoption kicks in more and more with each passing Cycle.
As a result, what we still think (presented this possibility over a month ago) the market will do now is rally towards 100k and then start Phase 2 of the Bear Cycle to bottom at least on $56700.
Do you agree that's a viable scenario? Feel free to let us know in the comments section below!
---
** Please LIKE 👍, FOLLOW ✅, SHARE 🙌 and COMMENT ✍ if you enjoy this idea! Also share your ideas and charts in the comments section below! This is best way to keep it relevant, support us, keep the content here free and allow the idea to reach as many people as possible. **
---
💸💸💸💸💸💸
👇 👇 👇 👇 👇 👇

NZDCHF Will Go Lower! Sell!
Take a look at our analysis for NZDCHF.
Time Frame: 4h
Current Trend: Bearish
Sentiment: Overbought (based on 7-period RSI)
Forecast: Bearish
The market is on a crucial zone of supply 0.459.
The above-mentioned technicals clearly indicate the dominance of sellers on the market. I recommend shorting the instrument, aiming at 0.457 level.
P.S
Please, note that an oversold/overbought condition can last for a long time, and therefore being oversold/overbought doesn't mean a price rally will come soon, or at all.
Like and subscribe and comment my ideas if you enjoy them!

XAUUSD - Macro Tailwinds Align with a Technically Intact UptrendHello everyone, Camila here!
From a fundamental perspective, gold continues to receive clear support from macroeconomic factors. Expectations that the Fed will maintain a dovish stance throughout 2026 are keeping downward pressure on U.S. Treasury yields. As yields cool, the opportunity cost of holding gold declines, allowing capital to rotate back into the precious metal. In addition, ongoing geopolitical risks and unresolved global economic uncertainties mean that gold remains a preferred defensive asset.
From a technical standpoint, I see no signs of a trend reversal at this stage. On the H4 timeframe, the bullish structure remains firmly intact, with a clear sequence of higher lows. The ascending trendline extending from November to the present continues to be respected, indicating that buying pressure still dominates the medium-term market direction.
The 4.28x–4.30x price zone plays a critical role in the overall structure. This area previously acted as strong resistance and has now successfully flipped into support after being broken. Repeated price reactions and rebounds from this zone suggest that the market is accepting a higher price base, rather than entering a distribution phase.
Following the sharp correction from the recent peak, price behavior indicates that selling pressure has lost momentum. Instead of extending lower, price has begun to consolidate and form a structure resembling an inverse Head & Shoulders. The right shoulder remains relatively tight, signaling weakening bearish pressure and active supply absorption. This phase often represents a “pause” before the primary trend resumes.
My preferred short-term scenario is a modest break above the upper resistance, followed by a pullback to retest the newly broken area. If the underlying support continues to hold, this retracement should remain purely technical. In that case, gold would have a solid foundation to extend its advance toward the 4.49x region in the coming sessions.
Wishing you successful trading.

EURUSD Strong Bearish Continuation ScenarioQuick Summary
EURUSD continues to decline with strong momentum and is expected to extend the move toward 1.16610. There is currently no technical reason supporting a bullish reversal since all upside levels are already mitigated. However, if price rallies first toward the equal highs at 1.17633, that area would also present a valid sell opportunity.
Full Analysis
EURUSD remains under clear bearish pressure and continues to move lower with strong momentum. The current price action does not show any meaningful signs of exhaustion or accumulation that would justify a bullish scenario at this moment. All nearby upside levels have already been mitigated, removing the incentive for the market to push higher in the short term.
Given this context, the most likely path for price is a continuation of the decline toward the 1.16610 level. This level represents the next logical downside objective where liquidity may be resting and where the market could pause or reassess direction.
That said, an alternative scenario must also be considered. If price unexpectedly retraces higher before continuing its drop and reaches the equal highs at 1.17633, this area would act as a strong sell zone. Equal highs often attract liquidity, and a reaction from this level would offer another high probability opportunity to align with the prevailing bearish bias.

Gold’s Disciplined Climb: Is the $4,541 Target the NextXAUUSD / H1 — Market Update
Gold is maintaining a highly disciplined bullish posture, advancing within a well-defined ascending parallel channel. The market structure is characterized by a textbook series of Higher Highs and Higher Lows (noted by the orange reaction circles), signaling sustained buying pressure and strong trend health. Currently, price is navigating the upper half of the channel, eyeing a major liquidity pool sitting at the horizontal resistance level.
The technical alignment is strongly supportive of the upside. Both the EMA 34 (Blue) and EMA 89 (Yellow) are sloping upward with healthy separation, acting as dynamic support zones. The current price action suggests a brief period of consolidation or a minor "buy-the-dip" opportunity as the market prepares for the next impulsive leg toward the psychological and technical targets above.
Key Levels
Resistance: 4,520 (Channel Top) – 4,541 (Major Horizontal Ceiling)
Support: 4,445 – 4,455 (Channel Lower Boundary / Demand Zone)
EMA Support: ~4,428 (EMA 34)
Trading Scenarios
➡️ Primary: A shallow pullback toward the 4,445 – 4,455 zone (intercepting the lower trendline) → validation of a Higher Low → continuation higher toward the 4,541 liquidity target.
⚠️ Risk: A decisive hourly close below 4,428 (EMA 34) would signal a temporary shift in momentum, likely leading to a deeper correction toward the EMA 89 (~4,400) before any further upside attempts.

GOLD ANALYSIS 01/06/20261. Fundamental Analysis:
a) Economy:
• USD: Slight recovery mainly due to early-year technical factors; no strong data yet to confirm a long-term bullish trend.
• US Stocks: Stable; capital has not shifted strongly into safe-haven assets.
• FED: The market is waiting for more policy signals and early-year economic data → observation mode.
• TRUMP: Donald Trump is leaning toward a managerial/transition role regarding the Venezuela issue, with no new policy shock created for the market.
• Gold ETF: SPDR Gold Trust shows no buying or selling → major funds remain on the sidelines, confirming a wait-and-see sentiment.
b) Politics:
• US – Venezuela tensions have ended; short-term geopolitical risk has decreased, providing no strong catalyst for a sharp gold rally.
c) Market Sentiment:
• The market at the beginning of the year is neutral – cautious, waiting for confirmation and new information.
2. Technical Analysis:
• The overall trend remains a medium-term uptrend (higher highs compared to previous peaks).
• Price is currently in a technical correction after failing to hold higher levels, oscillating around the MA cluster.
• RSI has pulled back from high levels but has not entered oversold territory → a healthy correction, not a trend reversal.
👉 Overall: Sideways consolidation – correction within an uptrend, suitable for BUY on dips, not suitable for SELL against the trend.
RESISTANCE: 4,455 – 4,468 – 4,500
SUPPORT: 4,420 – 4,400 – 4,380
3. Previous Market Session (5/01/26):
• Gold rose 120 points, exactly as analyzed.
• No further breakout; price moved sideways in accumulation, with buying pressure weakening near resistance.
• No support from ETFs → slow price reaction, narrowing range.
• Slight USD recovery created short-term corrective pressure but not enough to break the bullish trend.
4. Today’s Strategy (6/01/26):
🪙 SELL XAUUSD | 4497 – 4495
• SL: 4501
• TP1: 4489
• TP2: 4483
🪙 BUY XAUUSD | 4443 – 4445
• SL: 4439
• TP1: 4451
• TP2: 4457

Lingrid | GOLD Swap Zone Bounce Signals Trend ContinuationOANDA:XAUUSD reacted strongly after pulling back from the 2025 high, finding demand inside the 4,270–4,280 swap zone, where prior structure and the rising trendline converge. The rebound from this area suggests selling pressure may be losing control rather than accelerating into a trend reversal.
If price continues to respect this support, a recovery move toward 4,460 could develop, followed by a possible re-test of the upper resistance. The broader bullish framework remains intact as long as price stabilizes above the channel base.
➡️ Primary scenario: defense of 4,270 → push toward 4,460
⚠️ Risk scenario: acceptance below 4,250 shifts focus to deeper corrective levels
If this idea resonates with you or you have your own opinion, traders, hit the comments. I’m excited to read your thoughts!

Lingrid | SOLUSDT Bullish Setup After Channel BreakBINANCE:SOLUSDT has completed a successful channel breakout and is now holding above the reclaimed descending trendline, signaling a structural shift in momentum. The breakout follows a prolonged compression phase, which typically precedes strong directional moves.
Price is currently retesting the former resistance zone around 134–135, which now acts as key support. As long as this level holds, the structure favors continuation higher toward the 146 resistance zone, where previous supply is located.
➡️ Primary scenario: support holds → continuation toward 146.8
⚠️ Invalidation: sustained breakdown below 134 would negate the breakout and reopen downside risk
If this idea resonates with you or you have your own opinion, traders, hit the comments. I’m excited to read your thoughts!

EURUSD Bearish Continuation After PullbackQuick Summary
EURUSD broke below 1.16824, A corrective move toward the orderblock at 1.17143 is possible
This pullback is expected to act as a continuation zone for further downside and The main objective remains which is filling the liquidity void after the bullish trendline break
Full Analysis
After EURUSD successfully broke below the 1.16824 level the bearish structure remains valid
This break confirms that sellers are still in control following the loss of the previous bullish trendline
From here price may attempt a corrective move higher toward the orderblock around 1.17143
This area is viewed as a potential mitigation zone rather than a reversal point
If price reacts from this orderblock the expectation is continuation to the downside
The overall objective of this move is to continue filling the liquidity void that was left behind during the previous impulsive bullish move
As long as price remains below the broken structure this pullback is considered corrective
The bearish bias remains intact and the focus stays on downside continuation.

BITCOIN | DANCING ON THE EDGE OF FAILURE Traders,
First of all, happy new year. I hope everyone had a great holiday season. Going into the new year, I think there is a real chance that Bitcoin is setting up for a meaningful dump. To understand why, we need to look beyond price and ask the real question: who is actually driving this move?
Market context
Since January 1st, Bitcoin has been grinding higher again. Not through impulsive expansion, but through a slow, overlapping auction into the highs. This type of price action often appears near transitions rather than continuation.
Participation and flow
Looking under the hood, participation tells an important story:
Aggregated CVD across major venues continues to make higher highs, showing persistent aggressive buying
Price, however, is not expanding with that aggression and is starting to stall
Spot participation is present, but remains reactive rather than initiatory
Derivatives are clearly the dominant driver of this move, meaning aggressive buying is getting absorbed
On top of that, we now have a hidden bearish divergence on aggregated flow. Price is printing a lower high into resistance, while aggregated CVD, especially stablecoin margined futures, continues to push higher. More aggression with less progress is typical behavior during absorption and distribution.
Structural confluence at the highs
Structurally, price is trading at a major confluence area. The current high aligns with the 1.618 Fibonacci extension of the prior impulse leg, measured from the swing low into the retracement that pulled back into the golden pocket between 0.618 and 0.65. From a mathematical perspective, this is a classic harmonic sequence where reactions are statistically common.
Price failed to accept above this level. Instead, we printed a clear SFP and liquidity sweep, briefly trading above prior highs to trigger stops before rotating back below. This suggests upside liquidity was collected rather than defended.
Higher timeframe structure and weak lows
Zooming out to the higher timeframe adds another important layer. On the daily chart, multiple weak lows stand out.
The April 7 low is weak. It is defined by multiple wicks into the same area, shows no meaningful excess, and sits just above an unfilled FVG. From an auction perspective, this is unfinished business.
In addition, there is another weak low above, formed in similar fashion with repeated tests and no clean excess. This reinforces the idea that downside structure has not been properly resolved yet.
Weak lows rarely hold indefinitely. Once distribution higher up is complete, the market tends to revisit and sweep these levels to finish the auction.
Levels and expectations
Downside expectations:
Sweep of the more recent weak lows
Continuation toward the April 7 weak low
Expansion into the lower liquidity pocket
Final downside target around 64k
Upside levels to watch:
The first overhead supply zone marked by the lower grey box (around 98k)
The higher resistance zone marked by the upper grey box (between 103-105k)
Any move into these areas without acceptance would further support a distributional environment
Conclusion
In summary, we have leverage driven upside, aggressive buying being absorbed, a hidden bearish divergence, a failed acceptance at a 1.618 extension, a confirmed liquidity sweep at the highs, and multiple weak lows below price. Until price can reclaim and hold above the current resistance area, the path of least resistance remains downward.
Remember: markets do not move because of opinions. They move to finish auctions and punish those who mistake activity for progress.
---------
If you find value in viewing the market through the lens of auctions, structure, and participation, feel free to leave a like or a comment. It helps more than you might think.
From the sands before the storm,
- ThetaNomad

SILVER FREE SIGNAL|SHORT|
✅SILVER is reacting inside a higher-timeframe supply zone after a strong impulsive push. This move shows clear buy-side liquidity capture, with displacement losing momentum. Expect a bearish rotation toward the discounted imbalance below.
—————————
Entry: 76.50$
Stop Loss: 78.12$
Take Profit: 74.00$
Time Frame: 2H
—————————
SHORT🔥
✅Like and subscribe to never miss a new idea!✅

MICRON scripted blue-print. More than -50% sell-off expected.Micron Technology (MU) is on an amazing long-term rally since the April 2025 Low, currently on the 6th straight green month (1M candle) and 8th in the last 9 months. Its historic price action however shows that this remarkable uptrend may be coming to an end as the price is approaching the top of its 17-year Channel Up (started after the 2008 U.S. Housing Crisis).
Technically, this post April 2025 rally, is the Bullish Leg of this Channel Up and it already broke above the 0.786 Channel Fibonacci, a level that has only broken 3 times in total, with the last being in June 2018.
At the same time, it is close to completing a +601.35% rise, which despite being unusually high, Micron has done such rally 3 times in the past. The remarkable feat is that all those rallies where exactly +601.35%!
Last but not least, the 1M RSI is massively overbought and is approaching Resistance 2 (89.00), which was last seen on the June 2014 High.
All those factors collectively, force a huge bearish dynamic long-term. At best, we may see this rally exhaust near $440 on the short-term, thus fulfilling the +601.35% Bullish Leg blue-print but on the long-term the value of selling give much higher return.
And as far as a potential Target for this upcoming Bear Cycle is concerned, the 0.236 Channel Fibonacci level is the strongest candidate as virtually all major corrections since 2011 have hit that trend-line before the market bottomed. As this chart shows, the 0.236 Fib level has been touched 6 times since 2011, with the market hitting at least its 1M MA50 (blue trend-line) in the process on a minimum -50% decline. The 1M MA100 (green trend-line) has been its true long-term Support since July 2016.
As a result, it is highly probable that Micron drops below the 1M MA50 and hits the 0.236 Fib at around $140 before the market bottoms and turns into a long-term Buy again. At the same time, it is useful to keep an eye on the 1M RSI and Support Zone 1. This has given the last 3 major Buy Signals since December 2018. As a result, if the stock hits that level before reaching $140, we will turn into long-term buyers regardless of the price.
---
** Please LIKE 👍, FOLLOW ✅, SHARE 🙌 and COMMENT ✍ if you enjoy this idea! Also share your ideas and charts in the comments section below! This is best way to keep it relevant, support us, keep the content here free and allow the idea to reach as many people as possible. **
---
💸💸💸💸💸💸
👇 👇 👇 👇 👇 👇

NASDAQ is on the verge of collapse.Nasdaq (NDX) completed its 'Santa rally' on December 26 and since then it's been pulling back, breaking below the 1D MA50 (blue trend-line), despite today's early rise in the aftermath of Maduro's capture over the weekend.
Technically, it is repeating the Cycle Top formation of 2021. That was achieved under a Lower Highs trend-line, which as soon as the very first week of 2022, started a violent correction that extended well beyond the 1D MA200 (orange trend-line), making a first stop on the 2.618 Fibonacci extension, before a dead-cat-bounce kicked in.
Right now, the latest Lower High was that 'Santa rally' and since we've just started the first week of 2026, there are high probabilities that a new collapse will begin. Even the 1D RSI comes to confirm this, being very similar to that of late 2021.
If the market repeats the 2022 Bear Cycle, then we are looking at a first Low at 21000 (Fib 2.618) by March.
---
** Please LIKE 👍, FOLLOW ✅, SHARE 🙌 and COMMENT ✍ if you enjoy this idea! Also share your ideas and charts in the comments section below! This is best way to keep it relevant, support us, keep the content here free and allow the idea to reach as many people as possible. **
---
💸💸💸💸💸💸
👇 👇 👇 👇 👇 👇
