USDCAD: Massive Pullback Incoming or Final Trap?USDCAD is reacting from a major demand area at 1.3720–1.3770, which aligns with:
• the lower boundary of the yearly ascending channel;
• an institutional zone that has been defended multiple times (Q3 and early Q4);
• a daily RSI showing relative oversold conditions;
• a liquidity cluster below the October lows that has now been swept.
The rebound is technically justified, but its sustainability will largely depend on CAD structure (strong in the latest COT data) and on December seasonality, which is historically unfavorable for USDCAD.
The base case is a bullish pullback toward 1.3890–1.3930, followed by renewed downside pressure if macro sentiment continues to support the CAD.
The daily chart highlights:
• Primary trend: still bullish, but undergoing a deep corrective phase.
• Midline channel break → bearish acceleration into the demand area.
• Current price action: sharp rejection with increased relative volume at the lows (typical structural “spring”).
• The 1.3880–1.3930 zone is the first major supply: confluence between previous structure, the last breakdown area, and a psychological pre-pivot region.
Key technical levels:
Support: 1.3720 (demand), 1.3660 (extreme), 1.3570 (macro support).
Resistance: 1.3880, 1.3930, 1.4050.
Technical outlook:
As long as the price remains above 1.3720, the market favors a corrective rebound.
Below 1.3660, price opens the path toward 1.3570.
Seasonality – December
December is historically a bearish month for USDCAD, with negative readings across 20-, 15-, 10-, and 5-year datasets:
• 20-year avg: -0.0014
• 10-year avg: -0.0091
• 5-year avg: -0.0195 (significantly negative)
• Only the 2-year pattern shows a more neutral/volatile structure.
Seasonality takeaway: bearish bias, suggesting the current rebound is more likely a technical pullback rather than the start of a new trend.
COT Analysis (CAD + USD Index)
CAD – COT data (Nov 4, 2025)
• Non-Commercials increased CAD shorts aggressively (+8,288) while reducing longs (-1,180).
→ Indicates speculative CAD weakness in recent weeks.
• Commercials significantly increased CAD longs (+13,164).
→ Typical of institutions accumulating CAD at discounted prices.
Interpretation:
CAD displays a clear divergence: speculators are bearish, while commercials are increasingly bullish. This suggests a potential macro turning point where institutions anticipate medium-term CAD strength.
USD Index – COT data (Nov 4, 2025)
• Non-Commercials increased both longs (+6,038) and shorts (+5,474).
→ Polarized market.
• Commercials increased longs (+1,188).
→ Marginal support for the USD.
Macro COT conclusion:
• CAD: institutional buying pressure.
• USD: indecision and polarization.
Overall COT bias → medium-term bearish USDCAD, although consistent with a short-term corrective bounce.
Retail Sentiment
• Short: 37%
• Long: 63%
Retail positioning is clearly long.
Contrarian interpretation: downside risk remains elevated after the pullback.
Macro Context
• Oil remains volatile but structurally firm → historically CAD-supportive.
• The Fed maintains a cautious stance with potential rate cuts in 2026 → structural pressure on the USD.
• The BoC, although dovish, may delay cuts relative to the Fed → supportive for CAD in the medium term.
Probability 60% – Base Scenario
Pullback toward 1.3880–1.3930 before renewed bearish pressure.
Confirmations:
• Daily close above 1.3820
• Bullish H4 structural shift
Target: 1.3890
Extension: 1.3930
Failure level: below 1.3720.
Alternative Bearish Scenario – Probability 40%
A direct break below 1.3720 → continuation toward 1.3660 and then 1.3570 (macro level).
Confirmations:
• Pullback failure / squeeze
• H4 bullish breakout in oil
• Daily rejection on the USD Index.
USDCAD is currently rebounding within a broader corrective structure.
COT and seasonality do not support a strong bullish reversal, but short-term price action allows room for a move toward 1.39, where institutional interest will likely re-emerge to resume the broader macro bearish narrative.
Barring macro shocks, the preferred structure remains:
corrective rally → short setup at 1.3880–1.3930 → target 1.3720 and potentially 1.3660.
Signals

AUDUSD on its most important week of the past 5 years.The AUDUSD pair has been trading on a strong bearish trend under the heavy Resistance pressure of the 5-year Lower Highs trend-line, which just broke above it this week.
This is the most critical multi-year test for the pair as a weekly closing above the Lower Highs trend-line, thus the 1W MA200 (orange trend-line) also which has been intact since Jan 2023, will place the market on a new potentially long-term bullish trend.
If it closes below the Lowe Highs trend-line though, that would be the most optimal sell signal to target the 0.786 Fibonacci level at 0.60700.
---
** Please LIKE 👍, FOLLOW ✅, SHARE 🙌 and COMMENT ✍ if you enjoy this idea! Also share your ideas and charts in the comments section below! This is best way to keep it relevant, support us, keep the content here free and allow the idea to reach as many people as possible. **
---
💸💸💸💸💸💸
👇 👇 👇 👇 👇 👇

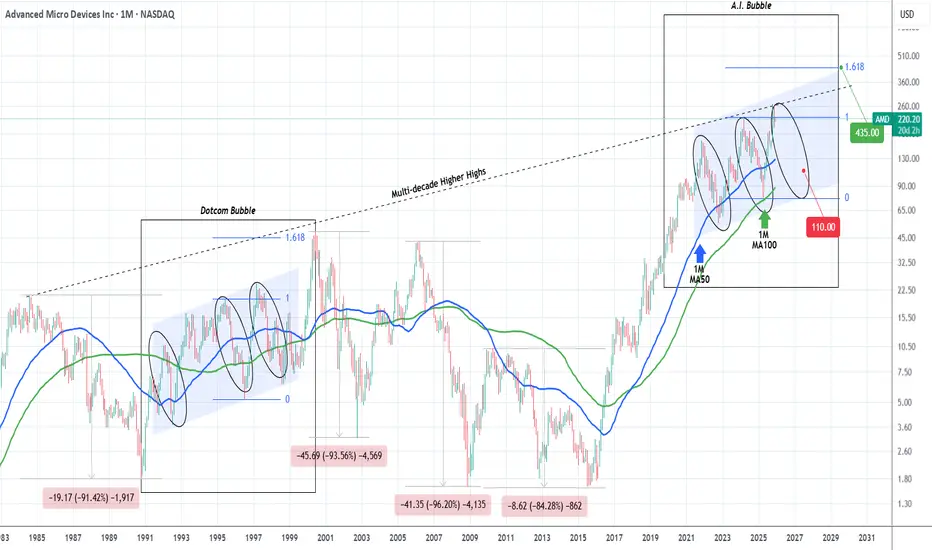
AMD started the A.I. Bubble's final Bear Cycle.2.5 months ago (October 27, see chart below), we gave a bold sell signal on Advanced Micro Devices (AMD), which at the time was against the prevailing bullish market sentiment but started to pay off immediately as the market topped and got rejected:
We still view that Top as the Higher High of its 6-year Channel Up, hence expecting the rejection to evolve into a technical Bearish Leg (Bear Cycle), targeting $110.00.
On today's analysis, we take the long-term horizon a step further as we go back to 1984 and the start of AMD's multi-decade Higher Highs trend-line, a Resistance level that has historically pushed the stock to its key market Tops.
On this 1M time-frame, we have pointed out the Dotcom (Internet) Bubble comparing it with the current A.I. Bubble. As you can see there are strong similarities between the two eras and more specifically the symmetry among their Bullish and Bearish Legs. As mentioned on the previous analysis, the current fractal has technically topped, and is now starting the new Bearish Leg towards $110 and the 1M MA100 (green trend-line).
During the Dotcom Bubble when that corresponding final Bearish Leg was completed, the market started is final parabolic rally that peaked marginally above the 1.618 Fibonacci extension and the Bubble burst.
For investors that have a long-term multi-year horizon, that translates for the A.I. Bubble into a $435 Target by 2030.
---
** Please LIKE 👍, FOLLOW ✅, SHARE 🙌 and COMMENT ✍ if you enjoy this idea! Also share your ideas and charts in the comments section below! This is best way to keep it relevant, support us, keep the content here free and allow the idea to reach as many people as possible. **
---
💸💸💸💸💸💸
👇 👇 👇 👇 👇 👇
EURCAD | Move DownLooking for EURCAD to continue the downtrend.
EURCAD is at a key level at the moment testing PDH.
If it breaks this level I expect EURCAD to move further up trying to find liquidity to fuel the next leg down.
Let me know what your analysis is on EURCAD!
Stay safe out there and do your own due diligence, this is not investment advise!

USDCHF | Long IdeaUSDCHF tapped into Previous Weekly Low and showed a reaction.
I am bullish on this so these are the POI's I look for to make entry.
If price closes under this level, I will be looking for lower POI's to find a new entry points.
Let me know what you think.
Stay safe out there and do your own due diligence, this is not investment advise!

GOLD Strong Bullish Bias! Buy!
Hello,Traders!
GOLD is trading in a strong uptrend and the players are now accumulating volume in a range structure, so we are waiting for a breakout which will be a sign of a further bullish continuation. Time Frame 12H.
Buy!
Comment and subscribe to help us grow!
Check out other forecasts below too!
Disclosure: I am part of Trade Nation's Influencer program and receive a monthly fee for using their TradingView charts in my analysis.

CHF-JPY Clear Rejection! Sell!
Hello,Traders!
CHFJPY taps into a premium-priced supply zone and prints rejection after taking local buy-side liquidity, setting the stage for an SMC-style correction toward the inefficiency below. Time Frame 5H.
Sell!
Comment and subscribe to help us grow!
Check out other forecasts below too!
Disclosure: I am part of Trade Nation's Influencer program and receive a monthly fee for using their TradingView charts in my analysis.

CHFJPY Is Bearish! Sell!
Please, check our technical outlook for CHFJPY.
Time Frame: 4h
Current Trend: Bearish
Sentiment: Overbought (based on 7-period RSI)
Forecast: Bearish
The market is approaching a key horizontal level 195.257.
Considering the today's price action, probabilities will be high to see a movement to 193.851.
P.S
We determine oversold/overbought condition with RSI indicator.
When it drops below 30 - the market is considered to be oversold.
When it bounces above 70 - the market is considered to be overbought.
Like and subscribe and comment my ideas if you enjoy them!

USDJPY LONG FROM DEMAND AREA|
✅USDJPY price drives into a discounted demand level after clearing sell-side liquidity, setting up an ICT-style rebound as bullish orderflow begins to reassert itself toward the next inefficiency above. Time Frame 6H.
LONG🚀
✅Like and subscribe to never miss a new idea!✅

NZDCHF Is Bearish! Short!
Take a look at our analysis for NZDCHF.
Time Frame: 4h
Current Trend: Bearish
Sentiment: Overbought (based on 7-period RSI)
Forecast: Bearish
The market is on a crucial zone of supply 0.466.
The above-mentioned technicals clearly indicate the dominance of sellers on the market. I recommend shorting the instrument, aiming at 0.463 level.
P.S
We determine oversold/overbought condition with RSI indicator.
When it drops below 30 - the market is considered to be oversold.
When it bounces above 70 - the market is considered to be overbought.
Like and subscribe and comment my ideas if you enjoy them!

GBPJPY 7-month Channel Up has topped. Sell Signal.The GBPJPY pair has been trading within a 7-month Channel Up since May 8 with its 1D MA100 (green trend-line) acting as its major Support thus the most optimal buy entry.
Today the price seems to be starting to reverse after two days of testing the pattern's top and the Diverging Higher Highs trend-line. With the 1D RSI having made a near Triple Top on the 70.00 Resistance, we expect the Channel Up to initiate its Bearish Leg now.
All previous Bearish Legs have hit at least their 0.618 Fibonacci retracement level, with the last two even making direct contact with the 1D MA100.
As a result, our short-term Target on this pair is 203.000 or book it earlier if the 1D RSI enters its Support Zone first.
---
** Please LIKE 👍, FOLLOW ✅, SHARE 🙌 and COMMENT ✍ if you enjoy this idea! Also share your ideas and charts in the comments section below! This is best way to keep it relevant, support us, keep the content here free and allow the idea to reach as many people as possible. **
---
💸💸💸💸💸💸
👇 👇 👇 👇 👇 👇

Commodity Market Analysis1. Fundamental Analysis of Commodities
Fundamental analysis focuses on demand and supply. Unlike stocks, commodities have no earnings or balance sheets — they are influenced by production, consumption, and global events.
Below are key fundamental factors that move different commodities:
A. Energy Commodities (Crude Oil, Natural Gas)
Crude Oil
Crude oil prices depend mainly on:
OPEC+ decisions (production cuts or increases)
US crude inventory reports
Middle East geopolitical tensions
Global economic growth (energy consumption)
US Dollar Index (inverse relation)
Example:
If OPEC announces a production cut, supply decreases → crude oil prices rise.
Natural Gas
Natural gas is influenced by:
Weather conditions (winter increases heating demand)
Storage inventory levels
Gas production & LNG exports
High summer temperatures also increase electricity demand (air conditioners), boosting gas usage.
B. Precious Metals (Gold, Silver)
Gold is not just a commodity — it's a safe-haven asset.
Factors affecting gold:
Inflation data (higher inflation → higher gold)
Interest rate decisions (Federal Reserve)
Dollar Index (strong dollar → weak gold)
Global uncertainties (wars, recession fears)
Silver moves with:
Industrial demand (solar panels, electronics)
Gold correlation
Economic cycles
C. Base Metals (Copper, Aluminium, Zinc, Nickel)
Base metals depend heavily on global economic activity.
Key drivers:
China’s economic data (largest consumer of industrial metals)
Infrastructure spending worldwide
Manufacturing & construction demand
Mining output and strikes
Example:
If China announces a stimulus package → copper demand rises → copper prices increase.
D. Agricultural Commodities (Wheat, Soybean, Cotton, Sugar)
Agri-commodities depend on:
Weather (rainfall, drought, frost)
Government MSP policies
Crop cycles
Exports & imports
Example:
A weak monsoon in India → lower wheat production → wheat prices rise.
2. Technical Analysis in Commodity Markets
Technical analysis studies price action, chart patterns, volume, market structure, and indicators to identify trade setups.
Traders commonly use:
A. Candlestick Patterns
Bullish engulfing at support in gold
Shooting star in crude oil after a rally
Hammer in natural gas at bottom levels
Candlestick analysis helps identify market psychology.
B. Chart Patterns
Popular patterns in commodities:
Double tops (crude oil reversal)
Triangles (gold consolidation during FOMC weeks)
Channels (copper trending phases)
Head and Shoulders (major reversals)
Patterns show potential breakout and breakdown zones.
C. Indicators Used in Commodity Trading
Moving Averages (20, 50, 100, 200 MA)
Used to identify the trend direction.
RSI
Identifies overbought/oversold conditions.
MACD
Shows momentum shifts.
Bollinger Bands
Useful in gold and silver for breakout entries.
Volume Profile
Helps identify high-volume zones (strong support/resistance).
Since you like volume profile, this becomes important in crude & metals.
D. Market Structure Analysis
Study of:
Higher highs / higher lows
Supply and demand zones
Break of structure (BOS)
Liquidity zones
Commodities often respect clean market structure because institutions heavily participate.
Example:
Crude oil forms HH-HL structure above 50 EMA → bullish trend confirmed.
3. Sentiment & Intermarket Analysis
Commodity markets react strongly to sentiment and cross-asset relationships.
A. Dollar Index (DXY) Impact
Gold and silver move opposite to DXY
Crude also weakens when dollar strengthens
Reason: Commodities are priced in USD globally.
B. Bond Yields
High bond yields → gold falls
Low bond yields → gold rises
Gold is a zero-yielding asset, so yields compete with gold.
C. Risk-On vs Risk-Off Sentiment
Risk-off: War, recession fear → gold ↑
Risk-on: Economic growth → crude, copper ↑
Sentiment plays a huge role in short-term movements.
D. Inventory Reports
Weekly reports that move markets sharply:
EIA Crude Oil Inventory
API Inventory
Natural Gas Storage Report
Lower inventories → prices rise
Higher inventories → prices fall
4. How to Do Practical Commodity Market Analysis
Here’s a simple but powerful approach you can use daily:
Step 1: Check Global News & Macroeconomic Events
Look for:
Fed speeches
Inflation data
OPEC announcements
Weather updates
War-related headlines
These set the market bias.
Step 2: Identify Trend Using Technicals
Use:
50 & 200 EMA
Market structure
Volume profile zones
Mark supply-demand areas.
Step 3: Use Sentiment Indicators
Check:
Dollar Index
Bond yields
Equity market sentiment
VIX (volatility index)
These help you understand whether safe-haven commodities or industrial commodities will move.
Step 4: Wait for Price Action Confirmation
Look for:
Breakouts
Retests
Reversal candlestick patterns
Volume confirmation
This protects you from false moves.
Step 5: Apply Risk Management
Commodity markets are volatile.
Keep:
Proper stop-loss
Limited position sizing
Avoid over-trading during news events
5. Why Commodity Market Analysis Is Important
High Volatility = Good Opportunities
Commodities give wide movements, helpful for intraday and swing traders.
Hedge Against Inflation
Gold, silver, and crude move sharply during inflation cycles.
Global Market Connectivity
Commodity prices influence stock sectors like:
Oil & gas
Metals & mining
FMCG and agriculture
Useful for Investors and Traders Both
Whether you trade MCX, futures, or ETFs, analysis gives clarity.
6. Conclusion
Commodity market analysis is a powerful combination of fundamentals, technicals, sentiment and intermarket relationships. A successful commodity trader understands how global events, economic trends, weather patterns, and institutional activity influence price movements.
By studying:
Supply–demand fundamentals
Chart structure and volume profile
Dollar index and bond yields
Inventory reports and geopolitical news
…you can predict commodity market trends more accurately and make informed trading decisions.
BITCOIN This is the 4H Golden Cross that Bulls need at all costsBitcoin (BTCUSD) has been on a slow rebound following the 1W MA100 (red trend-line) test and is close to forming a 4H Golden Cross for the first time in more than 2 months.
However a similar rebound attempt in December 2021, at the start of the BTC's previous Bear Cycle, after also dropping by -39.50% from the top (against today's -36.20%), failed to form a 4H Golden Cross the 'last minute' and the market resumed the bearish trend towards a new Low, completing a -50.34% total decline.
So far the 1D RSI is similar to December 2021 but there is one key difference. Now Bitcoin has already tested its 1W MA100 (and rebounding) while on the previous Bear Cycle it only came close to it in February 2022. So will that favor and support the market for a little while and make that 4H Golden Cross or the 1D RSI and -36.20% identical drop fractal will push it lower? In the first case, the market will look for a 1D MA200 (black trend-line) test around $105k, which is what happened in March 2022, while in the second for a -47.30% total drop around $67000.
One thing is for sure, if Bulls want to see some relief for some time, they have to defend that 4H Golden Cross.
Which scenario do you think will prevail? Feel free to let us know in the comments section below!
---
** Please LIKE 👍, FOLLOW ✅, SHARE 🙌 and COMMENT ✍ if you enjoy this idea! Also share your ideas and charts in the comments section below! This is best way to keep it relevant, support us, keep the content here free and allow the idea to reach as many people as possible. **
---
💸💸💸💸💸💸
👇 👇 👇 👇 👇 👇

GBPAUD Is Going Down! Short!
Take a look at our analysis for GBPAUD.
Time Frame: 4h
Current Trend: Bearish
Sentiment: Overbought (based on 7-period RSI)
Forecast: Bearish
The market is on a crucial zone of supply 2.009.
The above-mentioned technicals clearly indicate the dominance of sellers on the market. I recommend shorting the instrument, aiming at 1.999 level.
P.S
Please, note that an oversold/overbought condition can last for a long time, and therefore being oversold/overbought doesn't mean a price rally will come soon, or at all.
Like and subscribe and comment my ideas if you enjoy them!

GBPCHF Will Grow! Long!
Please, check our technical outlook for GBPCHF.
Time Frame: 1h
Current Trend: Bullish
Sentiment: Oversold (based on 7-period RSI)
Forecast: Bullish
The price is testing a key support 1.066.
Current market trend & oversold RSI makes me think that buyers will push the price. I will anticipate a bullish movement at least to 1.071 level.
P.S
The term oversold refers to a condition where an asset has traded lower in price and has the potential for a price bounce.
Overbought refers to market scenarios where the instrument is traded considerably higher than its fair value. Overvaluation is caused by market sentiments when there is positive news.
Like and subscribe and comment my ideas if you enjoy them!

BTC SHOWS WEAKNESSMorning folks,
Although BTC started well from 90K support area, mentioned last time, it has not reached 96.4K target, although tried to do it two times. Fed has not helped too much yesterday, and now obviously BTC shows signs of weakness.
If it goes bad way, we consider re-testing of 78-80K lows. But it is a bit early to talk about it. For now - let's just stay aside from any new longs and see what will happen.

Market Hunter: NASDAQ-NAS100 Sell OpportunityMy friends, Good morning!☀️
For US100-NAS100, I will open a SELL position between 24,988 and 25,243, targeting 23,843.📊
My friends, I share these analyses thanks to every single like I receive from you.
Your likes increase my motivation and make me want to support you in this way.🙏
I sincerely thank all my friends who support me with their likes.❤️

Lingrid | GBPAUD Expected Sweep of Tuesday High Before PullbackFX:GBPAUD perfectly played out my previous trading idea . Price has surged into the upper boundary of the corrective channel, brushing the Tuesday high — an area that previously acted as a turning point. This climb appears impulsive, but structure still leans bearish, especially with descending channel overhead acting as a consistent cap. The market may be probing liquidity above this zone before settling back into its broader downward rhythm.
If price sweeps the 2.0180–2.0240 pocket and fails to sustain above it, sellers may regain control and guide a rotation back toward 2.0080, where prior reaction levels converge. A deeper slide could extend toward the mid-range support, aligning with the larger declining channel.
➡️ Primary scenario: liquidity grab above 2.0180 → rejection → move back toward 2.0080.
⚠️ Risk scenario: a clean breakout and hold above channel could invalidate the downside thesis.
If this idea resonates with you or you have your own opinion, traders, hit the comments. I’m excited to read your thoughts!

Hellena | Oil (4H): LONG to the area of the maximum of wave “1”.Colleagues, I believe it is necessary to update the forecast slightly. Overall, it remains unchanged, with an upward movement expected.
At the moment, I believe that the higher-order wave “B” has formed, and now in wave ‘C’ I see a five-wave movement “12345”.
I expect wave “3” to begin its movement soon, and I consider the first target to be the maximum area of wave “1” at 60.576.
Manage your capital correctly and competently! Only enter trades based on reliable patterns!

Lingrid | BNBUSDT Bearish Opportunity After Resistance RejectionBINANCE:BNBUSDT is once again reacting to the descending channel border, where prior rallies have consistently faded, reinforcing the broader bearish rhythm. Price briefly pushed into the 900 zone but showed rejection, suggesting the move may be corrective rather than a shift in sentiment. The structure still leans downward, with market participants treating each rebound as an opportunity to offload risk.
If this supply region remains defended, it could rotate lower toward the confluence of support near 820, where the rising trendline intersects with the mid-range floor. A deeper extension may unfold if momentum accelerates, drawing price toward the larger support cluster.
➡️ Primary scenario: failure at 900 → continuation lower toward 820.
⚠️ Risk scenario: a decisive close above 900 would undermine the bearish framework and may allow a rebound toward 950.
If this idea resonates with you or you have your own opinion, traders, hit the comments. I’m excited to read your thoughts!

EURUSD Outlook Ahead of the New WeekQuick Summary
EURUSD is showing strong bullish intent heading into the new week as all downside levels have already been tested. With no clear reason for deeper correction, price is expected to continue upward, targeting the break of the descending trendline and the liquidity resting above it. A clearer entry setup will likely form during the London session, but the zone around 1.15852 can be considered as a potential buy area.
Full Analysis
The EURUSD is preparing for a bullish continuation as the new week opens. The structure shows no meaningful catalysts for further downside movement. All previously relevant levels beneath current price have already been tapped, meaning liquidity to the downside has been consumed. This removes incentive for the market to seek lower prices and instead shifts the focus toward the areas above.
With this context, EURUSD is likely aiming to push upward toward the descending trendline that has been guiding price action over recent sessions. Breaking this trendline and reaching for the liquidity positioned above it appears to be the next logical target for the market.
The cleanest entry signal is expected during the London session when volatility and direction become more defined. However, you can also keep an eye on the 1.15852 level as a potential early buy zone. If the market forms a strong reaction from this area, it could provide a solid opportunity to position for the anticipated upside move

EURUSD Bearish Outlook After Trendline BreakQuick Summary
After breaking the ascending trendline, EURUSD is expected to continue moving lower. The market may target the previous two lows to collect liquidity, and there is currently no clear buy signal.
Full Analysis
The recent break of the ascending trendline on EURUSD changes the short term outlook and suggests that the market is preparing for a deeper move to the downside. This break indicates weakness in the previous bullish structure and opens the door for the pair to target lower liquidity levels.
Price is likely to continue its decline to sweep at least the last two lows. Whether the intention is to continue the broader downtrend or simply create a deeper correction before moving higher, the immediate expectation remains bearish.
At the moment, there is no strong buy signal. The market has not shown any clear rejection or shift in structure that would support a bullish entry. Until price reaches a meaningful demand zone and shows a convincing reaction, buying would carry unnecessary risk.

BTCUSDT.P - December 11, 2025Price has broken down from a prior intraday range and is now staging a modest rebound off support around 89,300–89,400, with the main downside risk defined by the lower stop area near 87,900–88,000. The short-term trend and momentum remain bearish while below the former breakdown zone and resistance toward 91,800–92,000, where the breakeven and profit target region is marked. A failure to reclaim that resistance and renewed selling from current levels would keep the focus on a retest of the 88,000 area, while a stronger recovery through 92,000 would suggest a deeper corrective bounce toward the prior swing highs.
