Gold Range: The Longer It Holds, the Harder It BreaksAs you already know, I’m not the type of guy who writes the classic “if it’s not up, it must be down.” But with Gold stuck in this painfully 4180–4240 range, it’s almost impossible to craft a proper swing trading outlook.
The market has been trapped here since December 1st, and the longer the price stays here, the more violent the eventual breakout will be, at least this is sure.
Yesterday was a perfect illustration of indecision: Gold spent the entire session glued to 4200, and even the FED couldn’t shake it loose. As I’m writing this, price has returned right into the middle of the range — the exact place where no trader with longer-term intentions (2-3 days) wants to take a position.
That said, even if I don’t have a preferred scenario , I do have BIAS , and that bias is bearish.
If Gold slips back toward 4190, I’ll look to sell in anticipation of a breakdown.
After two weeks of range trading, the next impulsive move should have distance — and I’m targeting at least 1,000 pips to the downside once the range finally gives way.
Ohhh, yeah, if it breaks 4250 then it's up:)
Signals

BTC Isn’t Bottoming — It’s Bargaining: Why 75k Still Makes SenseAs I mentioned in my previous analysis, the idea that “BTC has bottomed” simply doesn’t convince me.
And let’s be honest: when a true bottom forms, you won’t see every account on social media announcing it. Markets don’t work that way — especially crypto, where optimism is often weaponized.
From a structural perspective, the entire rise from the 80k zone looks like a textbook corrective move. Yes, we had a perfectly normal rebound into the 94k area, but everything that followed has been classic corrective behavior:
- Mostly ranging price action
- Repeated spikes into 95k that were quickly sold
- Clear overlapping structure
- A bearish flag, which statistically favors continuation lower
If we also consider the four-month distribution phase between 110k–120k, it becomes even harder to justify a bullish reversal narrative. Distribution of that scale rarely resolves into instant trend reversals — instead, it usually marks the beginning of a deeper cycle shift.
So from a psychological standpoint, the crowd is still bargaining — trying to convince themselves the trend is intact, even though the structure keeps printing lower-probability bullish outcomes. That cognitive dissonance is exactly what fuels bear markets.
My view remains unchanged: 75k remains the primary downside target.
And for me, nothing changes unless BTC manages to stabilize above 100k — not just wicks above, but hold with clear buying interest.
Until that happens, selling rallies is the only rational play.

AUDUSD FREE SIGNAL|SHORT|
✅AUDUSD price taps into a major supply level after an extended run, showing signs of distribution in premium. ICT orderflow suggests a draw back toward inefficiency below as the market seeks liquidity beneath short-term lows.
—————————
Entry: 0.6683
Stop Loss: 0.6707
Take Profit: 0.6644
Time Frame: 12H
—————————
SHORT🔥
✅Like and subscribe to never miss a new idea!✅

NATGAS Free Signal! Sell!
Hello,Traders!
NATGAS price is reacting from a clear horizontal supply area after an aggressive displacement down, suggesting smart-money orderflow remains bearish. A retest into the imbalance aligns with premium pricing before continuation lower.
--------------------
Stop Loss: 4.724$
Take Profit: 4.527$
Entry: 4.623$
Time Frame: 3H
--------------------
Sell!
Comment and subscribe to help us grow!
Check out other forecasts below too!
Disclosure: I am part of Trade Nation's Influencer program and receive a monthly fee for using their TradingView charts in my analysis.

DAX Hidden Sell Signal on this 4H Golden Cross?DAX (DE40) has been trading within a Channel Up (green) since its 1W MA50 (red trend-line) market bottom and yesterday it formed a 4H Golden Cross. That is technically a bullish pattern but in the past 5 months, every such formation (3 in total) has been an indication of a market Top, thus a bearish signal.
More specifically, the most it took for DAX to form a top after a 4H Golden Cross within this time-frame, has been 4 days. And as you can see it's also been similar Channel Up patterns that peaked after this Cross, on an identical Lower Highs trend-line like the one that the index is about to test.
What's even more striking is that every sell-off that followed the Tops was exactly -5.15%. Identical on all 3 occasions. As a result, it is possible for DAX to decline as low as 23050 following the upcoming top. Since however the 1W MA50 is involved this time as a Support, you may want to book profits there earlier, around 23300, if you see it acting as a Support with strong buying pressure.
---
** Please LIKE 👍, FOLLOW ✅, SHARE 🙌 and COMMENT ✍ if you enjoy this idea! Also share your ideas and charts in the comments section below! This is best way to keep it relevant, support us, keep the content here free and allow the idea to reach as many people as possible. **
---
💸💸💸💸💸💸
👇 👇 👇 👇 👇 👇

EURCAD WILL FALL|SHORT|
✅EURCAD is pulling back into the underside of a higher-timeframe supply level after sweeping internal buy-side liquidity, setting up an ICT bearish continuation structure. Price is now drawing toward the next sell-side pocket at the target zone. Time Frame 7H.
SHORT🔥
✅Like and subscribe to never miss a new idea!✅

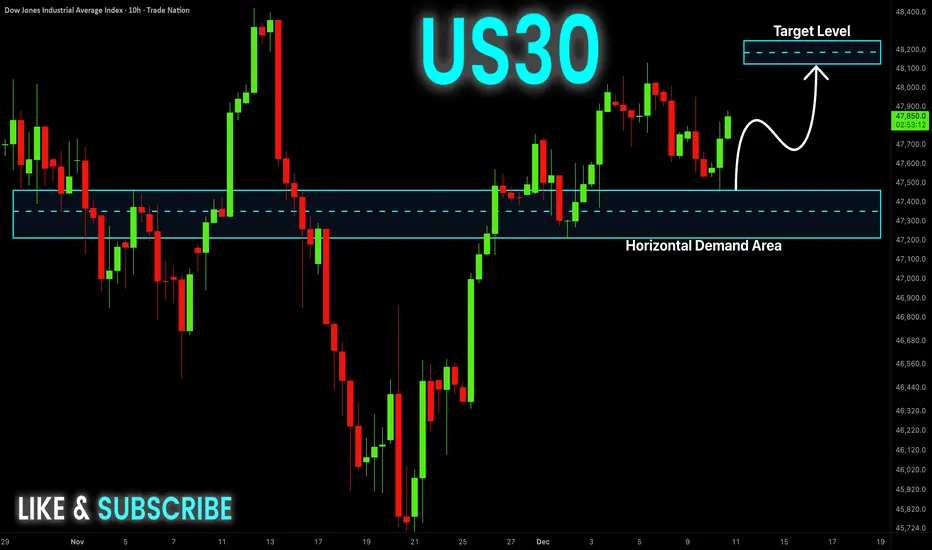
US30 Will Go UP! Buy!
Hello,Traders!
US30 has rebounded cleanly from the horizontal demand area after sweeping sell-side liquidity, confirming an SMC accumulation reaction that shifts order-flow bullish and draws price toward the next buy-side target above. Time Frame 10H.
Buy!
Comment and subscribe to help us grow!
Check out other forecasts below too!
Disclosure: I am part of Trade Nation's Influencer program and receive a monthly fee for using their TradingView charts in my analysis.
EURJPY WILL KEEP GROWING|LONG|
✅EURJPY has broken away from the demand level with strong displacement after sweeping internal sell-side liquidity, establishing an ICT bullish continuation structure. Price is now drawing toward the next buy-side liquidity pool at the target zone. Time Frame 5H.
LONG🚀
✅Like and subscribe to never miss a new idea!✅

USD-JPY Demand Below! Buy!
Hello,Traders!
USDJPY is pulling back into a horizontal demand area after clearing short-term sell-side liquidity, forming an SMC accumulation setup that favors a rebound toward the next buy-side target above. Time Frame 2H.
Buy!
Comment and subscribe to help us grow!
Check out other forecasts below too!
Disclosure: I am part of Trade Nation's Influencer program and receive a monthly fee for using their TradingView charts in my analysis.

GBP/USD: Institutions Accumulate, USD Weakens – Key PullbackMacro Context and USD Index (DXY) – Neutral/Weak USD Bias
The COT report on the Dollar Index shows a configuration that suggests sustained bearish pressure on the USD:
Non-commercial traders are adding both long positions (+6,038) and short positions (+5,474), but the overall structure remains clearly short-dominant (32,207 shorts vs. 16,645 longs).
Commercials significantly increase their USD long exposure (+1,188), though their activity typically reflects hedging rather than a directional view.
Open interest rises sharply, signaling renewed institutional participation on the sell side of USD.
In summary, net pressure remains bearish on the USD, a condition that favors upside continuation in GBP/USD.
COT on the British Pound (GBP) – Clear Improvement in Institutional Sentiment
The GBP report is far more revealing:
Non-commercials aggressively cut long exposure (–19,354) while sharply increasing shorts (+15,403).
However, commercials substantially increase their GBP long exposure (+40,231) while reducing short exposure (+504).
This dynamic is typical of market turning points:
When non-commercials rapidly reduce longs and add shorts, it often represents short-term emotional selling.
Commercials, meanwhile, accumulate heavily, suggesting that current price levels are perceived as attractive value zones.
Interpretation:
GBP is likely entering a structural accumulation phase.
Combined with USD weakness → this supports a moderately bullish medium-term bias on GBP/USD.
Retail Sentiment – Contrarian Confirmation of Potential Upside
Retail short: 56%
Retail long: 44%
Retail positioning is predominantly short → classic contrarian signal → reinforces a bullish scenario for GBP/USD.
Seasonality – December Historically Bullish
December typically shows positive seasonal behavior, especially across the 5-year and 2-year curves.
The 10-year curve is slightly bullish as well; only the 20-year curve is mostly neutral.
Interpretation: December tends to favor accumulation and upward extensions, particularly in the second half of the month.
Price Action & Key Levels
Price recently bounced from the ascending channel highlighted in green.
A strong bullish impulse candle broke previous micro-structure, and the pair is now undergoing a technical pullback.
The blue zone (1.3160–1.3230) represents the major daily demand area that initiated the latest rally.
Primary Scenario (Bullish – Higher Probability):
A retracement toward 1.3240–1.3260 is expected, aligning with a retest of the ascending trendline.
From this region, a bullish continuation toward:
• 1.3420 (first supply zone)
• 1.3550 (intermediate liquidity pocket)
• 1.3600–1.3650 (macro supply and seasonal target)
The daily RSI remains neutral, with no signs of exhaustion, leaving ample room for further upside.

BTCUSDT.P - December 10, 2025Price is pulling back from a sharp spike into resistance around 94,400–94,800 and is currently retesting the rising trendline that has defined the recent upswing. A defended higher low above this trendline and a push back through 92,900–93,000 would keep the short-term uptrend intact and favor continuation toward the prior highs. A clean break below the trendline with follow-through toward 90,300–90,100 would signal weakening momentum and raise the risk of a deeper correction toward the prior consolidation lows.

EURJPY Will Go Lower From Resistance! Sell!
Here is our detailed technical review for EURJPY.
Time Frame: 4h
Current Trend: Bearish
Sentiment: Overbought (based on 7-period RSI)
Forecast: Bearish
The market is trading around a solid horizontal structure 182.247.
The above observations make me that the market will inevitably achieve 181.125 level.
P.S
We determine oversold/overbought condition with RSI indicator.
When it drops below 30 - the market is considered to be oversold.
When it bounces above 70 - the market is considered to be overbought.
Like and subscribe and comment my ideas if you enjoy them!

GOLD Will Go Higher! Buy!
Take a look at our analysis for GOLD.
Time Frame: 1h
Current Trend: Bullish
Sentiment: Oversold (based on 7-period RSI)
Forecast: Bullish
The market is testing a major horizontal structure 4,201.56.
Taking into consideration the structure & trend analysis, I believe that the market will reach 4,215.52 level soon.
P.S
Overbought describes a period of time where there has been a significant and consistent upward move in price over a period of time without much pullback.
Like and subscribe and comment my ideas if you enjoy them!

AUDCAD Will Go Down! Sell!
Take a look at our analysis for AUDCAD.
Time Frame: 4h
Current Trend: Bearish
Sentiment: Overbought (based on 7-period RSI)
Forecast: Bearish
The market is testing a major horizontal structure 0.924.
Taking into consideration the structure & trend analysis, I believe that the market will reach 0.918 level soon.
P.S
The term oversold refers to a condition where an asset has traded lower in price and has the potential for a price bounce.
Overbought refers to market scenarios where the instrument is traded considerably higher than its fair value. Overvaluation is caused by market sentiments when there is positive news.
Like and subscribe and comment my ideas if you enjoy them!

TESLA Is December seasonality about to hit it hard?Tesla (TSLA) has been trading within a 3-year Channel Up and has been on a Bullish Leg since the April 07 market low. Not everything on its long-term outlook is positive though as December in the past 5 years, holds a bearish seasonality for the stock as it has aggressively declined.
A 1W MACD Bearish Cross was always present during these times and so is today. With the price trading under a familiar Lower Highs trend-line as in 2023, we see strong probabilities that Tesla starts a new long-term correction. The minimum drop on these corrections has been -50% so a repeat of that would put the price exactly at the bottom of the Channel Up at $236, with only the 1M MA100 (red trend-line) in support.
---
** Please LIKE 👍, FOLLOW ✅, SHARE 🙌 and COMMENT ✍ if you enjoy this idea! Also share your ideas and charts in the comments section below! This is best way to keep it relevant, support us, keep the content here free and allow the idea to reach as many people as possible. **
---
💸💸💸💸💸💸
👇 👇 👇 👇 👇 👇

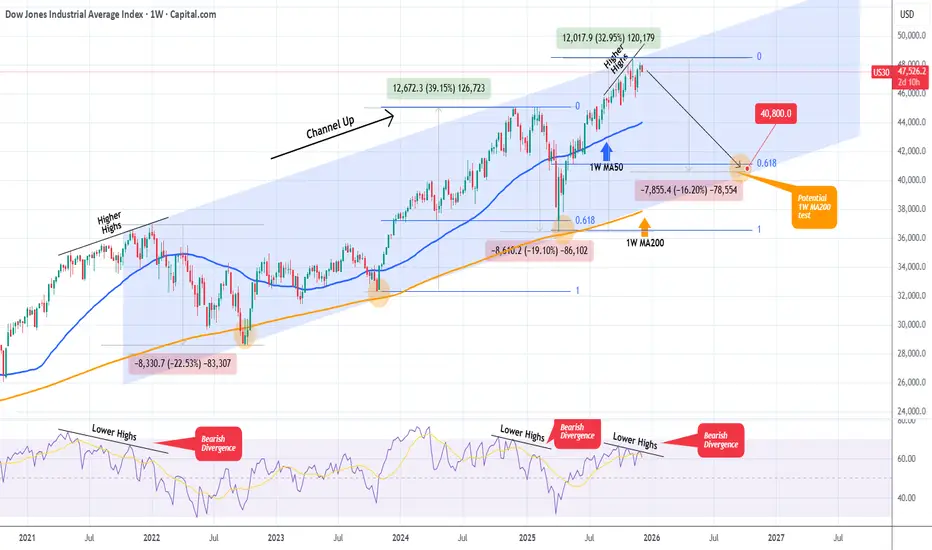
DOW JONES Is it starting a new Bear Cycle towards 40800?Dow Jones (DJI) has been trading within a 4-year Channel Up since the start of the 2022 Inflation Crisis. One month ago it hit the top of this pattern and hasn't made a new High since.
This is increasingly alarming as the 1W RSI is on a Bearish Divergence under Lower Highs against the market's Higher Highs. Every time this took place within this pattern, the index corrected heavily and attempted a 1W MA200 (orange trend-line) test.
As a result, if Dow fails to make a new High, we expect the bearish sentiment to intensify and start a new Bear Cycle (Bearish Leg for the Channel Up) towards its 1W MA200 and the 0.618 Fibonacci retracement level, which was the Target of the previous correction. Based on that it is possible for the index to hit 40800 at the bottom of the Channel Up.
---
** Please LIKE 👍, FOLLOW ✅, SHARE 🙌 and COMMENT ✍ if you enjoy this idea! Also share your ideas and charts in the comments section below! This is best way to keep it relevant, support us, keep the content here free and allow the idea to reach as many people as possible. **
---
💸💸💸💸💸💸
👇 👇 👇 👇 👇 👇
AVAXUSD 2-year Channel Down starting a rally to $20?Avalanche (AVAXUSD) has been trading within a 2-year Channel Down which made a Lower Low bottom 3 weeks ago. The price has since then traded sideways, potentially in an attempt to price a technical Support base.
If the market doesn't break below this, there are high probabilities to see this pattern initiating a new Bullish Leg. The previous two Bullish Legs showed a declining rate on their rallies with the first hitting the 0.786 Fibonacci level but the second being only able to hit the 0.618 Fib.
If this decreasing rate continues, we shouldn't go much further than the 0.5 Fib this time. With the 1W MA50 (blue trend-line) and the 1M MA50 (red trend-line) posing as the two main Resistance levels of this Bear Cycle, we place our Target below at $20.000.
---
** Please LIKE 👍, FOLLOW ✅, SHARE 🙌 and COMMENT ✍ if you enjoy this idea! Also share your ideas and charts in the comments section below! This is best way to keep it relevant, support us, keep the content here free and allow the idea to reach as many people as possible. **
---
💸💸💸💸💸💸
👇 👇 👇 👇 👇 👇

NZDUSD Will Move Lower! Sell!
Here is our detailed technical review for NZDUSD.
Time Frame: 1h
Current Trend: Bearish
Sentiment: Overbought (based on 7-period RSI)
Forecast: Bearish
The market is approaching a significant resistance area 0.578.
Due to the fact that we see a positive bearish reaction from the underlined area, I strongly believe that sellers will manage to push the price all the way down to 0.577 level.
P.S
The term oversold refers to a condition where an asset has traded lower in price and has the potential for a price bounce.
Overbought refers to market scenarios where the instrument is traded considerably higher than its fair value. Overvaluation is caused by market sentiments when there is positive news.
Like and subscribe and comment my ideas if you enjoy them!

EURUSD Will Go Down! Short!
Please, check our technical outlook for EURUSD.
Time Frame: 4h
Current Trend: Bearish
Sentiment: Overbought (based on 7-period RSI)
Forecast: Bearish
The market is approaching a key horizontal level 1.163.
Considering the today's price action, probabilities will be high to see a movement to 1.160.
P.S
Please, note that an oversold/overbought condition can last for a long time, and therefore being oversold/overbought doesn't mean a price rally will come soon, or at all.
Like and subscribe and comment my ideas if you enjoy them!

Lingrid | USDCHF Compressed Range Creates Bullish SetupFX:USDCHF remains supported inside ascending structure, with price holding above the trendline after completing a healthy pullback. The previous impulsive leg produced a clear higher high, and current consolidation near the 0.8050 swap zone suggests buyers are absorbing supply rather than distributing. Compression under resistance signals growing upside pressure.
As long as price respects the trendline and holds above 0.8050, the bullish setup stays valid. A clean push higher opens the door for a continuation toward the 0.8090 resistance area, aligned with the recent higher high.
➡️ Primary scenario: hold above 0.8050 → continuation toward 0.8090
⚠️ Risk scenario: breakdown below the trendline invalidates the bullish setup
If this idea resonates with you or you have your own opinion, traders, hit the comments. I’m excited to read your thoughts!

Lingrid | TRXUSDT Flag Pattern Breakdown Continuation SetupBINANCE:TRXUSDT perfectly played out my previous trading idea . Price lost its bullish continuation after price slipped below the trendline and failed to hold the flag structure. The recent lower high confirms weakening demand, while the break beneath the mid-range support signals a transition from corrective pullback into renewed downside pressure. Momentum now favors sellers, with price struggling to reclaim the broken structure.
The current reaction zone around 0.283–0.285 acts as pivotal resistance. As long as price remains capped below this level, downside rotation toward the 0.270 support area looks increasingly likely. That zone aligns with prior demand and the lower boundary of the broader structure, making it the next technical magnet.
➡️ Primary scenario: rejection below 0.285 → continuation down toward 0.270
⚠️ Risk scenario: sustained reclaim above the trendline revives upside attempts toward 0.300
If this idea resonates with you or you have your own opinion, traders, hit the comments. I’m excited to read your thoughts!

DOGECOIN markup ... ICC He is an example of bearish icc markup on dogecoin
Indication, correction, contination - icc shout to tradesbysci
Trade responsibly good luck

SILVER (XAGUSD) – Short-Term DangerOn Monday, I highlighted something important in my Silver analysis: after a full week of rectangle consolidation, the most probable scenario was an upside break — with a projected target around 61.
I also repeated a point I’ve been making for weeks: Silver continues to look stronger than Gold.
Fast-forward to now:
🔹 That 61 target has been reached
🔹 Silver rallied more than 3,000 pips from the bottom to the high yesterday
🔹 The broader bullish trend is not in question
Let me be very clear: this post is not about denying the bullish structure.
The trend is intact, momentum is real, and a new ATH is absolutely possible.
⚠️ The Warning: A Short-Term Drop Is Becoming Likely
This is a timing post, not a trend post.
If you are a short-term trader and not already long, entering here is pure FOMO — and extremely risky.
Why? Because the market just moved 13,000 pips in 20 days. That is not sustainable without a reset.
Technically, the structure is stretched, and the probability of a corrective move is increasing.
📉 Levels to Watch for a Pullback
- 59 – my base expectation for the next corrective wave
- 55 – not my primary scenario, but absolutely possible considering the size of the latest rally
Neither scenario breaks the bullish trend. These would simply be healthy retracements inside the larger upward trajectory.
📌 Final Thoughts
The trend is bullish.
The long-term outlook is strong.
But the entry right now is terrible unless you're already positioned.
Stay disciplined. Wait for the market to reset.
Silver will offer better opportunities — don’t let FOMO make the decision for you!
