WTI OIL 4H Channel Down aiming for a Lower Low.WTI Oil (USOIL) is extending the 1D MA50 (red trend-line) rejection of October 24 and has formed a short-term Channel Down. We are currently on its second Bearish Leg following a new rejection this time on the 4H MA200 (orange trend-line).
With the first Bearish Leg declining by -4.72%, we expect the current one to replicate this drop and target $58.60.
-------------------------------------------------------------------------------
** Please LIKE 👍, FOLLOW ✅, SHARE 🙌 and COMMENT ✍ if you enjoy this idea! Also share your ideas and charts in the comments section below! This is best way to keep it relevant, support us, keep the content here free and allow the idea to reach as many people as possible. **
-------------------------------------------------------------------------------
💸💸💸💸💸💸
👇 👇 👇 👇 👇 👇
Signals

$ACRS, Long, TP>40%NASDAQ:ACRS , Long, TP>40%
For short-term trading, this stock is interesting.
Choose an entry point and do not forget about a protective order if you are trading with leverage.
Don't risk it if you're not sure.
Good luck to everyone.

DOW JONES recovered and is looking for a High at 48500.Exactly 2 weeks ago (October 22, see chart below), we gave a strong Buy Signal on Dow Jones (DJI), as the index had already initiated the new Bullish Leg of its 6-month Channel Up and quickly hit our 47700 Target:
That trading plan included a 2nd Target as well at 48500, which represented a +7.50% rise from the October 10 Low, which was a Higher Low for the Channel Up on its 1D MA50 (blue trend-line).
As Target 1 was on the 1.382 Fibonacci extension, the recent pull-back was technically expected as the sequence was similar to those of August 22 - September 02 among others. As you can see, all minor pull-backs that took place within this Channel Up, hit the 4H MA100 (red trend-line) and rebounded. Major ones found support lower on the 1D MA50, as did the October 10 Low.
Since the index hit yesterday its 4H MA100 and is rebounding today, the Bullish Leg remains valid and on the medium-term can reach our final 48500 Target.
-------------------------------------------------------------------------------
** Please LIKE 👍, FOLLOW ✅, SHARE 🙌 and COMMENT ✍ if you enjoy this idea! Also share your ideas and charts in the comments section below! This is best way to keep it relevant, support us, keep the content here free and allow the idea to reach as many people as possible. **
-------------------------------------------------------------------------------
💸💸💸💸💸💸
👇 👇 👇 👇 👇 👇

$DYAI, Long, TP>40%NASDAQ:DYAI , Long, TP>40%
For short-term trading, this stock is interesting.
Choose an entry point and do not forget about a protective order if you are trading with leverage.
Don't risk it if you're not sure.
Good luck to everyone.

BTCUSDT.P - November 6, 2025BTCUSDT.P is currently in a tight range; an intramonth setup is identified with a long entry above 105,352 targeting 121,579, and a short entry below 94226 targeting 85100, depending on which breakout confirms first.

DOGEUSDT.P - November 6, 2025A breakout and close above resistance could confirm bullish momentum toward higher levels, while a rejection or drop below the ascending trendline and support may indicate a bearish reversal—trade based on how price reacts at these critical zones.

BNBUSDT.P - November 6, 2025A breakout and sustained close above resistance could confirm bullish continuation toward higher highs, while a rejection or breakdown below the ascending trendline and support may trigger a bearish move—trade according to how price reacts at these key levels.

ETHUSDT.P - November 6, 2025ETHUSDT.P is attempting a short-term bullish reversal following a rebound from the $3,274.06–$3,244.47 support zone. A buy limit is positioned near $3,339.11, targeting a move toward the $3,493.78 partial profit zone and the $3,548.75 profit level.
A sustained break above $3,493.78 would confirm bullish continuation, while a drop below $3,274.06 invalidates the setup.
Risk Assessment: Moderate — price structure favors buyers, but confirmation above resistance is required before momentum can strengthen.

USOIL LOCAL LONG|
✅WTI OIL is expected to bounce from the demand level near $60.00, targeting the $60.70 resistance zone as bullish momentum builds. Time Frame 3H.
LONG🚀
✅Like and subscribe to never miss a new idea!✅

4050 or 3905 ?🗒️By examining the gold chart on the 2-hour time frame,
📊you can see that the price managed to reach the 3929 range by breaking the support of 3971;
After reaching this range, buyers got to work and gold is currently trading in the 3975 range.
🔻Given the overall market trend, I expect more declines in gold in the 3947 and 3905 ranges;
💬If the resistance at 4002 is broken, we can expect gold to grow to the 4050 range;
-
-
🗒️با بررسی نمودار طلا در تایم فریم ۲ ساعته،
📊مشاهده میکنید که قیمت با شکستن حمایت ۳۹۷۱ توانسته به محدوده ۳۹۲۹ برسد؛
پس از رسیدن به این محدوده، خریداران دست به کار شدند و طلا در حال حاضر در محدوده ۳۹۷۵ معامله میشود.
🔻با توجه به روند کلی بازار، انتظار کاهش بیشتر طلا در محدودههای ۳۹۴۷ و ۳۹۰۵ را دارم؛
💬اگر مقاومت ۴۰۰۲ شکسته شود، میتوان انتظار رشد طلا تا محدوده ۴۰۵۰ را داشت؛
💭CONTACT ME : @aghayeshademani

EUR-AUD Local Short! Sell!
Hello,Traders!
EURAUD Price rejected the horizontal supply area, confirming bearish pressure. A continuation toward 1.7650 target is expected as liquidity below recent lows attracts price. Time Frame 3H.
Sell!
Comment and subscribe to help us grow!
Check out other forecasts below too!
Disclosure: I am part of Trade Nation's Influencer program and receive a monthly fee for using their TradingView charts in my analysis.

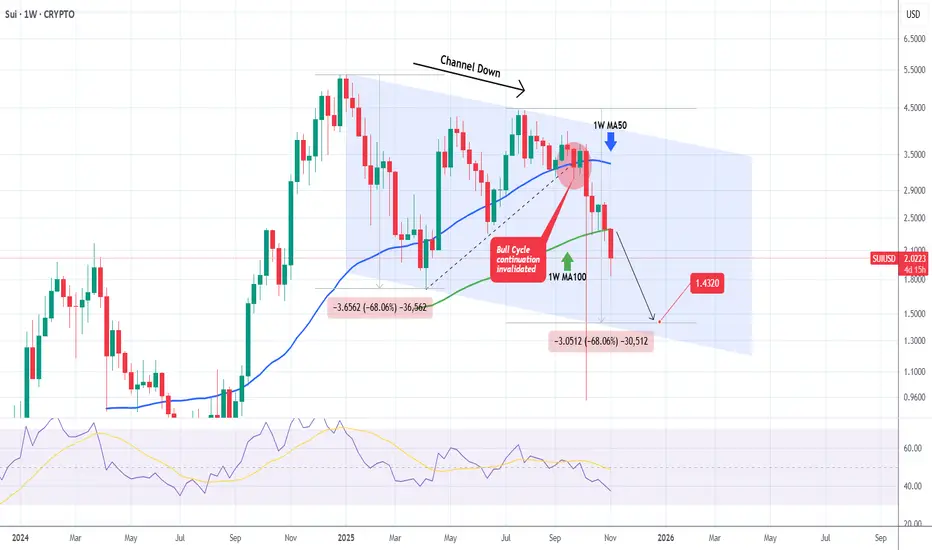
SUIUSD Channel Down to accelerate more selling towards 1.4320.Sui (SUIUSD) has established a Channel Down on the 1W time-frame, trading under Lower Highs since the December 30 2024 High. The Bull Cycle got invalidated on September 22 2025 when the price broke below the inner Higher Lows trend-line (dashed) and this week may confirm the new Bear Cycle as it will most likely close a 1W candle below the 1W MA100 (green trend-line).
We expect the current decline to repeat at least the -68.06% drop of the first Bearish Leg of the pattern and targe 1.4320.
-------------------------------------------------------------------------------
** Please LIKE 👍, FOLLOW ✅, SHARE 🙌 and COMMENT ✍ if you enjoy this idea! Also share your ideas and charts in the comments section below! This is best way to keep it relevant, support us, keep the content here free and allow the idea to reach as many people as possible. **
-------------------------------------------------------------------------------
💸💸💸💸💸💸
👇 👇 👇 👇 👇 👇
Lingrid | GOLD Trend Continuation Pattern FormedOANDA:XAUUSD continues consolidating inside a broad descending channel after a failed attempt to break above 4050 resistance. Price action shows multiple rejections from the upper boundary while forming lower highs — a signal that sellers remain active. The focus now shifts toward the 3900 level as the next downside test, with a possible rebound near this zone before further direction develops. Momentum remains neutral-to-bearish unless bulls reclaim the 4060–4080 range.
⚠️ Risks:
Strong U.S. employment data this week could boost USD strength and extend downside pressure.
Rising Treasury yields may suppress gold’s short-term recovery potential.
Unexpected geopolitical tensions could trigger safe-haven inflows, distorting the bearish setup.
If this idea resonates with you or you have your own opinion, traders, hit the comments. I’m excited to read your thoughts!

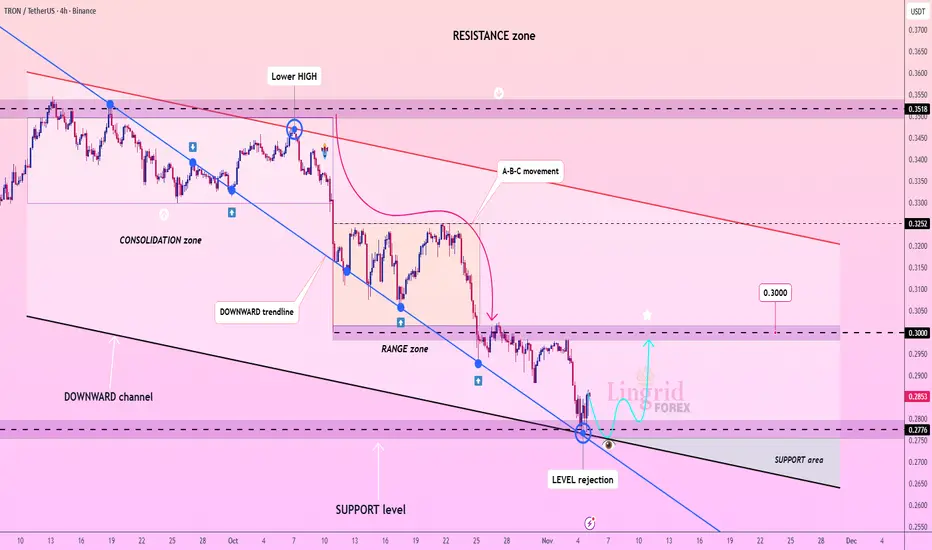
Lingrid | TRXUSDT Correction Rally Following DropThe price perfectly fulfilled my previous idea . BINANCE:TRXUSDT is showing early signs of reversal after rejecting the support level near 0.2770. Price action remains within a clear downward channel, but buyers have managed to defend the lower boundary, creating a possible short-term rebound setup. A sustained move above 0.2900 could open a path toward the 0.3000 resistance zone, where sellers are expected to return. This structure hints at a corrective phase before the broader bearish trend resumes.
⚠️ Risks:
Stronger-than-expected U.S. job data or inflation could boost the USD and pressure TRX lower.
Bitcoin volatility spikes may undermine altcoin recovery momentum.
Failure to hold the 0.2770 level could invalidate the short-term rebound setup.
If this idea resonates with you or you have your own opinion, traders, hit the comments. I’m excited to read your thoughts!
XAUUSD: Tension Builds as the Market Awaits DirectionWhat’s really happening here?
If you take a close look at today’s XAUUSD chart, you’ll notice a very dramatic picture: gold prices are being tightly compressed inside a converging triangle pattern.
This is a classic formation that reflects the battle between two market forces:
- Buyers are forming higher lows, showing increasing buying pressure.
- Sellers, on the other hand, continue to hold lower highs, consistently blocking every upward attempt.
As these two trendlines move closer together, the market becomes like a compressed spring; the longer it’s squeezed, the stronger the move will be once it’s released.
So, what does this mean?
In my view, it shows that gold is currently in a highly sensitive accumulation phase, and any breakout could trigger a major move in a new direction.
- If the price breaks above the 4,020 – 4,030 USD resistance zone, it could be the first signal of a new bullish wave targeting 4,070 – 4,100 USD.
- Conversely, if it breaks below the 3,960 USD support, a bearish scenario will likely unfold, pulling the price back toward 3,910 – 3,880 USD.
🔹 How to identify a real breakout (my way):
- Wait for confirmation with a strong closing candle and high volume.
- A successful retest of the broken zone (which now switches roles: resistance → support or vice versa) will serve as a “golden certificate” for a sustainable breakout.
- And remember, false breakouts often occur right before the market truly explodes.
🔹 Risk factors (from my perspective):
- If gold breaks the boundary without volume or with long-wicked candles, it could simply be a trap set by major players.
- Once the price falls back inside the triangle after a breakout, the entire structure becomes invalid.
✅ Conclusion (in my view):
- Gold (XAUUSD) is now in the “calm before the storm” phase.
- Buyers are quietly accumulating near support areas, while sellers defend the last line of resistance.
- A clear and confirmed breakout in either direction could set the stage for a big move this week.
Stay disciplined:
- Wait for breakout + confirmation + retest; that’s how you stay on the right side of the market and avoid false signals.
This is not financial advice, just my personal view of today’s chart — my way.
Trade safely and patiently, because sometimes doing nothing is also a strategy.

USDJPY Is Going Down! Short!
Take a look at our analysis for USDJPY.
Time Frame: 1D
Current Trend: Bearish
Sentiment: Overbought (based on 7-period RSI)
Forecast: Bearish
The price is testing a key resistance 153.489.
Taking into consideration the current market trend & overbought RSI, chances will be high to see a bearish movement to the downside at least to 149.764 level.
P.S
Please, note that an oversold/overbought condition can last for a long time, and therefore being oversold/overbought doesn't mean a price rally will come soon, or at all.
Like and subscribe and comment my ideas if you enjoy them!

GBPUSD Will Fall! Sell!
Please, check our technical outlook for GBPUSD.
Time Frame: 1D
Current Trend: Bearish
Sentiment: Overbought (based on 7-period RSI)
Forecast: Bearish
The market is trading around a solid horizontal structure 1.302.
The above observations make me that the market will inevitably achieve 1.280 level.
P.S
The term oversold refers to a condition where an asset has traded lower in price and has the potential for a price bounce.
Overbought refers to market scenarios where the instrument is traded considerably higher than its fair value. Overvaluation is caused by market sentiments when there is positive news.
Like and subscribe and comment my ideas if you enjoy them!

EURJPY Will Go Down From Resistance! Short!
Here is our detailed technical review for EURJPY.
Time Frame: 1h
Current Trend: Bearish
Sentiment: Overbought (based on 7-period RSI)
Forecast: Bearish
The market is testing a major horizontal structure 176.410.
Taking into consideration the structure & trend analysis, I believe that the market will reach 175.373 level soon.
P.S
We determine oversold/overbought condition with RSI indicator.
When it drops below 30 - the market is considered to be oversold.
When it bounces above 70 - the market is considered to be overbought.
Like and subscribe and comment my ideas if you enjoy them!

NZDJPY Will Move Lower! Sell!
Here is our detailed technical review for NZDJPY.
Time Frame: 1h
Current Trend: Bearish
Sentiment: Overbought (based on 7-period RSI)
Forecast: Bearish
The market is on a crucial zone of supply 87.148.
The above-mentioned technicals clearly indicate the dominance of sellers on the market. I recommend shorting the instrument, aiming at 86.732 level.
P.S
The term oversold refers to a condition where an asset has traded lower in price and has the potential for a price bounce.
Overbought refers to market scenarios where the instrument is traded considerably higher than its fair value. Overvaluation is caused by market sentiments when there is positive news.
Like and subscribe and comment my ideas if you enjoy them!

Another Volatile Day for Gold: Is the Next Leg Down Loading?Yesterday was just another volatile session for Gold...
After testing the waters above $4,000, price reversed sharply during the New York session, dropping to around $3,930.
A brief consolidation followed, and by the time of writing, Gold already rebounded toward $3,970, reclaiming the $3,960 support area.
Despite this recovery, the overall structure remains bearish — as long as price fails to stabilize above $4,000, sellers maintain control.
📉 Outlook:
I continue to expect another leg down, with $3,915 as my next focus, followed by the recent low around $3,885.

GBPUSD: Bearish Structure Points to 1.3000 NextAround two weeks ago, I mentioned that GBPUSD could fall toward the 1.32 support, and indeed, the pair reached that level on Wednesday.
Since then, GBPUSD even broke below 1.32 and is now trading around 1.3140, raising the big question — will it fall further to test 1.3000?
In my view, yes, it will.
The structure remains bearish, and since mid-September, every rally has been sold into, forming a clear lower highs – lower lows pattern.
So, in conclusion, rallies above 1.32 should be sold, with a target at 1.3000, as mentioned earlier. 🚀

Ethereum Recovery Stalls — $3K Retest on the Horizon?After the flash crash on October 10th, ETH recovered quite well — but as mentioned at that time, for a full recovery and return to a bullish tone, the price needed to reclaim the $4,300 resistance.
That never happened...
After a second attempt on Monday, the price is now back below $4,000, testing the recent short-term support zone.
Looking at the broader structure since early August, the market has turned decisively bearish, showing two clear phases of distribution.
As previously noted, the price continues to press against the confluence support, and I expect a breakdown to occur soon.
If that happens, ETH could fall toward the $3,000 area to retest the major support level that dates back to 2024.

BTC Analysis — Support or Trap? The 106–107k Zone Under PressureIn my previous BTC analysis — right before the flash crash — I mentioned that I was struggling to maintain my bullish stance, and that only a break back above 118k would restore confidence. In fact, I leaned toward a bearish bias, and the recent price action has confirmed those concerns.
The market has repeatedly failed to reclaim the 118k zone, continuing to drift lower toward 106–107k support.
As I’ve explained multiple times, when I see this kind of movement — price coming back to the same support again and again — it’s hard to believe that the market is doing it so we can all buy and profit.
Usually, this pattern acts as a trap, luring in buyers before a final breakdown.
That’s the scenario I’m watching once again.
Technical Levels:
- Resistance: 118k (major cap)
- Support: 106–107k (key zone)
- Interim level: 100k (psychological)
- Target on breakdown: 90k
My selling zone is between 113–115k, as I expect any bounce into this area to meet renewed selling pressure.
