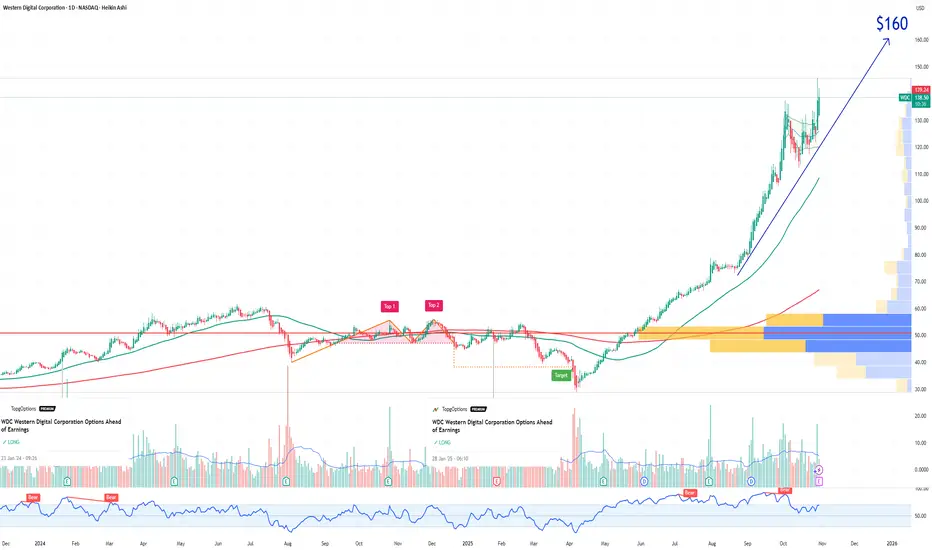
WDC Western Digital Corporation Options Ahead of EarningsIf you haven`t bought WDC before the rally:
Now analyzing the options chain and the chart patterns of WDC Western Digital Corporation prior to the earnings report this week,
I would consider purchasing the 160usd strike price Calls with
an expiration date of 2025-11-21,
for a premium of approximately $4.35.
If these options prove to be profitable prior to the earnings release, I would sell at least half of them.
Signals
NZD-USD Bearish Breakout! Sell!
Hello,Traders!
NZDUSD broke below its bearish flag pattern, confirming a potential continuation to the downside. The next liquidity target sits near the lower support zone. Time Frame 4H.
Sell!
Comment and subscribe to help us grow!
Check out other forecasts below too!
Disclosure: I am part of Trade Nation's Influencer program and receive a monthly fee for using their TradingView charts in my analysis.

US10Y This break-out can be the next Buy Signal.The U.S. Government Bonds 10YR Yield (US10Y) has been trading within a long-term Triangle pattern and more recently since May 22 2025 it has found itself declining inside a Channel Down.
This Bearish Leg (Channel Down) almost hit the bottom of the Triangle and has been rebounding in the past 10 days. As long as the 1W MA200 (orange trend-line) holds (right now almost at the bottom of the Triangle), the probabilities of a rebound and new Bullish Leg remain strong.
The confirmation for such Bullish Leg will come after the price closes a 1D candle above the 1D MA50 (blue trend-line). If it does, we an expect the price to rise to at least the 0.786 Fibonacci retracement level (Target 4.475%), which has happened all times (3) inside this Triangle after a Bearish Leg bottomed.
-------------------------------------------------------------------------------
** Please LIKE 👍, FOLLOW ✅, SHARE 🙌 and COMMENT ✍ if you enjoy this idea! Also share your ideas and charts in the comments section below! This is best way to keep it relevant, support us, keep the content here free and allow the idea to reach as many people as possible. **
-------------------------------------------------------------------------------
💸💸💸💸💸💸
👇 👇 👇 👇 👇 👇

DXY has started a new long-term Bullish Leg to 103.500.Four months ago (June 26, see chart below) we gave a strong Buy Signal on the U.S. Dollar Index (DXY), which in a month's time it hit our 100.000 Target:
Now we see the 3-year Channel Down starting the next Bullish Leg having priced its bottom (Lower Low) on September 17. As you can see this is almost the exact same triple Lower Lows bottoming process as in 2023, using also the same Fibonacci retracement levels as Targets. We have the huge 1W RSI Bullish Divergence to also confirm this.
Based on this symmetry, we have started a Bullish Leg similar to July's 2023. That peaked marginally below the 0.5 Fibonacci level. As a result, we expect DXY to target at least 103.500 by early 2026.
-------------------------------------------------------------------------------
** Please LIKE 👍, FOLLOW ✅, SHARE 🙌 and COMMENT ✍ if you enjoy this idea! Also share your ideas and charts in the comments section below! This is best way to keep it relevant, support us, keep the content here free and allow the idea to reach as many people as possible. **
-------------------------------------------------------------------------------
💸💸💸💸💸💸
👇 👇 👇 👇 👇 👇

TAOUSDT.P - October 30, 2025TAOUSDT.P is forming a potential lower high structure near the $449–$460 resistance zone, indicating weakening bullish momentum after a corrective rally. The planned short entry aligns with a bearish continuation setup targeting $408, with invalidation above $482 suggesting a clear risk-defined trade. Overall, this is a medium-risk setup given the proximity to resistance and the need for confirmation of rejection before entry.

Lingrid | EURUSD Potential Bearish Momentum From Resistance ZoneThe price perfectly fulfilled my previous idea . FX:EURUSD is hovering just below the descending trendline after multiple failed attempts to reclaim resistance, showing clear weakness near 1.16675. The pair remains confined within a broad descending channel structure, with sellers defending each rally toward the upper boundary. A breakdown below 1.1600 could trigger renewed pressure toward 1.15400 and possibly the 1.151 handle if downside momentum accelerates. Broader sentiment favors continuation of the bearish leg as long as price remains capped below 1.16970 and the macro backdrop supports USD strength.
⚠️ Risks:
A dovish tone from the upcoming Federal Funds Rate decision on Thursday could weaken the USD and spark a bullish reversal.
Short-term oversold conditions may lead to a corrective bounce toward 1.16675.
Unexpected positive Eurozone data could offset bearish technicals and limit downside potential.
If this idea resonates with you or you have your own opinion, traders, hit the comments. I’m excited to read your thoughts!

ROCKET LAB has topped. Sell signal on Bearish Divergence.Last time we took a look at Rocket Lab (RKLB) was more than 5 months ago (May 12, see chart below) where we gave a Buy Signal exactly on the 1D MA50 and the price instantly reacted with a rebound, easily hitting our $32.00 Target:
This time we are getting a Sell Signal on the chart as despite the stock's Higher Highs, its 1D RSI has been trading under Higher Lows since July 17, exhibiting a Bearish Divergence. The last similar Bearish Divergence was seen on January 24 2025, which was RKLB's previous Channel Up Top.
That signal triggered a correction that extended all the way back to the 0.382 Fibonacci retracement level and hit the 1D MA200 (orange trend-line) before bottoming. As a result, we are now turning bearish on Rocket Lab, targeting $40.00 (Fib 0.382).
-------------------------------------------------------------------------------
** Please LIKE 👍, FOLLOW ✅, SHARE 🙌 and COMMENT ✍ if you enjoy this idea! Also share your ideas and charts in the comments section below! This is best way to keep it relevant, support us, keep the content here free and allow the idea to reach as many people as possible. **
-------------------------------------------------------------------------------
💸💸💸💸💸💸
👇 👇 👇 👇 👇 👇

XAU/USD: Holding Channel Support as Bulls Regain MomentumXAU/USD has rebounded from the lower boundary of the upward channel, holding above the $3,900 support level and maintaining its bullish structure. A higher low has formed following a wedge correction, suggesting renewed buying pressure.
A sustained move above the $3,905–$3,950 zone could open the path toward $4,135. Momentum remains positive, with buyers continuing to defend key support within the broader ascending trend.

GOLD Will Go Up From Support! Buy!
Here is our detailed technical review for GOLD.
Time Frame: 2h
Current Trend: Bullish
Sentiment: Oversold (based on 7-period RSI)
Forecast: Bullish
The market is testing a major horizontal structure 3,985.10.
Taking into consideration the structure & trend analysis, I believe that the market will reach 4,051.12 level soon.
P.S
Please, note that an oversold/overbought condition can last for a long time, and therefore being oversold/overbought doesn't mean a price rally will come soon, or at all.
Like and subscribe and comment my ideas if you enjoy them!

BITCOIN Has this huge Bearish Divergence started the Bear Cycle?Bitcoin (BTCUSD) continues to be under heavy pressure in the past 4 weeks since the October 06 All Time High (ATH) and finds itself battling to hold the 1W MA50 (blue trend-line) as Support. That trend-line has been basically the Support of this Bull Cycle since March 2023, and acted as the most optimal long-term buy level.
** Has the Bull Cycle ended? **
However this Bull Cycle may have very well come to an end already as the 1W RSI has been long exhibiting the same kind of bearish pattern (Lower Highs trend-line), while also having completed the 4-year Cycle, that all previous Bull Cycles formed on their respective tops. This is a huge Bearish Divergence formation as it goes against the price's Higher Highs, indicating trend exhaustion.
As you can see that 1 RSI Lower Highs trend-line formed the November 2021, December 2017 and December 2013 Cycle Tops. Even worse, the current Lower Highs trend-line has been going on since the March 11 2024 High. If BTC closes a 1W candle below its 1W MA50, it has greater probabilities to confirm the start of the new Bear Cycle as all previous ones did on such break-out.
** If yes, how much can it drop? **
Now, it might not be too relevant at this time yet, but as far as how low the Bear Cycle can go to before it bottoms, there are three potential levels of interest where long-term investors can Dollar Cost Average (DCA).
The January 2015 Bear Cycle bottom was formed on the 1W MA200 (orange trend-line). Then the December 2018 Bear Cycle bottom was formed on the 1W MA200 and the 0.382 Fibonacci retracement level from the previous bottom. The last Bear Cycle has its bottom below the 1W MA200 and on the next Fib in line, the 0.5 level. The decline on each Bear Cycle that followed decelerated and was less than the previous (-86.70% to -84.19% to -77.22%).
If the new Bear Cycle has already started then the first level for a potential bottom is again the 0.382 Fib around $58000 where contact may potentially be made with the 1W MA200 as well. If it follows the previous Bear Cycle and bottoms on the 0.5 Fib, it will also be below the 1W MA200 around $45000. If on the other hand it goes a Fib level further, as the last two Cycles did, we are looking at the 0.618 Fib as a potential strong bottom candidate around $35000. That will also be a -70.76% decline from the Top, which will be -7% less than the previous Bear Cycle, which is also the difference that the 2022 Bear Cycle had from the 2018 one.
So what do you think? Has the Bull Cycle ended already and if yes, how low can the new Bear Cycle go? Feel free to let us know in the comments section below!
-------------------------------------------------------------------------------
** Please LIKE 👍, FOLLOW ✅, SHARE 🙌 and COMMENT ✍ if you enjoy this idea! Also share your ideas and charts in the comments section below! This is best way to keep it relevant, support us, keep the content here free and allow the idea to reach as many people as possible. **
-------------------------------------------------------------------------------
💸💸💸💸💸💸
👇 👇 👇 👇 👇 👇

GBPUSD Will Go Up! Long!
Please, check our technical outlook for GBPUSD.
Time Frame: 1D
Current Trend: Bullish
Sentiment: Oversold (based on 7-period RSI)
Forecast: Bullish
The market is approaching a significant support area 1.317.
The underlined horizontal cluster clearly indicates a highly probable bullish movement with target 1.345 level.
P.S
We determine oversold/overbought condition with RSI indicator.
When it drops below 30 - the market is considered to be oversold.
When it bounces above 70 - the market is considered to be overbought.
Like and subscribe and comment my ideas if you enjoy them!

AUDCAD Is Going Down! Short!
Here is our detailed technical review for AUDCAD.
Time Frame: 2h
Current Trend: Bearish
Sentiment: Overbought (based on 7-period RSI)
Forecast: Bearish
The market is testing a major horizontal structure 0.920.
Taking into consideration the structure & trend analysis, I believe that the market will reach 0.916 level soon.
P.S
We determine oversold/overbought condition with RSI indicator.
When it drops below 30 - the market is considered to be oversold.
When it bounces above 70 - the market is considered to be overbought.
Like and subscribe and comment my ideas if you enjoy them!

The Silver Storm: 9k Pips Down, but Bulls Start Breathing AgainWhile Gold has been volatile, Silver’s drop has been even more spectacular — a breathtaking 9,000-pip decline in just 10 days, from the all-time high near 54.50 down to 45.50, a correction of roughly 20%.
But let’s not forget — the prior rally was just as extreme: from 37 to almost 55, a 50% surge.
This kind of price behavior is typical for Silver — sharp on both sides. Yet, compared to Gold, the recent structure shows a few key differences worth noting:
________________________________________
🔍 Key Observations
1. Back Above the Ascending Trendline
After the recent low two days ago, Silver managed to climb back above the ascending trendline that started in late August — a strong early sign of stabilization.
2. Perfect 50% Retracement Support
The correction stopped exactly at the 50% Fibonacci retracement, perfectly aligned with a major horizontal support zone — a classic technical confluence.
3. Higher Low Confirmed
Unlike Gold, Silver printed a clear higher low last night, strengthening the case for a bullish recovery setup.
________________________________________
🎯 Outlook
Putting it all together, Silver appears to have completed its correction and looks technically stronger than Gold at this stage.
If the current momentum continues, a new test above 50 seems increasingly likely in the coming sessions.
🚀

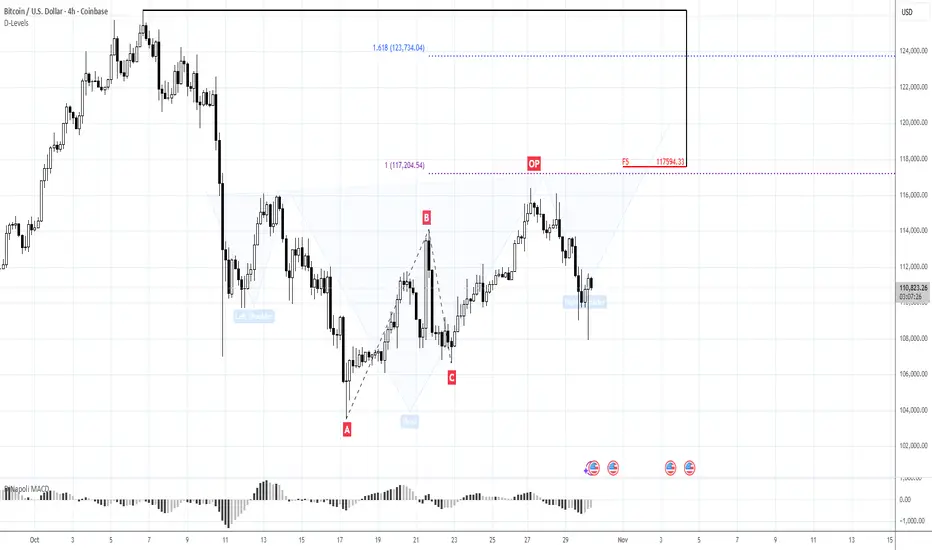
BTC HAS TO START UPSIDE ACTION ... OR IT DOESN'T START IT AT ALLMorning folks,
So, we've got a H&S that we suggested. Great. Besides, price is already at the right arm's bottom - its time to make a decision, whether you're in or not. Also we could use this small 30-min H&S to minimize the risk.
The logic is simple. Upside action has to start right from here, or it will not happen at all and BTC will fall back to 100K lows.
Lingrid | AUDUSD Major Resistance Short SetupThe price perfectly fulfilled my previous idea . FX:AUDUSD is currently testing the upper boundary of its consolidation zone near 0.6624 after breaking out of an ascending triangle pattern. Price action is interacting with both the downward trendline and the newly formed upward trendline, signaling a potential exhaustion point. A rejection from this confluence area could trigger a corrective leg toward 0.6529 as part of a short-term retracement phase. Bears may regain control if momentum fades near the 0.6620–0.6640 resistance range.
⚠️ Risks:
Unexpected dovish commentary from the Federal Reserve could support the pair higher.
Breakout above 0.6640 may invalidate the bearish setup and shift momentum upward.
Reduced volatility before key U.S. economic data could delay confirmation of the move.
If this idea resonates with you or you have your own opinion, traders, hit the comments. I’m excited to read your thoughts!

AUD-NZD Bullish Bias! Buy!
Hello,Traders!
AUD-NZD is trading in an uptrend and the pair has swept all liquidity from the demand level below and is showing clear rejection so based on SMC analysis we will be expecting a further bullish move up. Time Frame 4H.
Buy!
Comment and subscribe to help us grow!
Check out other forecasts below too!
Disclosure: I am part of Trade Nation's Influencer program and receive a monthly fee for using their TradingView charts in my analysis.

BTCUSDT.P - October 30, 2025BTCUSDT.P - In-depth analysis | 1D Timeframe
Trend Structure:
The market is currently consolidating after a notable uptrend that peaked near the $127,000 zone. Recent weekly candles display lower highs and moderate-bodied structures, suggesting a weakening bullish impulse. The current range is bounded by resistance at $126,200–$132,900 and support at $101,500, with a deeper structural support near $74,450.
Trend Strength:
Trend momentum is weak, indicated by a low strength reading. The loss of directional follow-through implies the market is entering a mid-cycle cooling phase or secondary correction within a broader bullish structure.
Volatility Conditions:
Volatility remains moderate, reflecting an equilibrium between buyers and sellers. This volatility profile typically precedes a breakout move after extended consolidation.
Squeeze:
Current market condition suggests energy buildup and potential for a decisive breakout in the coming weeks.
Bias:
Given the weakening trend and active squeeze near mid-range support, the near-term bias is SHORT, targeting potential tests of the $101,500 level before any renewed bullish continuation can be confirmed above $126,000.

PENGUUSDT.P - October 30, 2025Bullish Bias: PENGUUSDT.P is consolidating near the $0.019 support zone, showing potential accumulation after a prolonged downtrend. A breakout above $0.0269 would confirm bullish momentum and open room toward $0.0325 as the next resistance.
Bearish Bias: Price remains in a clear downtrend with lower highs and lows, and sustained weakness below $0.019 would likely trigger continuation toward the $0.009 region. Until a confirmed breakout occurs, momentum favors sellers.
The token is currently in a volatility squeeze, indicating that a big move in either direction is coming anytime soon.

XAUUSD: The Bullish ABCD Pattern Signals Potential Price SurgeHey everyone, it's Erik!
The price has decreased within the bullish ABCD pattern, a pattern that often indicates that the sellers have exhausted their strength, with their momentum weakening near the bottom.
Recently, the price broke above the upper trendline, signaling that buyers are starting to intervene, shifting the market dynamics in their favor.
If the price stays above this recently broken level, we could see a significant rise. My target is for the price to reach around 4,130, a reasonable level based on the current setup.

NZDUSD FREE SIGNAL|LONG|
✅NZDUSD Price bounced from the demand level after a liquidity sweep below the lows, confirming bullish order flow continuation toward the upper range.
—————————
Entry: 0.5762
Stop Loss: 0.5748
Take Profit: 0.5788
Time Frame: 2H
—————————
LONG🚀
✅Like and subscribe to never miss a new idea!✅

DOW JONES approaching the end of its Bull Cycle?Dow Jones (DJI) has been trading within a 16-year Channel Up ever sine the March 02 2009 market bottom of the U.S. Housing Crisis. As this chart shows, we have divided this pattern into three different phases.
Since the March 2020 COVID crash, it appears that the Cycle got restarted as the index broke below its 1W MA200 (orange trend-line) again after 10 years. Technically that was the only time that multi-year Support trend-line broke in 15 years.
In any case, following that Cycle 'restart', it appears that the index is currently inside the Megaphone pattern that in 2015 concluded Phase 2. The conclusion came with a second test on the 1W MA200 (Double Bottom). The first test was the April 07 2025 Low.
With their 1W RSI sequences also identical, having the first 1W MA200 forcing a 30.00 (oversold) RSI rebound, we expect the index to start a new Bearish Leg that might potentially test the 1W MA200 around 39000. For long-term investors, that is the market's next Buy Entry.
-------------------------------------------------------------------------------
** Please LIKE 👍, FOLLOW ✅, SHARE 🙌 and COMMENT ✍ if you enjoy this idea! Also share your ideas and charts in the comments section below! This is best way to keep it relevant, support us, keep the content here free and allow the idea to reach as many people as possible. **
-------------------------------------------------------------------------------
💸💸💸💸💸💸
👇 👇 👇 👇 👇 👇

CAD-CHF Short From Supply Area! Sell!
Hello,Traders!
CADCHF Price has reacted from a horizontal supply area, showing early signs of distribution. A short-term retracement is expected as liquidity below the recent swing lows gets targeted. Time Frame 2H.
Sell!
Comment and subscribe to help us grow!
Check out other forecasts below too!
Disclosure: I am part of Trade Nation's Influencer program and receive a monthly fee for using their TradingView charts in my analysis.

GBPAUD RISKY LONG|
✅GBPAUD Price created a triple-bottom formation at discount levels, signaling strong bullish rejection from demand. Expect a short-term rally targeting liquidity above the recent highs. Time Frame 2H.
LONG🚀
✅Like and subscribe to never miss a new idea!✅
