Lingrid | USDJPY Weekly High Rejection - Potential Sell SignalFX:USDJPY reached the weekly high, showing bearish divergence after an extended rally inside the upward channel. Price is now hovering near the 153.000 level, where prior highs align with weakening momentum. A rejection here could trigger a pullback toward the 152.000 mid-channel support, marking the next liquidity pocket. The 153.000 area acts as the key pivot where bears may regain short-term control before a potential rebound.
⚠️ Risks:
Breakout above 153.000 would invalidate the pullback outlook and invite new buying pressure.
Broader dollar strength could lift the pair beyond resistance.
Weakening yen fundamentals might limit downside follow-through.
If this idea resonates with you or you have your own opinion, traders, hit the comments. I’m excited to read your thoughts!
Signals

Lingrid | BTCUSDT Buying Opportunity In Sideways Market OKX:TONUSDT recently rebounded from the support zone after completing a range breakout and forming an ABC corrective move near the $2.0 mark. Price structure remains compressed between the descending resistance and rising trendline, hinting at a potential bullish recovery setup. A sustained above $2.10 could signal continuation toward $2.22. The bullish scenario builds from the ongoing rebound phase within the structure break above current range zone.
⚠️ Risks:
Rejection from $2.10 may invalidate the breakout structure.
Broader crypto weakness could cap upward momentum.
Failure to sustain above the trendline may shift bias back to bearish continuation.
If this idea resonates with you or you have your own opinion, traders, hit the comments. I’m excited to read your thoughts!

GOLD recovers ahead of US CPI data, key data dayArticle summary:
“Gold rebounded in the Asian session on October 24, trading around $4,139/ounce, as safe-haven flows surged amid renewed geopolitical tensions and investors awaited September US CPI data, which could determine the Federal Reserve’s monetary policy moves in the short term.
The recovery momentum was reinforced by expectations of an early Fed rate cut, along with the impact of Washington’s new oil sanctions on Russia and escalating US-China trade tensions. Meanwhile, technically, gold held support around $4,100, suggesting the medium-term uptrend remains intact.”
OANDA:XAUUSD maintained its recovery momentum in the Asian session on October 24, trading around $4,139/ounce, after rising sharply in the Thursday session thanks to the return of safe-haven flows amid fresh geopolitical developments. The move came as global markets await key US inflation data (September CPI), which is seen as key to shaping the direction of the Federal Reserve's monetary policy in the short term.
Economic data
The US Bureau of Labor Statistics (BLS) will release its September Consumer Price Index (CPI) tonight.
Forecasts show the US core CPI rising 0.3% month-on-month and remaining at 3.1% year-on-year, suggesting persistent inflationary pressures despite signs of cooling energy prices.
The market has all but priced in a 25 basis point rate cut by the Fed at its policy meeting next week. In a low-interest-rate environment, gold, a non-yielding asset, tends to benefit from lower opportunity costs.
“Gold’s goal is to continue its rally ahead of the CPI data,” says Valeria Bednarik of FXStreet.
Political and Geopolitical Events
Gold prices rebounded after the US imposed new sanctions on two major Russian energy companies, Lukoil and Rosneft. This is the first sanctions of President Donald Trump's second term and is seen as a significant escalation in the pressure campaign against Moscow.
According to Jorge Leon, Director of Geopolitical Analysis at Rystad Energy, "This move marks a major and unprecedented escalation in Washington's campaign against Russia."
The sanctions could impact global oil supplies, indirectly increasing the appeal of gold as a hedge against risks in an uncertain environment.
In addition, US-China tensions have also resurfaced as the White House considers restricting China’s use of US software, retaliating against Beijing’s rare earth export controls and raising port fees for US-flagged ships. These signals reinforce the “selective risk-off” sentiment in global markets.
In short, the current developments suggest that gold is repositioning itself in a medium-term bull cycle, as the market simultaneously assesses geopolitical risks and the prospect of Fed easing.
If CPI data reinforces the case for a Fed rate cut at the upcoming meeting, gold could retain its appeal as a key safe-haven asset in the fourth quarter.
Technical Outlook Analysis OANDA:XAUUSD
Technical analysis:
Gold prices are maintaining a technical recovery after a strong correction from the peak of 4,379 USD/ounce. Currently, the price is trading around 4,118 USD, approaching the Fibonacci support zone of 0.618 (4,110 USD), an important milestone to determine the short-term supply-demand balance.
On the daily chart, gold is still in the medium-term uptrend channel formed since mid-August, with the MA21 average line (4,000 USD area) continuing to act as a dynamic support base. RSI has reached the 50 area and is showing signs of forming a slight bottom, reflecting the weakening selling momentum.
In terms of patterns, the candlestick cluster of the last 2 days shows a "hammer - recovery confirmation" pattern, suggesting that demand is reappearing at the technical bottom.
Trend Assessment:
If the $4,100 zone holds, there is a high probability that gold will enter a bullish consolidation phase towards the $4,200 mark. However, a break of the $4,000 zone would open up a deeper correction towards the $3,950 area.
In the context of lower interest rate expectations and geopolitical tensions that have not yet subsided, the medium-term trend of gold remains bullish, although the current recovery is more technical than a fundamental breakout.
SELL XAUUSD PRICE 4221 - 4219⚡️
↠↠ Stop Loss 4225
→Take Profit 1 4213
↨
→Take Profit 2 4207
BUY XAUUSD PRICE 4057 - 4059⚡️
↠↠ Stop Loss 4053
→Take Profit 1 4065
↨
→Take Profit 2 4071

ETHUSDT.P - October 24, 2025This indicator introduces a minimalist Buy/Sell signal methodology designed for clarity and power. The goal is to strip away all visual clutter—no trendlines, no Boxes, no FVGs—to focus solely on generating precise market directional signals.
It is specifically developed for stability and reliability on well-established major-cap cryptocurrencies (e.g., ETH, BTC). It is not intended for use with high-volatility, low-cap, or memecoins.
Observed Performance
The underlying logic has shown strong results on major pairs. A sample backtest on ETHUSDT.P demonstrated a focus on quality over quantity, yielding 4 clean trades over a 60-day period with a 100% win rate.
The methodology is currently for private study and application, serving as an example of how powerful, clean indicators can be developed for traders focused on large-cap stability.
This content is for educational and analytical purposes only and does not contain any promotional material, solicitation, or fundraising requests.

Gold Likely to Rise FurtherPEPPERSTONE:XAUUSD is demonstrating a well-structured movement within an ascending channel, where each price bounce is well-controlled, and every retracement follows a consistent pattern. The strength of the buyers is becoming increasingly evident, with technical dynamics becoming more organized and fluid.
After breaking through a key resistance level, the price is now retesting this level. If this level holds as solid support, the market is likely to continue its bullish momentum towards 4,500, which serves as the natural target aligned with the upper boundary of the ascending channel.
As long as the price remains above this support level, the upward trend will continue. However, if the price fails to hold and drops below this level, the trend structure will be at risk, and the likelihood of a technical correction towards the lower boundary of the channel will increase.
In this well-organized market condition, consistency and discipline in analysis are crucial. Carefully identify key points, wait for strong confirmation, and allow the trend to move in the predetermined direction.

BYD Boyd Gaming Corporation Options Ahead of EarningsAnalyzing the options chain and the chart patterns of BYD Boyd Gaming Corporation prior to the earnings report this week,
I would consider purchasing the 95usd strike price Calls with
an expiration date of 2025-12-19,
for a premium of approximately $0.82.
If these options prove to be profitable prior to the earnings release, I would sell at least half of them.

BITCOIN and the 'myth' behind following the Global SupplyA lot of talk is being thrown around lately regarding the M2 Global Supply (black trend-line) and how Bitcoin (BTCUSD) will follow it upwards as it explodes. Those claims have intensified especially in the past 2 weeks as an argument to support BTC's recovery following the decline from its $126k Top.
However, history shows that the two don't have to be correlated. In fact, during the past two Cycles, BTC topped at least 105 days (15 weeks) before the Global M2 did. Especially during the previous Cycle (2021), BTC has broken well below its 1W MA50 (blue trend-line) and stayed under up until the M2 peaked also. Note that the 1W MA50 is what has (so far) supported BTC's current correction.
As a result, no hopes of recovery can be rest upon a currently rising Global Liquidity. And if BTC's Cycle Top was 2 weeks ago, the Global Liquidity might peak 15 weeks from that, around January 19 2026 (possibly around the time the stock market peaks too).
But what do you think? Do you think Bitcoin will catch up to the rising M2 Global Supply or will continue its decline into a new Bear Cycle as it has historically happened? Feel free to let us know in the comments section below!
-------------------------------------------------------------------------------
** Please LIKE 👍, FOLLOW ✅, SHARE 🙌 and COMMENT ✍ if you enjoy this idea! Also share your ideas and charts in the comments section below! This is best way to keep it relevant, support us, keep the content here free and allow the idea to reach as many people as possible. **
-------------------------------------------------------------------------------
💸💸💸💸💸💸
👇 👇 👇 👇 👇 👇

EURGBP FREE SIGNAL|SHORT|
✅EURGBP has reached a premium zone tapping into a strong supply level where smart money could engineer distribution. Expecting a reaction to the downside as liquidity is targeted below the previous swing lows.
—————————
Entry: 0.8721
Stop Loss: 0.8730
Take Profit: 0.8708
Time Frame: 3H
—————————
SHORT🔥
✅Like and subscribe to never miss a new idea!✅

GOLD Free Signal! Sell!
Hello,Traders!
GOLD SMC based setup forming after price mitigated the horizontal supply area and showed clear rejection. Smart money is likely offloading long positions here before targeting liquidity below recent equal lows.
-------------------
Stop Loss: 4,188$
Take Profit: 4,093$
Entry: 4,139$
Time Frame: 3H
-------------------
Sell!
Comment and subscribe to help us grow!
Check out other forecasts below too!
Disclosure: I am part of Trade Nation's Influencer program and receive a monthly fee for using their TradingView charts in my analysis.

Lingrid | BTCUSDT Consolidation Period Following CorrectionBINANCE:BTCUSDT remains under heavy pressure after a sharp rebound from 102K met resistance near the 114K–115K zone. The market continues to respect its downward structure within the broad descending channel, suggesting sellers are still in control. A rejection around the trendline could confirm a new bearish leg toward 107.5K or even 102K if weakness accelerates. Overall momentum favors further downside as lower highs keep forming under resistance.
⚠️ Risks:
Sudden bullish breakout above 115K could invalidate the bearish channel.
Positive macro news or ETF inflows could trigger short-term recovery.
Oversold market conditions may lead to a temporary corrective bounce.
If this idea resonates with you or you have your own opinion, traders, hit the comments. I’m excited to read your thoughts!

Lingrid | XRPUSDT Bearish Pressure Continues BINANCE:XRPUSDT continues its decline within a well-defined downward channel after facing rejection near the resistance trendline. The pair remains trapped under a bearish structure marked by lower highs and lower lows. Unless it breaks above 2.50, the bias stays bearish with potential continuation toward 2.10. Overall momentum reflects sustained selling pressure as the market follows its descending trajectory.
⚠️ Risks:
A sudden shift in BTC sentiment could invalidate the bearish setup.
A breakout above 2.45 would signal a reversal toward 2.83.
Unexpected regulatory or liquidity events could distort short-term technical flows.
If this idea resonates with you or you have your own opinion, traders, hit the comments. I’m excited to read your thoughts!

EUR-GBP Local Short! Sell!
Hello, Traders!
EURGBP tapped a key supply area after a liquidity grab, signaling potential smart money distribution. Expect bearish reaction and continuation toward the target level as price seeks balance after inefficiency.
Time Frame 3H.
Sell!
Comment and subscribe to help us grow!
Check out other forecasts below too!
Disclosure: I am part of Trade Nation's Influencer program and receive a monthly fee for using their TradingView charts in my analysis.

GBPAUD FREE SIGNALS|LONG|
✅GBPAUD Price has reached a key discount zone tapping into a high-probability demand area. Smart money could now be accumulating long positions, anticipating a shift in structure toward the next liquidity draw above recent highs.
—————————
Entry: 2.0450
Stop Loss: 2.0425
Take Profit: 2.0481
Time Frame: 2H
—————————
LONG🚀
✅Like and subscribe to never miss a new idea!✅

BNBUSDT.P - October 23, 2025The current price action is testing a major 4-hour resistance zone near $1,142.74, which is an ideal entry for a short-sell setup. The target for the short would be to ride the price back down to the recent swing low around the $1,076 support. Plan your trades accordingly; this is an extremely high-risk setup given the major economic and geopolitical announcements expected from President Trump, which could trigger immediate, sharp volatility.

USD-CAD Free Signal! Buy!
Hello,Traders!
USDCAD Price is reacting from a well-defined horizontal demand area where previous sell-side liquidity was swept. Smart money may now be accumulating long positions for a bullish push toward the next liquidity pool.
-------------------
Stop Loss: 1.3975
Take Profit: 1.4020
Entry: 1.3995
Time Frame: 3H
-------------------
Buy!
Comment and subscribe to help us grow!
Check out other forecasts below too!
Disclosure: I am part of Trade Nation's Influencer program and receive a monthly fee for using their TradingView charts in my analysis.

XAU/USD – Gold Tests Final Structure Before Deciding New Wave“If the 3,950 USD zone is breached, the long-term uptrend may end.”
🔍 Market Context
After reaching the historical peak ATH GOLD 4,391 USD , gold has sharply corrected and formed a clear Change of Character (ChoCH) on the H1 frame.
Currently, the price is technically recovering to the Resistance – FVG – Fibonacci 4,216 USD zone, which was previously a distribution peak.
The sellers are regaining short-term advantage, while the Order Block zone (3,953–3,960 USD) — the starting point of the strongest growth on H4/Daily — is becoming the most critical defense line of the uptrend.
If this zone is decisively broken, the medium-term uptrend structure is likely to break and trigger a bearish expansion towards deeper liquidity zones like 3,689 USD.
💎 Technical Analysis
Resistance – FVG – Fib Zone: 4,216 – 4,228 → confluence resistance zone FVG + Fibo 0.618, suitable for sell reaction.
Liquidity Sweep Zone: 4,043 – 4,006 → intermediate liquidity sweep zone, temporary pause may occur.
Order Block | Structural Base: 3,953 – 3,960 → H4 momentum zone → ATH; if breached, long-term uptrend structure invalidated.
Liquidity Zone $$$: 3,689 – 3,685 → deep liquidity zone, potential target if OB is broken.
Overall Structure:
→ Short-term: bearish corrective phase.
→ Medium-term: bullish remains if 3,950 is not breached.
📉 Trading Scenarios
1️⃣ SELL Setup – Reaction at 4,216 – 4,228 USD zone
Entry: 4,216 – 4,228
SL: 4,240
TP1: 4,043
TP2: 3,956
TP3: 3,689
✅ Condition:
Wait for clear reversal signal (strong rejection or bearish engulfing) on H1/M15 at FVG resistance zone.
➡️ Classic “Sell the Rally” setup – follow the flow after ChoCH, target key OB zone 3,953 USD.
2️⃣ BUY Setup – Reaction at Order Block 3,953 – 3,960 USD
Entry: 3,956 – 3,953
SL: 3,940
TP: 4,043 → 4,216
✅ Condition:
Price holds OB and strong reversal signal appears (bullish engulfing / increased volume / small BoS structure turns bullish again).
➡️ This is the decision zone for medium-term trend: if it bounces strongly, buyers will regain control; if breached, gold enters a new deep decline cycle.
⚠️ Risk Management
Prioritize SELL when price retraces to 4,216 – 4,228 zone with reversal signal.
BUY at 3,953 only with clear reaction; if broken, stop all buy orders.
When price closes H4 candle below 3,950 → confirm bearish break, extend target to 3,689 USD.
💬 Conclusion
Gold is testing the Order Block foundation of the long-term uptrend (3,953–3,960 USD) .
If this zone holds, the market may rebound to 4,216 – 4,280;
but if breached, gold is likely to open a deep decline phase to 3,689 USD – where a massive amount of liquidity is concentrated at the bottom.
👉 Reasonable Strategy:
Sell 4,216 – 4,228 USD if there is a clear reversal signal.
Buy 3,953 – 3,960 USD if there is a strong reaction;
If 3,950 is breached → confirm extended downtrend, prioritize SELL continuation.
🔥 “This Order Block built the last gold rally — if it breaks, the next leg down will be brutal.”
⏰ Time Frame: 1H – reference H4/Daily
📅 Update: 22/10/2025
✍️ Analysis by: Captain Vincent

NZDUSD LOCAL SHORT|
✅NZDUSD is currently trading inside a premium zone within a key supply area, where liquidity above previous highs has likely been engineered. A shift in market structure from here could confirm a short setup toward the next draw on liquidity. Time Frame 2H.
SHORT🔥
✅Like and subscribe to never miss a new idea!✅

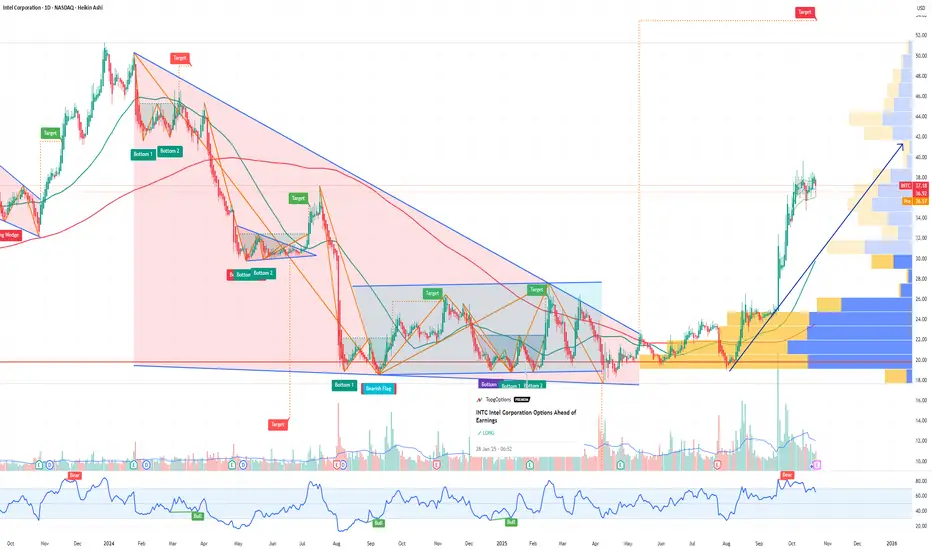
INTC Intel Corporation Options Ahead of EarningsIf you haven`t bought the dip on INTC:
Now analyzing the options chain and the chart patterns of INTC Intel Corporation prior to the earnings report this week,
I would consider purchasing the 48usd strike price Calls with
an expiration date of 2026-3-20,
for a premium of approximately $2.75.
If these options prove to be profitable prior to the earnings release, I would sell at least half of them.
NEM Newmont Corporation Options Ahead of EarningsAnalyzing the options chain and the chart patterns of NEM Newmont Corporation prior to the earnings report this week,
I would consider purchasing the 87usd strike price Puts with
an expiration date of 2025-10-24,
for a premium of approximately $2.18.
If these options prove to be profitable prior to the earnings release, I would sell at least half of them.

PG The Procter & Gamble Company Options Ahead of EarningsIf you haven`t bought the dip on PG:
Now analyzing the options chain and the chart patterns of PG The Procter & Gamble Company prior to the earnings report this week,
I would consider purchasing the 152.50usd strike price Calls with
an expiration date of 2025-11-21,
for a premium of approximately $3.55.
If these options prove to be profitable prior to the earnings release, I would sell at least half of them.

RIVIAN Triangle to give one more rally?Rivian Automotive (RIVN) has been trading within a 1.5 year Triangle pattern, with the price currently consolidating just below both the 1D MA50 (blue trend-line) and 1D MA200 (orange trend-line).
All previous Higher Lows of the pattern have been priced on at least the 0.786 Fibonacci retracement level, which is currently just below or when the 1D RSI approaches the 30.00 oversold level.
As a result, we expect a rebound near the bottom of the pattern, targeting its top (Lower Highs trend-line) at $15.75.
-------------------------------------------------------------------------------
** Please LIKE 👍, FOLLOW ✅, SHARE 🙌 and COMMENT ✍ if you enjoy this idea! Also share your ideas and charts in the comments section below! This is best way to keep it relevant, support us, keep the content here free and allow the idea to reach as many people as possible. **
-------------------------------------------------------------------------------
💸💸💸💸💸💸
👇 👇 👇 👇 👇 👇

GBPUSD Channel Down targeting at least 1.3250The GBPUSD pair has been trading within a 1-month Channel Down pattern since the September 23 rejection on its 4H MA200 (orange trend-line). In fact, we are currently on the third Bearish Leg of this pattern, all of which have been initiated by 4H MA200 rejections.
We expect the price to target at least 1.3250, where it might technically rebound due to the presence of the 1D MA200 (red trend-line). If it breaks though, we can see a -2.07% standard Bearish Leg extension to 1.32000, which would make a perfect technical Lower Low at the bottom of the Channel Down.
-------------------------------------------------------------------------------
** Please LIKE 👍, FOLLOW ✅, SHARE 🙌 and COMMENT ✍ if you enjoy this idea! Also share your ideas and charts in the comments section below! This is best way to keep it relevant, support us, keep the content here free and allow the idea to reach as many people as possible. **
-------------------------------------------------------------------------------
💸💸💸💸💸💸
👇 👇 👇 👇 👇 👇

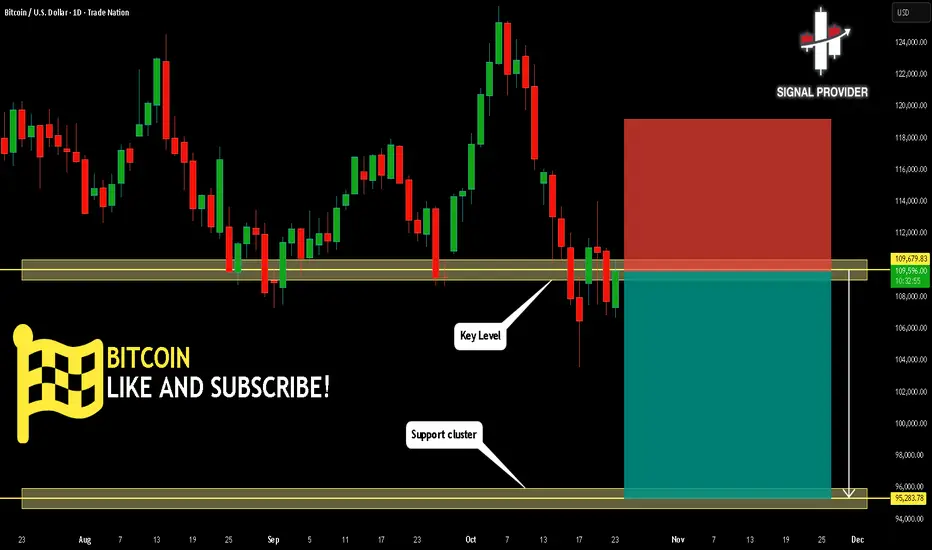
BITCOIN Will Go Down From Resistance! Short!
Take a look at our analysis for BITCOIN.
Time Frame: 1D
Current Trend: Bearish
Sentiment: Overbought (based on 7-period RSI)
Forecast: Bearish
The market is approaching a key horizontal level 109,679.83.
Considering the today's price action, probabilities will be high to see a movement to 95,283.78.
P.S
The term oversold refers to a condition where an asset has traded lower in price and has the potential for a price bounce.
Overbought refers to market scenarios where the instrument is traded considerably higher than its fair value. Overvaluation is caused by market sentiments when there is positive news.
Like and subscribe and comment my ideas if you enjoy them!