BNBUSDT.P - October 23, 2025The current price action is testing a major 4-hour resistance zone near $1,142.74, which is an ideal entry for a short-sell setup. The target for the short would be to ride the price back down to the recent swing low around the $1,076 support. Plan your trades accordingly; this is an extremely high-risk setup given the major economic and geopolitical announcements expected from President Trump, which could trigger immediate, sharp volatility.
Signals

USD-CAD Free Signal! Buy!
Hello,Traders!
USDCAD Price is reacting from a well-defined horizontal demand area where previous sell-side liquidity was swept. Smart money may now be accumulating long positions for a bullish push toward the next liquidity pool.
-------------------
Stop Loss: 1.3975
Take Profit: 1.4020
Entry: 1.3995
Time Frame: 3H
-------------------
Buy!
Comment and subscribe to help us grow!
Check out other forecasts below too!
Disclosure: I am part of Trade Nation's Influencer program and receive a monthly fee for using their TradingView charts in my analysis.

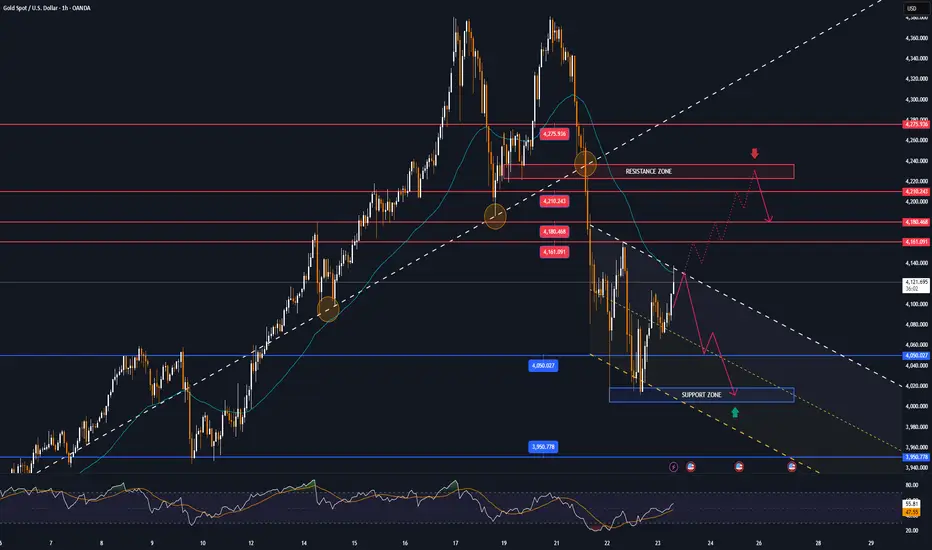
XAU/USD – Gold Tests Final Structure Before Deciding New Wave“If the 3,950 USD zone is breached, the long-term uptrend may end.”
🔍 Market Context
After reaching the historical peak ATH GOLD 4,391 USD , gold has sharply corrected and formed a clear Change of Character (ChoCH) on the H1 frame.
Currently, the price is technically recovering to the Resistance – FVG – Fibonacci 4,216 USD zone, which was previously a distribution peak.
The sellers are regaining short-term advantage, while the Order Block zone (3,953–3,960 USD) — the starting point of the strongest growth on H4/Daily — is becoming the most critical defense line of the uptrend.
If this zone is decisively broken, the medium-term uptrend structure is likely to break and trigger a bearish expansion towards deeper liquidity zones like 3,689 USD.
💎 Technical Analysis
Resistance – FVG – Fib Zone: 4,216 – 4,228 → confluence resistance zone FVG + Fibo 0.618, suitable for sell reaction.
Liquidity Sweep Zone: 4,043 – 4,006 → intermediate liquidity sweep zone, temporary pause may occur.
Order Block | Structural Base: 3,953 – 3,960 → H4 momentum zone → ATH; if breached, long-term uptrend structure invalidated.
Liquidity Zone $$$: 3,689 – 3,685 → deep liquidity zone, potential target if OB is broken.
Overall Structure:
→ Short-term: bearish corrective phase.
→ Medium-term: bullish remains if 3,950 is not breached.
📉 Trading Scenarios
1️⃣ SELL Setup – Reaction at 4,216 – 4,228 USD zone
Entry: 4,216 – 4,228
SL: 4,240
TP1: 4,043
TP2: 3,956
TP3: 3,689
✅ Condition:
Wait for clear reversal signal (strong rejection or bearish engulfing) on H1/M15 at FVG resistance zone.
➡️ Classic “Sell the Rally” setup – follow the flow after ChoCH, target key OB zone 3,953 USD.
2️⃣ BUY Setup – Reaction at Order Block 3,953 – 3,960 USD
Entry: 3,956 – 3,953
SL: 3,940
TP: 4,043 → 4,216
✅ Condition:
Price holds OB and strong reversal signal appears (bullish engulfing / increased volume / small BoS structure turns bullish again).
➡️ This is the decision zone for medium-term trend: if it bounces strongly, buyers will regain control; if breached, gold enters a new deep decline cycle.
⚠️ Risk Management
Prioritize SELL when price retraces to 4,216 – 4,228 zone with reversal signal.
BUY at 3,953 only with clear reaction; if broken, stop all buy orders.
When price closes H4 candle below 3,950 → confirm bearish break, extend target to 3,689 USD.
💬 Conclusion
Gold is testing the Order Block foundation of the long-term uptrend (3,953–3,960 USD) .
If this zone holds, the market may rebound to 4,216 – 4,280;
but if breached, gold is likely to open a deep decline phase to 3,689 USD – where a massive amount of liquidity is concentrated at the bottom.
👉 Reasonable Strategy:
Sell 4,216 – 4,228 USD if there is a clear reversal signal.
Buy 3,953 – 3,960 USD if there is a strong reaction;
If 3,950 is breached → confirm extended downtrend, prioritize SELL continuation.
🔥 “This Order Block built the last gold rally — if it breaks, the next leg down will be brutal.”
⏰ Time Frame: 1H – reference H4/Daily
📅 Update: 22/10/2025
✍️ Analysis by: Captain Vincent

NZDUSD LOCAL SHORT|
✅NZDUSD is currently trading inside a premium zone within a key supply area, where liquidity above previous highs has likely been engineered. A shift in market structure from here could confirm a short setup toward the next draw on liquidity. Time Frame 2H.
SHORT🔥
✅Like and subscribe to never miss a new idea!✅

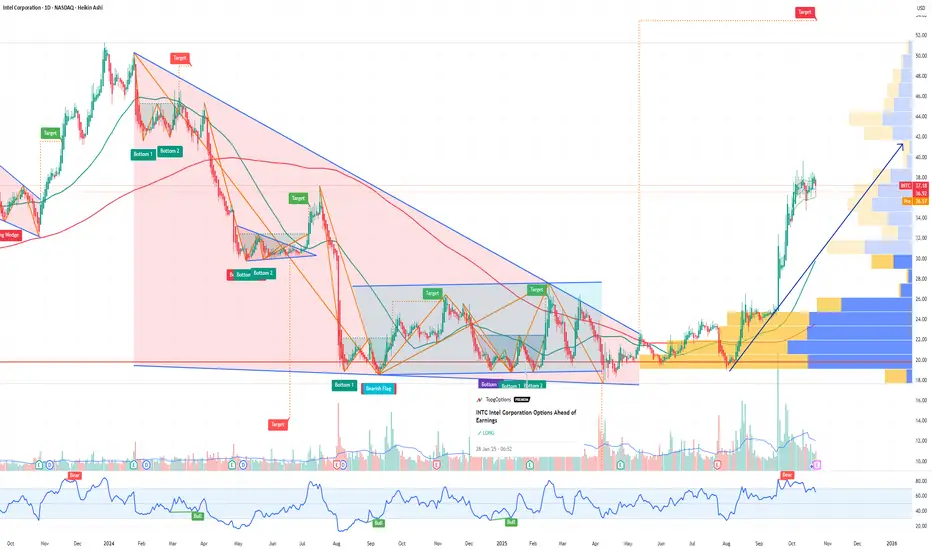
INTC Intel Corporation Options Ahead of EarningsIf you haven`t bought the dip on INTC:
Now analyzing the options chain and the chart patterns of INTC Intel Corporation prior to the earnings report this week,
I would consider purchasing the 48usd strike price Calls with
an expiration date of 2026-3-20,
for a premium of approximately $2.75.
If these options prove to be profitable prior to the earnings release, I would sell at least half of them.
NEM Newmont Corporation Options Ahead of EarningsAnalyzing the options chain and the chart patterns of NEM Newmont Corporation prior to the earnings report this week,
I would consider purchasing the 87usd strike price Puts with
an expiration date of 2025-10-24,
for a premium of approximately $2.18.
If these options prove to be profitable prior to the earnings release, I would sell at least half of them.

PG The Procter & Gamble Company Options Ahead of EarningsIf you haven`t bought the dip on PG:
Now analyzing the options chain and the chart patterns of PG The Procter & Gamble Company prior to the earnings report this week,
I would consider purchasing the 152.50usd strike price Calls with
an expiration date of 2025-11-21,
for a premium of approximately $3.55.
If these options prove to be profitable prior to the earnings release, I would sell at least half of them.

RIVIAN Triangle to give one more rally?Rivian Automotive (RIVN) has been trading within a 1.5 year Triangle pattern, with the price currently consolidating just below both the 1D MA50 (blue trend-line) and 1D MA200 (orange trend-line).
All previous Higher Lows of the pattern have been priced on at least the 0.786 Fibonacci retracement level, which is currently just below or when the 1D RSI approaches the 30.00 oversold level.
As a result, we expect a rebound near the bottom of the pattern, targeting its top (Lower Highs trend-line) at $15.75.
-------------------------------------------------------------------------------
** Please LIKE 👍, FOLLOW ✅, SHARE 🙌 and COMMENT ✍ if you enjoy this idea! Also share your ideas and charts in the comments section below! This is best way to keep it relevant, support us, keep the content here free and allow the idea to reach as many people as possible. **
-------------------------------------------------------------------------------
💸💸💸💸💸💸
👇 👇 👇 👇 👇 👇

GBPUSD Channel Down targeting at least 1.3250The GBPUSD pair has been trading within a 1-month Channel Down pattern since the September 23 rejection on its 4H MA200 (orange trend-line). In fact, we are currently on the third Bearish Leg of this pattern, all of which have been initiated by 4H MA200 rejections.
We expect the price to target at least 1.3250, where it might technically rebound due to the presence of the 1D MA200 (red trend-line). If it breaks though, we can see a -2.07% standard Bearish Leg extension to 1.32000, which would make a perfect technical Lower Low at the bottom of the Channel Down.
-------------------------------------------------------------------------------
** Please LIKE 👍, FOLLOW ✅, SHARE 🙌 and COMMENT ✍ if you enjoy this idea! Also share your ideas and charts in the comments section below! This is best way to keep it relevant, support us, keep the content here free and allow the idea to reach as many people as possible. **
-------------------------------------------------------------------------------
💸💸💸💸💸💸
👇 👇 👇 👇 👇 👇

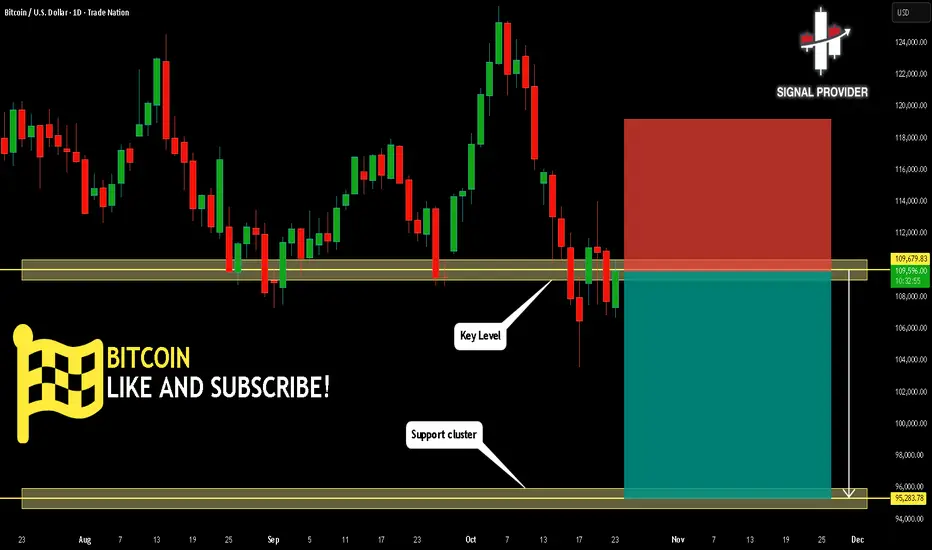
BITCOIN Will Go Down From Resistance! Short!
Take a look at our analysis for BITCOIN.
Time Frame: 1D
Current Trend: Bearish
Sentiment: Overbought (based on 7-period RSI)
Forecast: Bearish
The market is approaching a key horizontal level 109,679.83.
Considering the today's price action, probabilities will be high to see a movement to 95,283.78.
P.S
The term oversold refers to a condition where an asset has traded lower in price and has the potential for a price bounce.
Overbought refers to market scenarios where the instrument is traded considerably higher than its fair value. Overvaluation is caused by market sentiments when there is positive news.
Like and subscribe and comment my ideas if you enjoy them!
NZDUSD Will Go Higher! Buy!
Please, check our technical outlook for NZDUSD.
Time Frame: 1D
Current Trend: Bullish
Sentiment: Oversold (based on 7-period RSI)
Forecast: Bullish
The market is approaching a significant support area 0.574.
The underlined horizontal cluster clearly indicates a highly probable bullish movement with target 0.584 level.
P.S
We determine oversold/overbought condition with RSI indicator.
When it drops below 30 - the market is considered to be oversold.
When it bounces above 70 - the market is considered to be overbought.
Like and subscribe and comment my ideas if you enjoy them!

EURAUD Will Go Down! Sell!
Here is our detailed technical review for EURAUD.
Time Frame: 1D
Current Trend: Bearish
Sentiment: Overbought (based on 7-period RSI)
Forecast: Bearish
The market is on a crucial zone of supply 1.780.
The above-mentioned technicals clearly indicate the dominance of sellers on the market. I recommend shorting the instrument, aiming at 1.755 level.
P.S
Overbought describes a period of time where there has been a significant and consistent upward move in price over a period of time without much pullback.
Like and subscribe and comment my ideas if you enjoy them!

GBPJPY Will Move Higher! Long!
Take a look at our analysis for GBPJPY.
Time Frame: 12h
Current Trend: Bullish
Sentiment: Oversold (based on 7-period RSI)
Forecast: Bullish
The price is testing a key support 203.667.
Current market trend & oversold RSI makes me think that buyers will push the price. I will anticipate a bullish movement at least to 205.373 level.
P.S
Please, note that an oversold/overbought condition can last for a long time, and therefore being oversold/overbought doesn't mean a price rally will come soon, or at all.
Like and subscribe and comment my ideas if you enjoy them!

Is this a Bump and Run Reversal for Nike - 60% gains potential In this video I cover what could potentially be a reversal pattern playing out on Nike .
I cover the price action from the ATH down to the lows and present the idea of a bump and run
reversal pattern which could generate 60% gains .
Setting alerts is key and watching volume as explained in the video .
Please like and support my work any questions then ask below the chart .
Safe trading

DOGE Can it give one more rally?Dogecoin (DOGEUSD) has been trading within a Channel Up pattern since March 02 that only broke momentarily to the downside during the October 10 2025 flash crash. Immediately the price recovered and has since been consolidating on the 1W MA100 (red trend-line).
The 1W MA100 has price both previous Higher Lows bottoms of the pattern, with both Bearish Legs incredibly declining by the same extent -45.90%. This amazing degree of symmetry is also seen on the pattern's Bullish Legs, with both also registering identical rises of +101.96%, pricing their Higher Highs on their respective 1.136 Fibonacci extensions.
As a result, as long as DOGE keeps closing its 1W candles above the 1W MA100, we have strong reasons to expect another +101.96% Bullish Leg targeting 0.33000 (also the 1.136 Fibonacci extension).
It is also worth noting that the 1D RSI has been on a Higher Lows Bullish Divergence (against the price's Lower Lows), similar to the first bottom of the Channel Up in early April.
-------------------------------------------------------------------------------
** Please LIKE 👍, FOLLOW ✅, SHARE 🙌 and COMMENT ✍ if you enjoy this idea! Also share your ideas and charts in the comments section below! This is best way to keep it relevant, support us, keep the content here free and allow the idea to reach as many people as possible. **
-------------------------------------------------------------------------------
💸💸💸💸💸💸
👇 👇 👇 👇 👇 👇

3-DRIVE INSTEAD OF H&S WITH 101-102K TARGETMorning folks,
Last time we acknowledged some BTC efforts to reverse up, but decided to wait for more confirmation and more confidence. So, this bet seems is failing. Because fast jump was immediately reversed, and this is not the type of action that you expect from bullish market that supposedly is forming the H&S pattern...
It leads us to suggestion of 3-Drive "Buy" instead, with potential target around 101-102K area. At least now we prefer to stay aside from any bullish positions here.

Lingrid | GOLD Weekly Support Hold Long OpportunityOANDA:XAUUSD pulled back sharply from the resistance and printed a higher low right at the confluence of the uptrend and above previous week low 4,050. Structurally, the broader upward channel remains intact while price retested the downward trendline from above, keeping the higher-low sequence alive. If 4,000–4,050 support continues to hold, it favor a rebound toward 4,245 and, if momentum extends, a run at 4,400; a daily close back below 4,043 would defer the bounce. Broader momentum still skews bullish with successive higher lows, suggesting the recent drop is a corrective pullback within the trend rather than a top.
⚠️ Risks:
A decisive break below 4,000 that invalidates the uptrend confluence could extend losses toward 3,950–3,900.
Strong USD and higher real yields on hawkish Fed rhetoric/data may cap upside or accelerate downside.
Diminishing geopolitical risk or risk-on equity strength could sap haven demand for gold.
If this idea resonates with you or you have your own opinion, traders, hit the comments. I’m excited to read your thoughts!

what is happening wiyth xauusd?1. Fundamental Analysis (Macro Drivers)
🏦 Monetary Policy & Interest Rates
Federal Reserve stance: The Fed has paused rate hikes amid slowing US growth and moderating inflation. Real yields have begun to fall, which supports gold prices.
Market expectation: Traders now expect possible rate cuts in early 2026, lowering opportunity costs of holding non-yielding assets like gold.
Impact: Lower real yields → bullish for gold.
💵 US Dollar Trends
The US Dollar Index (DXY) has weakened over the last quarter due to rate-cut bets and growing fiscal deficits.
A weaker dollar directly lifts XAU/USD since gold is priced in USD.
📈 Inflation & Recession Fears
Despite softening inflation (US CPI ~3.2%), sticky services inflation and fiscal pressures maintain gold’s appeal as a hedge.
Global growth is fragile, and recession fears (notably in Europe and Japan) have increased safe-haven demand.
🌍 Geopolitical & Structural Factors
Escalating geopolitical tensions (Eastern Europe, South China Sea, Middle East) and US election uncertainty have driven institutional and central bank gold buying.
Central banks (notably China, India, and Turkey) are diversifying away from the USD — net gold purchases are at multi-year highs.
🏦 Central Bank Gold Demand
According to the World Gold Council, 2025 central bank purchases are on pace for another record year.
This provides a floor for gold prices even during corrective phases.
📊 Fundamental Outlook Summary
Factor Current Status Gold Impact
Fed Policy / Yields Dovish bias ✅ Bullish
US Dollar Weakening ✅ Bullish
Inflation Moderate but sticky ✅ Bullish
Geopolitical Risk Elevated ✅ Bullish
Central Bank Demand Strong ✅ Bullish
Global Growth Slowing ✅ Bullish
🔎 Overall Fundamental Bias: Strongly Bullish (Short-to-Medium Term)
📉 2. Technical Analysis (as of Oct 23 2025)
🔹 Current Price
XAU/USD ≈ $4,340/oz (TradingEconomics, Oct 20 2025)
🔹 Trend Overview
Long-term uptrend since early 2024 continues.
Gold broke out from a multi-decade ascending channel earlier this year and now trades well above 200-day moving average.
🔹 Moving Averages
Indicator Value Signal
20-day MA $4,215 ✅ Bullish
50-day MA $4,030 ✅ Bullish
100-day MA $3,740 ✅ Bullish
200-day MA $3,290 ✅ Bullish
→ All MAs are aligned in a bullish configuration (short-term > long-term).
🔹 RSI (Relative Strength Index)
RSI ≈ 78 → Indicates overbought conditions → risk of short-term correction or consolidation before further rally.
🔹 Key Levels
Type Level (USD/oz) Note
Resistance 1 $4,400 Recent high
Resistance 2 $4,500 Psychological round level
Support 1 $4,200 Short-term support
Support 2 $3,950 Strong support (previous breakout zone)
Support 3 $3,700 Long-term support / 100-DMA
🔹 Chart Pattern
Ascending channel with potential breakout continuation.
Some analysts note a rising wedge, signaling possible short-term exhaustion.
🔹 Volume & Momentum
Volume peaked on breakout above $4,000 — confirming strong institutional participation.
Momentum indicators show minor divergence → watch for short-term pullback.
📊 3. Combined Outlook
Horizon Technical Bias Fundamental Bias Combined View
Short-Term (1–3 weeks) ⚠️ Overbought – possible pullback to $4,150–4,200 ✅ Bullish Consolidation likely before next leg up
Medium-Term (1–3 months) ✅ Uptrend intact ✅ Bullish Buy on dips strategy favored
Long-Term (6–12 months) ✅ Strong uptrend ✅ Bullish Targets $4,500–$5,000 possible
🪙 4. Scenario Analysis
Scenario Trigger Likely Outcome
Bullish Continuation Fed confirms 2026 rate cuts, DXY weakens Gold → $4,500+
Short-Term Correction RSI reset, USD rebound Pullback to $4,100–$4,200
Bearish Reversal Sharp rise in yields or risk-on sentiment Gold retests $3,700–$3,900
🧩 5. Trading/Investment Insights
Short-term traders: Watch for retracement toward $4,150–$4,200 to consider buy setups.
Swing traders: Maintain partial longs; trail stops below $4,000.
Investors: Maintain core exposure; gold remains a hedge against macro and geopolitical volatility.

Lingrid | AUDCHF Key Zone Rejection Selling OpportunityFX:AUDCHF broke above consolidation structure after rebounding from the key support level around 0.514. The price has been oscillating inside a narrow range, capped by resistance near 0.521. A failure to break above this level could resume bearish momentum toward the 0.514–0.508 support zone since the major trend is bearish on the daily timeframe. The overall tone remains cautious as the pair stays confined within a corrective channel.
⚠️ Risks:
Strong Swiss franc buying due to risk-off sentiment could accelerate the decline.
A break above 0.521 resistance would invalidate the bearish setup.
Unexpected macro data from Australia may disrupt the current technical pattern.
If this idea resonates with you or you have your own opinion, traders, hit the comments. I’m excited to read your thoughts!

Lingrid | SHIBUSDT Sideways Break Lower ExpectedBINANCE:SHIBUSDT is trading below the confluence of the descending trendline and the former support, following a clear rejection and sell-off from the 0.0000148–0.0000136 resistance band. Structurally, price remains in a downward channel with a sequence of lower highs/lows after failing out of a short upward channel. If price stays capped beneath ~0.00001100, I favor continuation lower toward the channel base and 0.00000865 support; a decisive reclaim above 0.00001136 would soften the bearish view. Broader momentum is still negative, with repeated rejections and lower lows confirming downside pressure consistent.
⚠️ Risks:
A sustained break back above 0.00001108–0.00001136 could flip the near-term structure and force a squeeze toward 0.0000125–0.0000136.
Broad crypto strength or a sharp BTC rebound can invalidate downside continuation and lift CRYPTOCAP:SHIB with beta.
Headlines or liquidity spikes around memecoins may trigger erratic wicks that pierce the channel before direction resumes.
If this idea resonates with you or you have your own opinion, traders, hit the comments. I’m excited to read your thoughts!

GOLD cooling down, correction or signal of new cycle?Summary
“After three consecutive sessions of declines, gold is experiencing a short-term correction after a rally that has lasted more than two months. Despite falling nearly 6% from its recent peak, the medium-term uptrend remains solid as prices remain above the psychological level of $4,000 per ounce. This move reflects a technical cooling of an overbought market, rather than a fundamental reversal.
With the Fed expected to cut interest rates before the end of the year, geopolitical tensions lingering and the trend of “de-dollarization” spreading, gold continues to play a central role in the global safe-haven portfolio. Investors are now closely watching the price reaction around the $4,000 region, the balance point between short-term profit-taking pressure and medium-term accumulation momentum, while the technical outlook still favors a recovery trend if this support level holds.”
OANDA:XAUUSD corrects after 3-day decline, medium-term uptrend remains strong
Gold has fallen for three consecutive days, marking a technical correction after a long rally. Spot gold was hovering around $4,080/ounce on Tuesday morning, nearly 6% below its recent peak, reflecting a necessary pullback in an overbought market.
The decline comes amid global markets being cautious about the latest developments in US-China trade talks and unclear signals on the Federal Reserve’s interest rate path. Despite short-term pressure, gold remains a central part of the safe-haven portfolio, especially as geopolitical risks increase and major currencies face “soft devaluation” pressure.
Comment: “After a period of excessive growth, gold is correcting like an overstretched spring. The fact that the price is still holding above the $4,000 mark shows that this is a technical cooling process, not a fundamental reversal. The need for safe haven and defensive trades in the Dollar still exists.”
Gold has risen more than 55% year-to-date since mid-August, boosted by expectations of at least a 25 basis point cut by the Fed before the end of the year, along with a trend to hedge against inflation and widening budget deficits. The stability of the US dollar and ETF inflows supported gold prices, while silver and platinum recorded consecutive losses due to profit-taking pressure.
Traders are also focusing on new political-trade signals. US President Trump expressed optimism about a “good deal” at the upcoming meeting with Asian leaders, but admitted that a delay scenario is still possible. This situation has made the market sentiment “cautious but realistically optimistic,”.
The current decline reflects a technical correction, not a trend reversal. With the Fed likely to cut interest rates, persistent geopolitical tensions and the “de-dollarization” trend of some economies, gold remains a pillar in the global safe-haven structure. Investors should monitor the price reaction around the $4,000 mark, the balance point between short-term profit-taking and medium-term accumulation.
Technical outlook analysis of OANDA:XAUUSD
Gold Technical Outlook: Bulls Keep the Initiated Around $4,000
Gold prices are experiencing a short-term but strong correction, after a long rally since mid-August. On the daily chart, the decline has brought the price to test the important support cluster around $4,000–$4,050/oz, corresponding to the Fibonacci 0.618 zone and the MA50 average, which acts as a key “psychological milestone” for the bulls.
The RSI has retreated to near the neutral level of 50, reflecting a temporary cooling rather than a trend reversal. The major trend structure remains clearly bullish, as evidenced by the intact upward price channel.
If the $4,000 zone is maintained, gold is likely to enter an accumulation-recovery phase, with the nearest resistance zones at $4,160–$4,180 (Fibo 0.5) and $4,210–$4,275 (Fibo 0.382–0.236). Conversely, a loss of the $4,000 mark would trigger deeper profit-taking towards the extended support zone of $3,950.
The current correction suggests the market is consolidating its medium-term uptrend, with no signs of breaking the trend. Once sentiment stabilizes around the $4,000 threshold, new buying pressure is likely to return, especially if there are supportive signals from US economic data or expectations of a Fed rate cut.
SELL XAUUSD PRICE 4231 - 4229⚡️
↠↠ Stop Loss 4235
→Take Profit 1 4223
↨
→Take Profit 2 4217
BUY XAUUSD PRICE 4001 - 4003⚡️
↠↠ Stop Loss 3997
→Take Profit 1 4009
↨
→Take Profit 2 4015
The Ultimate GOLD || Intraday Trading Plan (10/23/2025)Welcome to Trade with Decrypters!
DETAILED AND COMPLETE ANALYSIS ( 5 TRADE SETUPS )
Central Bank Buying
Central banks added net 19t in August led by Kazakhstan (14t), Bulgaria and El Salvador, Q3 on pace for 1,000t+ annually up 41% from historical norms. BRICS drivers like China (300t+ YTD) and India's $100B reserves fuel de-dollarization and inflation hedges; Poland reaffirms targets amid risks. Silver links to EV/solar boom (+70% China demand). Outlook: Unfazed 1,000t buys lift prices into 2026.
ETF Inflows & Sentiment
Gold ETFs hit $472B AUM in Q3 (+23% q/q) with $64B YTD inflows, September $17B record led by North America/Europe; Asia minor outflows. Safe-haven rush amid trade wars, minor profit-taking post $4k peak. RSI 75 overbought, $3,900 support holds. Silver +$2B YTD on industry bets. Forecast: Gold $4,200 test, silver $50+.
Macro & Geopolitical Events
Fed Oct cut vs. 2.9% inflation/shutdown-delayed jobs—labor firmer but risks grow.
Trump's China tariffs fuel wars; BRICS stalls de-dollarization but boosts gold; Ukraine/Mideast hikes energy/inflation. Drives 50%+ YTD metals gains; tariffs add 1–2% CPI.
Silver Deficit
Fifth straight deficit at 118M oz in 2025 (down 21% YoY), demand stable 1.20B oz vs supply +3% to 1.05B oz, industrial record 680M+ oz from solar/EVs. Renewables offset jewelry drops
Futures & Options Flow
CME gold OI ~528k contracts, steady amid volumes; CVOL moderate, call/put skew bullish for rate-cut squeezes
Fundamentals & Forecast
Gold +51% to $4,062, silver +43% to $48—via 1,000t+ CB buys, inflation, cuts, 7% GDP deficits. De-dollarization/geo-risks dominate. Projection: Gold $4,400 Q4, silver $57 mid-2026

XAUUSD: 800 Pips Secured, but Is the Correction Really Over?Yesterday, after revisiting the 4,000 support zone as expected and explained in my previous analysis, Gold bounced strongly and tested the area above 4,100.
That rally delivered around 800 pips profit on my long trade, and now the market is showing a mild pullback, consolidating around 4,085.
The key question now:
👉 Is the overall correction over, or is there still more to unfold?
From a technical perspective, as long as 4,000 remains intact, Gold retains its bullish potential toward the 4,200 resistance zone.
However, I prefer to stay patient at the moment — being flat at the time of writing — and will wait for a potential dip toward 4,050 or slightly below.
If the price shows a positive reaction in that area, I’ll consider re-entering long positions.
🎯 Upside targets:
• First: 4,150
• Second: 4,200
Keeping a positive risk-reward balance remains the main priority.
🚀 Let’s see if the market confirms the plan.
