AUDCHF SHORT FROM SUPPLY ZONE|
✅AUDCHF is showing rejection from a major supply zone, suggesting that smart money is preparing for a bearish continuation toward the lower liquidity pool. The setup remains valid while below the supply range. Time Frame 3H.
SHORT🔥
✅Like and subscribe to never miss a new idea!✅
Signals

AUD-CAD Free Signal! Buy!
Hello,Traders!
AUDCAD Price has tapped into a horizontal demand area where smart money buyers are likely positioned. A potential bullish reaction could follow as liquidity gets absorbed from the previous lows.
-------------------
Stop Loss: 0.9059
Take Profit: 0.9079
Entry: 0.9068
Time Frame: 3H
-------------------
Buy!
Comment and subscribe to help us grow!
Check out other forecasts below too!
Disclosure: I am part of Trade Nation's Influencer program and receive a monthly fee for using their TradingView charts in my analysis.

USDCAD FREE SIGNAL|LONG|
✅USDCAD Price has reacted from a clean demand zone where buy-side liquidity was accumulated, showing signs of bullish displacement. A continuation toward the next imbalance is expected.
—————————
Entry: 1.3986
Stop Loss: 1.3975
Take Profit: 1.3999
Time Frame: 2H
Setup Risk: High
—————————
LONG🚀
✅Like and subscribe to never miss a new idea!✅

EUR-USD Local Short! Sell!
Hello,Traders!
EURUSD has reached a horizontal supply area where sellers previously stepped in. A bearish reaction from this zone could trigger a move lower as liquidity from buy-side traders gets taken. Time Frame 5H.
Sell!
Comment and subscribe to help us grow!
Check out other forecasts below too!
Disclosure: I am part of Trade Nation's Influencer program and receive a monthly fee for using their TradingView charts in my analysis.

WTI OIL Strong long-term rebound incoming.Over a month ago (September 17, see chart below), we gave a strong Sell Signal on WTI Oil (USOIL) as the price was again rejected on its 1W MA50 (blue trend-line) and was headed towards the inner Higher Lows trend-line, easily hitting our $59.50 Target in the process:
Yet again we consult the more reliable long-term time-frames, now making a bullish call as the price is already rebounding this week on the Higher Lows. Given also the identical 1W RSI pattern with 2023, we expect a bounce towards at least the 0.618 Fibonacci retracement level at $69.50, same as the December 2023 - March 2024 rally.
-------------------------------------------------------------------------------
** Please LIKE 👍, FOLLOW ✅, SHARE 🙌 and COMMENT ✍ if you enjoy this idea! Also share your ideas and charts in the comments section below! This is best way to keep it relevant, support us, keep the content here free and allow the idea to reach as many people as possible. **
-------------------------------------------------------------------------------
💸💸💸💸💸💸
👇 👇 👇 👇 👇 👇

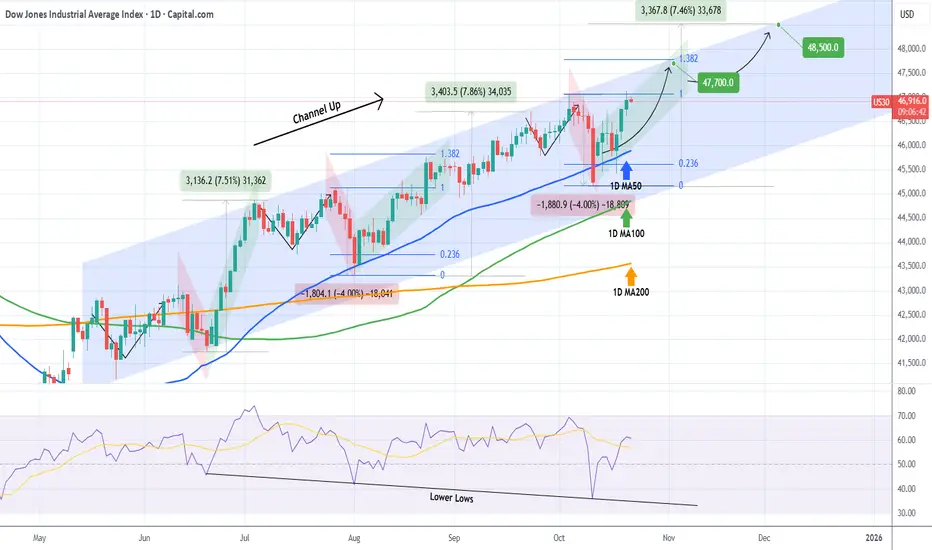
DOW JONES eyes two Bullish Targets before the end of the year.Dow Jones (DJI) has been trading within a 5-month Channel Up and is currently on its new Bullish Leg following the October 10 bounce on its 1D MA50 (blue trend-line).
As you can see, there is a high degree of symmetry between both the Bearish and Bullish Legs within this pattern and if that continues to hold, the immediate Target of the current Bullish Leg is the 1.382 Fibonacci extension at 47700, which we've already mentioned on our previous analysis.
This time however, we also set a second Target towards the end of the year, being a +7.50% rise (standard Leg as you can see) from the bottom at 48500. Both Targets would make ideal technical Higher Highs for the Channel Up.
Notice also how the October 10 bounce took place also on the 1D RSI's Lower Lows trend-line. An additional indication of a strong support for the long-term bullish trend.
-------------------------------------------------------------------------------
** Please LIKE 👍, FOLLOW ✅, SHARE 🙌 and COMMENT ✍ if you enjoy this idea! Also share your ideas and charts in the comments section below! This is best way to keep it relevant, support us, keep the content here free and allow the idea to reach as many people as possible. **
-------------------------------------------------------------------------------
💸💸💸💸💸💸
👇 👇 👇 👇 👇 👇
SILVER Is Bearish! Short!
Please, check our technical outlook for SILVER.
Time Frame: 1D
Current Trend: Bearish
Sentiment: Overbought (based on 7-period RSI)
Forecast: Bearish
The market is trading around a solid horizontal structure 4,794.2.
The above observations make me that the market will inevitably achieve 4,123.0 level.
P.S
The term oversold refers to a condition where an asset has traded lower in price and has the potential for a price bounce.
Overbought refers to market scenarios where the instrument is traded considerably higher than its fair value. Overvaluation is caused by market sentiments when there is positive news.
Like and subscribe and comment my ideas if you enjoy them!

EURUSD Is Very Bearish! Sell!
Here is our detailed technical review for EURUSD.
Time Frame: 2h
Current Trend: Bearish
Sentiment: Overbought (based on 7-period RSI)
Forecast: Bearish
The market is testing a major horizontal structure 1.158.
Taking into consideration the structure & trend analysis, I believe that the market will reach 1.154 level soon.
P.S
We determine oversold/overbought condition with RSI indicator.
When it drops below 30 - the market is considered to be oversold.
When it bounces above 70 - the market is considered to be overbought.
Like and subscribe and comment my ideas if you enjoy them!

USDJPY Is Going Up! Buy!
Take a look at our analysis for USDJPY.
Time Frame: 1D
Current Trend: Bullish
Sentiment: Oversold (based on 7-period RSI)
Forecast: Bullish
The market is approaching a key horizontal level 151.763.
Considering the today's price action, probabilities will be high to see a movement to 154.639.
P.S
Overbought describes a period of time where there has been a significant and consistent upward move in price over a period of time without much pullback.
Like and subscribe and comment my ideas if you enjoy them!

NZDJPY Will Go Up! Long!
Please, check our technical outlook for NZDJPY.
Time Frame: 4h
Current Trend: Bullish
Sentiment: Oversold (based on 7-period RSI)
Forecast: Bullish
The market is approaching a significant support area 86.230.
The underlined horizontal cluster clearly indicates a highly probable bullish movement with target 87.213 level.
P.S
Please, note that an oversold/overbought condition can last for a long time, and therefore being oversold/overbought doesn't mean a price rally will come soon, or at all.
Like and subscribe and comment my ideas if you enjoy them!

USDCHF Is Going Up! Long!
Here is our detailed technical review for USDCHF.
Time Frame: 1h
Current Trend: Bullish
Sentiment: Oversold (based on 7-period RSI)
Forecast: Bullish
The market is on a crucial zone of demand 0.793.
The oversold market condition in a combination with key structure gives us a relatively strong bullish signal with goal 0.796 level.
P.S
Overbought describes a period of time where there has been a significant and consistent upward move in price over a period of time without much pullback.
Like and subscribe and comment my ideas if you enjoy them!

TRON on its absolute Bull Cycle Support. Can it hold?Tron (TRXUSD) is on its 3rd straight week trading on the 1W MA20 (red trend-line). In fact that level has held and closed both previous 1W candles above it, despite getting breached marginally.
The current Bull Cycle since the November 2022 bottom, has been dominated entirely by a Channel Up, that only broke once on the December 2024 massive spike. Besides that, it has been using the 1W MA20 as its pull-back and buy signal. The zone it has created along with the 1W MA50 (blue trend-line) has been the ultimate Buy Zone of this pattern.
As a result, this is technically a strong Buy Signal for TRX, most likely targeting 0.47000, representing a +60.48% rise, which has been the minimum Bullish Leg rise within this Channel Up.
If however it breaks below its 1W MA50, we will have the strongest confirmation that the new Bear Cycle has technically begun, and the first Target would be 0.16000, potentially going for a contact with its 1W MA200 (orange trend-line).
-------------------------------------------------------------------------------
** Please LIKE 👍, FOLLOW ✅, SHARE 🙌 and COMMENT ✍ if you enjoy this idea! Also share your ideas and charts in the comments section below! This is best way to keep it relevant, support us, keep the content here free and allow the idea to reach as many people as possible. **
-------------------------------------------------------------------------------
💸💸💸💸💸💸
👇 👇 👇 👇 👇 👇

Lingrid | GBPJPY False Channel Break Bearish SignThe price perfectly fulfilled my previous idea . FX:GBPJPY faded from the 202.6–203.0 supply, slipping back beneath the red downtrend and eyeing the mid-range support at 201.45. Structurally, price printed a lower high at the trendline, then failed a breakout from the rising trendline, keeping it inside the broader descending channel. If 202.6/203.0 isn’t reclaimed, I expect continuation toward 201.45 and potentially 200.63; a clean reclaim above 203.0 would invalidate and re-open 204.5. Broader momentum still shows lower highs within a down-channel, and the recent false break reinforces the sell-side control until higher-timeframe support changes that.
⚠️ Risks:
A sudden risk-on shift or yen weakness from BOJ headlines could fuel a squeeze back above 203.0.
UK/JP data surprises or central bank commentary may whipsaw price around the trendline.
A sharp drop in US yields could undermine JPY strength and negate the bearish setup.
If this idea resonates with you or you have your own opinion, traders, hit the comments. I’m excited to read your thoughts!

Lingrid | AVAXUSDT Pullback Sell Downside ExtensionBINANCE:AVAXUSDT is showing rejection from the confluence of the downward trendline and the $20 psychological zone, confirming sellers' control in the short term. The structure remains within a bearish channel with a lower-high formation maintaining downside pressure. Price may retest $20 before extending losses toward $17.5 if momentum weakens further. This retracement aligns with the broader descending structure visible since mid-October, keeping bias bearish for now.
⚠️ Risks:
Break above $20.5 could invalidate the current bearish setup.
Strong BTC recovery may support short-term upside correction.
Lower volatility could delay breakdown confirmation below $18.
If this idea resonates with you or you have your own opinion, traders, hit the comments. I’m excited to read your thoughts!

Attractive Bullish Gold SetupHey, it’s Erik!
XAUUSD is currently in a fascinating phase. After a strong pullback from the upper boundary of the ascending channel, gold is now heading toward the lower boundary. This region aligns with a key support zone, and a potential reaction here could propel the price back upward.
If buyers manage to defend this level, the potential for a rise to $4,380 is significant. This level coincides with the middle of the channel and previous resistance, making it a logical short-term target in this bullish market structure.
However, there’s an important caveat. If the market fails to hold this support, the bullish scenario could lose its validity, and we might see a continuation of the downward trend. That’s why it’s crucial to wait for clear confirmation before entering. A rejection wick, increased buying volume, or a bullish engulfing pattern are all key technical signals to watch for the right entry point.
So, what do you think? Ready to seize this opportunity, or do you see other risks? Share your thoughts with us!

Gold – 24 Hours of Chaos: From 4400 to 4000The last 24 hours in Gold trading were absolutely insane. After retesting the 4400 zone all-time high last night, XAUUSD literally collapsed, dropping straight to the 4000 zone in just one day — a 10% move that’s unheard of for gold (at least I haven't seen).
1️⃣ Technical Picture
Once the price broke back below 4200, it confirmed a double top formation, and the selloff accelerated dramatically toward its measured target around 4000 — a level also supported by the ascending trendline that started in late August.
2️⃣ Current Context
At the time of writing, gold already rebounded nearly 1300 pips from the low, which means there’s no attractive level to enter long right now, even though the recovery might continue in the short term.
3️⃣ Key Levels to Watch
• Resistance: 4200 zone – now turned into a major resistance. If the price revisits this level, I’ll be looking for short setups, ideally on intraday spikes.
• Support: 4000 zone – if the price dips again before testing resistance, it could offer long opportunities from this confluence area.
4️⃣ Trading Plan
In short, we’re in a wide range between 4000 and 4200, both levels offering potential trades but in opposite directions. For now, I’ll stay patient and wait for price to get closer to one of these extremes before taking action.
⚠️ Final Note
Volatility is off the charts, so if you decide to trade XAUUSD these days, adjust your stop losses and targets accordingly. This is not the time for tight stops, is time for patience, and flexibility. 🚀

GOLD fell nearly $300, the biggest one-day drop since 2021The precious metals market witnessed a sharp decline in the trading session on Tuesday (October 21), when the spot gold price fell more than 5%, marking the sharpest decline in 4 years. This correction came after many consecutive weeks of increase, when gold continuously set new peaks and reached overbought levels on technical indicators.
As of the time of recording, the spot gold price decreased by 5.21% to 4,129.05 USD/ounce, after falling below the 4,100 USD/ounce mark at one point, meaning a loss of nearly 300 USD compared to the highest level of the day. Previously, on Monday, gold had peaked at about 4,381.52 USD/ounce, before turning down nearly 3.8%.
Strong Dollar Slows Gains
The stronger US Dollar has made dollar-denominated gold more expensive, weighing on demand.
Weakening safe-haven sentiment has also contributed to the sell-off. Expectations of a meeting between US President Donald Trump and Chinese President Xi Jinping next week to ease trade tensions have dampened demand for the precious metal. In addition, the peak gold buying season in India, one of the world’s largest consumer markets, has ended, dampening physical demand.
Markets lose position data, volatility soars
The partial U.S. government shutdown has left traders without access to the Commodity Futures Trading Commission’s (CFTC) weekly speculative positioning report, data used to measure hedge fund participation in gold and silver contracts. The lack of positioning data makes the market more sensitive, especially when speculative buying increases during volatile times.
The volatility has pushed short-term volatility in the precious metal to its highest level in months. Options trading volume on the world’s largest gold ETF exceeded 2 million contracts for two consecutive sessions, a new record, suggesting investors are rushing to hedge or take advantage of volatility to seek profits.
Experts warn of the risk of a deeper correction
According to Bloomberg Intelligence strategists, gold ETF holdings are still below historic highs, suggesting there is still room for a bull run. However, they warn that “every rally has its limits,” and that excessive speculative buying often turns into selling pressure when economic data improves.
“If upcoming economic reports show a stronger-than-expected U.S. economy, a deeper correction in gold is entirely possible,” the report said.
Silver also under pressure after a strong run
Silver, the metal, has risen nearly 80% since the start of the year thanks to tight supplies and rising investment demand that has followed gold’s slide. The widening price gap between London and New York has prompted traders to move the metal to the UK to ease supply and demand pressures.
According to exchange data, treasuries linked to the Shanghai Futures Exchange recorded the largest silver withdrawals since February, while inventories in New York continued to fall, reflecting a restructuring of global supply amid the market correction.
In short, after a long rally and high expectations, the gold market is entering a “necessary cooling” phase. While the long-term trend is still supported by geopolitical risks and loose monetary policy, short-term volatility is likely to remain high as the market reassesses yield expectations, inflation and the health of the US economy.
Technical Analysis OANDA:XAUUSD
The daily chart of gold shows that after a strong increase to the peak around 4,380 - 4,400 USD/ounce, the price has entered a rather deep technical correction phase, touching the Fibonacci support zone of 0.618 around 4,110 USD/ounce corresponding to the EMA21 line.
The strong bearish candle has been partially absorbed, indicating that the selling pressure is weakening and the downward momentum is showing signs of slowing down.
The RSI indicator has escaped the overbought zone and is approaching the neutral level (50), reflecting the state of re-accumulation after the correction. As long as the price remains above the 4,036 - 4,110 USD/ounce zone, the medium-term bullish structure has not been broken.
Overall, gold is in a "breathing" phase after a steep increase, and if it holds support at $4,110/ounce, the prospect of returning to the main uptrend in the coming weeks is very positive.
SELL XAUUSD PRICE 4231 - 4229⚡️
↠↠ Stop Loss 4235
→Take Profit 1 4223
↨
→Take Profit 2 4217
BUY XAUUSD PRICE 3949 - 3951⚡️
↠↠ Stop Loss 3945
→Take Profit 1 3957
↨
→Take Profit 2 3963

BTCUSD Completes Correction – Heading Towards $125,000BINANCE:BTCUSD is currently trading in a well-defined ascending channel, indicating that the bullish trend continues. The price is following the channel's structure, creating higher highs and higher lows, which is a clear sign that the uptrend remains intact. The recent price correction shows a healthy pullback, which could serve as the foundation for the next upward move.
The price is now approaching an important support zone, marked by the lower boundary of the channel and a previous demand zone. If this support holds, it could present an opportunity for buyers to re-enter with strength. The expected target is $125,000 , aligning with the middle of the channel and the previous resistance level.
As long as the price remains above the support zone and the ascending trendline, the bullish scenario remains valid. However, if the price breaks below this level, it could invalidate the current setup and increase the likelihood of a deeper correction.
Always ensure you confirm your setups and trade with proper risk management.
Good luck!

SPY FREE SIGNAL|SHORT|
✅SPY is reacting from the all-time-high zone where institutional orders previously accumulated. A short-term retracement is likely as price sweeps liquidity above premium highs before rebalancing to the nearest fair-value gap. Time Frame 2H.
SHORT🔥
✅Like and subscribe to never miss a new idea!✅

USDJPY Long #confluence country #trade the stacks. OANDA:USDJPY
Fundamental: Bullish (5)
Technical: Bullish (6/7) — actionable threshold met (≥6)
20-word summary: Dollar-yen supported by rate differentials; EMAs aligned; momentum constructive; watch 152 zone and intervention risk while trend persists this week.
Actionable Trade (Long): ATR 1.181 → SL distance 1.79512; Stop 150.08088; TP 156.54331 (2.6R).

NATGAS Short From Supply Area! Sell!
b]Hello,Traders!
NATGAS is approaching a major horizontal supply area, where strong selling pressure may reappear. A rejection from this zone could trigger a short-term correction toward lower liquidity pools. Time Frame 5H.
Sell!
Comment and subscribe to help us grow!
Check out other forecasts below too!
Disclosure: I am part of Trade Nation's Influencer program and receive a monthly fee for using their TradingView charts in my analysis.

EURGBP REBOUND AHEAD|LONG|
✅EURGBP is respecting the ascending trendline, showing signs of institutional accumulation near the dynamic support. A potential move toward 0.8690 is anticipated as liquidity builds above the recent highs. Time Frame 2H.
LONG🚀
✅Like and subscribe to never miss a new idea!✅

USDJPY Had its 1st 1D Golden Cross since Dec 2024.The USDJPY pair has been trading within a Channel Up pattern since the April 22 2025 market bottom and just last week, it formed the first 1D Golden Cross since December 16 2024. As you can see, all three 1D Golden Crosses since June 2023 have been strong Buy Signals.
All have been formed within Channel Up patterns that formed Higher Highs just after the crosses. The target of the current Channel Up is 154.000, which represents a +6.06% rise, similar to both previous Bullish Legs of this pattern. The uptrend is so far restricted by the presence of the Lower Highs trend-line that started back on the July 03 2024 market Top.
This time however we may see this break as the 1W RSI has already broken above its own Lower Highs trend-line, signaling an early bullish warning. As a result, if the July 2024 Lower Highs trend-line breaks, we expect the pair to eye the upper Resistance at 159.000.
-------------------------------------------------------------------------------
** Please LIKE 👍, FOLLOW ✅, SHARE 🙌 and COMMENT ✍ if you enjoy this idea! Also share your ideas and charts in the comments section below! This is best way to keep it relevant, support us, keep the content here free and allow the idea to reach as many people as possible. **
-------------------------------------------------------------------------------
💸💸💸💸💸💸
👇 👇 👇 👇 👇 👇
