GOLD Is Bearish! Short!
Take a look at our analysis for GOLD.
Time Frame: 4h
Current Trend: Bearish
Sentiment: Overbought (based on 7-period RSI)
Forecast: Bearish
The price is testing a key resistance 4,338.72.
Taking into consideration the current market trend & overbought RSI, chances will be high to see a bearish movement to the downside at least to 4,203.99 level.
P.S
We determine oversold/overbought condition with RSI indicator.
When it drops below 30 - the market is considered to be oversold.
When it bounces above 70 - the market is considered to be overbought.
Like and subscribe and comment my ideas if you enjoy them!
Signals

EURUSD Is Very Bearish! Sell!
Please, check our technical outlook for EURUSD.
Time Frame: 1D
Current Trend: Bearish
Sentiment: Overbought (based on 7-period RSI)
Forecast: Bearish
The market is trading around a solid horizontal structure 1.169.
The above observations make me that the market will inevitably achieve 1.146 level.
P.S
Overbought describes a period of time where there has been a significant and consistent upward move in price over a period of time without much pullback.
Like and subscribe and comment my ideas if you enjoy them!

GBPUSD Is Going Up! Long!
Here is our detailed technical review for GBPUSD.
Time Frame: 1D
Current Trend: Bullish
Sentiment: Oversold (based on 7-period RSI)
Forecast: Bullish
The market is testing a major horizontal structure 1.343.
Taking into consideration the structure & trend analysis, I believe that the market will reach 1.365 level soon.
P.S
Please, note that an oversold/overbought condition can last for a long time, and therefore being oversold/overbought doesn't mean a price rally will come soon, or at all.
Like and subscribe and comment my ideas if you enjoy them!

GBPCAD Will Fall! Short!
Take a look at our analysis for GBPCAD.
Time Frame: 1D
Current Trend: Bearish
Sentiment: Overbought (based on 7-period RSI)
Forecast: Bearish
The market is approaching a key horizontal level 1.885.
Considering the today's price action, probabilities will be high to see a movement to 1.870.
P.S
The term oversold refers to a condition where an asset has traded lower in price and has the potential for a price bounce.
Overbought refers to market scenarios where the instrument is traded considerably higher than its fair value. Overvaluation is caused by market sentiments when there is positive news.
Like and subscribe and comment my ideas if you enjoy them!

XRPUSD Bearish Cross pushing it down to $1.9350 t least.XRP (XRPUSD) has been trading within a Channel Up for almost 1 year (since November 26 2024) and just before last Friday's flash crash, it formed a 1D MA50/100 Bearish Cross. This came after the pattern has already started its 2nd Bearish Leg (red Channel).
The last 1D MA50/100 Bearish Cross was formed post half-way through the previous Bearish Leg and resulted into a bottom just below the 0.786 Fibonacci retracement level. Since there are no news in the market that can drastically alter the bearish sentiment following the renewed U.S. - China trade tensions, we have no reason to expect that the current Bearish Leg won't reach again the bottom of the Channel Up at least.
Our Target is therefore 1.9350 (marginally below the 0.786 Fib). If the Bearish Leg repeats the % drop of the previous one (-52.42%), it can even break to 1.7500 (still within the Channel Up on a logarithmic scale). A break above the 1D MA100 (green trend-line) would invalidate this bearish structure.
-------------------------------------------------------------------------------
** Please LIKE 👍, FOLLOW ✅, SHARE 🙌 and COMMENT ✍ if you enjoy this idea! Also share your ideas and charts in the comments section below! This is best way to keep it relevant, support us, keep the content here free and allow the idea to reach as many people as possible. **
-------------------------------------------------------------------------------
💸💸💸💸💸💸
👇 👇 👇 👇 👇 👇

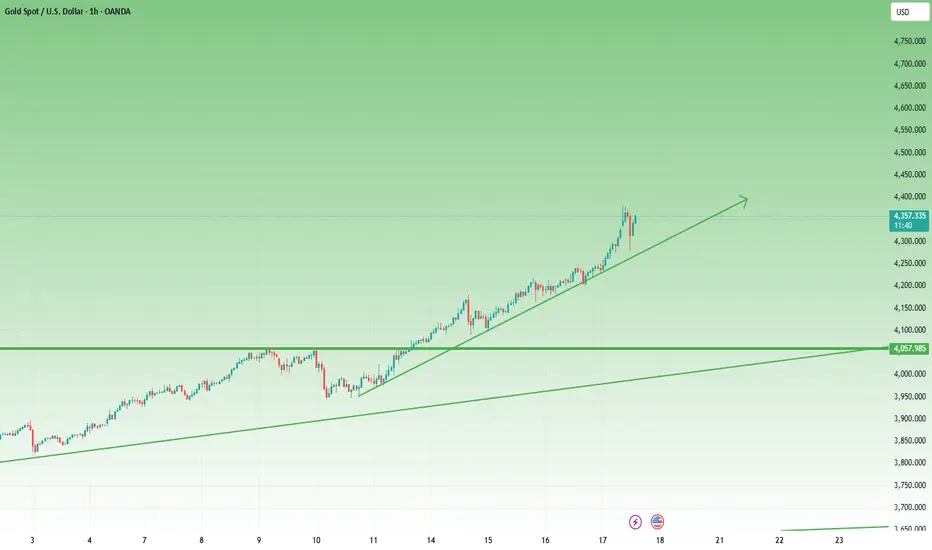
Lingrid | GOLD Consolidation - Breakout - Momentum TradeThe price perfectly fulfilled my previous idea . OANDA:XAUUSD recently made new all-time high inside a steep upward channel, maintaining strong bullish momentum. The structure suggests a healthy correction phase forming a short-term range above the 4,280 support zone. As long as the price remains above the upward trendline, the bullish structure remains intact with potential continuation toward 4,450 and higher. The ongoing range formation may serve as consolidation before the next impulsive breakout higher.
⚠️ Risks:
A sustained break below 4,280 could trigger a deeper correction.
Rising U.S. yields or hawkish Fed comments may weigh on gold prices.
Reduced geopolitical tension could cool safe-haven demand.
If this idea resonates with you or you have your own opinion, traders, hit the comments. I’m excited to read your thoughts!

Lingrid | EURAUD Failed Break Resistance Fade TradeThe price perfectly fulfilled my previous idea . FX:EURAUD surged strongly after rebounding from the double-bottom setup, completing an A-B-C bullish correction into the resistance area near 1.820. The structure now shows signs of exhaustion after a fake breakout above the psychological level, suggesting a potential short setup. Price remains within an upward channel but has started to lose momentum near the upper boundary. A failure to sustain above 1.8200 could confirm a pullback toward the 1.800 support zone.
⚠️ Risks:
A break and close above 1.820 could invalidate the short setup.
Unexpected AUD weakness from macro data could trigger renewed buying.
Broader risk-on sentiment may support continued bullish pressure.
If this idea resonates with you or you have your own opinion, traders, hit the comments. I’m excited to read your thoughts!

Lingrid | TONUSDT Bearish Formation Short OpportunityOKX:TONUSDT price faced resistance within the descending triangle pattern and rejected near the downward trendline, signaling continuation of its bearish structure. The pair is now hovering just above the 2.10 level, testing the lower range boundary inside the upward channel. A confirmed break below 2.10 could open the way toward 2.00 psychological support as sellers regain control. The overall pattern indicates persistent pressure with a potential retest of deeper support before any sustained recovery attempt.
⚠️ Risks:
A bullish reversal in BTC or broader crypto sentiment could invalidate the bearish setup.
Failure to break below 2.10 may trigger a temporary short squeeze.
Positive macro or regulatory news could shift momentum upward prematurely.
If this idea resonates with you or you have your own opinion, traders, hit the comments. I’m excited to read your thoughts!

Gold – Madness in MotionGold rose this week — so far (and I really want to stress so far ) — by around 10%. That’s massive by any standard.
On Monday, I tried to catch a dip and missed it. Since Tuesday, I’ve been on the sell side — completely wrong on direction , yet somehow still managed to finish positive overall.
Yesterday my stop got hit, but after what happened overnight, it turned out to be just a scratch. With this kind of volatility, a recovery of 250pips can happen in ten minutes.
Looking at the chart — it’s bullish, no question. Should it be bought? Hmmmm...
Looking at the volatility… for me, it’s become untradeable.
Can it keep going higher? Of course.
How high? Nobody knows.
At this point, any prediction is just throwing numbers in the air.
Trading corrections, as I’ve tried to do, is a guessing game. I’ve had some luck so far, but after yesterday's stop loss, I’m stepping aside.
My take: stay out. Let others make money if they can.
A 1,000-pip rise and an equal reversal — all while I was asleep (and trust me, I sleep very little) — is too crazy. Stops can be wiped for bulls just as easily as for bears.
At some point, it will settle down and define its levels.
Until then — it’s not for me anymore.
GOLD sets new record amid global risk waveSpot OANDA:XAUUSD continued to break out in the Asian trading session on Thursday morning (October 16), hitting a record high of $4,239.07/ounce, as investors increasingly sought the precious metal as a safe haven from increasingly complex fluctuations in the global economy.
In the previous session, gold closed at $4,207.85/ounce, up $65.94 (equivalent to 1.59%), and continued to increase by more than $25 today. Since the beginning of the week, gold prices have increased by nearly 5%, continuing a strong upward trend since mid-August.
The rise in gold prices comes as the US Federal Reserve (Fed) signals it will maintain its easy monetary policy path. Speaking this week, Fed Chairman Jerome Powell said the central bank is “on track” to cut its benchmark interest rate by another 0.25% later this month, in response to signs of weakening growth and external uncertainty. Lower borrowing costs typically increase the appeal of non-yielding gold compared to bonds and currencies.
Meanwhile, US President Donald Trump’s latest comments have added to the market’s tension. Responding to a reporter’s question about trade relations with China, Mr. Trump said: “Yes, we are in a trade war right now.”
This statement, quoted by Bloomberg News, has raised concerns about long-term damage to the global economy, a factor that often drives capital flows to safe-haven assets such as gold.
In addition, the risk of a US government shutdown and the “downdraft effect” when investors simultaneously sell bonds and foreign currencies to switch to holding gold and safe-haven assets, further strengthening the precious metal’s price increase.
Strong central bank gold buying has also played a significant role in the rally. Personally, I believe that much of this year’s rally has been “driven by physical demand”, as many central banks “aggressively add to reserves to hedge against sovereign debt risks and expansionary monetary policies”.
So far, gold prices have risen more than 60% in 2025, reflecting a clear shift in global investment thinking, where gold has once again asserted its central role as a source of financial confidence in times of political and monetary uncertainty.
Technical Analysis OANDA:XAUUSD
Spot XAUUUSD continues to maintain a strong uptrend, currently trading around $4,239/ounce, up nearly 0.75% on the day and approaching the 0.618 Fibonacci resistance zone at $4,213 – $4,286, corresponding to the top of the short-term rising channel.
Trend Structure
• The medium-term uptrend remains solid, with a series of steadily rising candles and the MA50 maintaining a strong upward slope, reinforcing the bullish momentum.
• The uptrend channel remains effective, with prices currently hovering at the upper boundary of the channel, indicating that the buying momentum is too strong in the short term.
• The RSI remains above 70, indicating a technically overbought state, but there is no clear reversal signal yet; this usually signals a slight correction before the uptrend continues.
Key Technical Zones
• Resistance: 4.286 (0.786 Fib) and 4.378 (100% extension target).
• Support: 4.162 (0.5 Fib), 4.059 (old confluence – dynamic support), further 3.947 (balance).
Intraday Scenario
• The main trend remains bullish, but the risk of a short-term correction increases as prices approach the Fibonacci resistance zone.
• Day traders can wait for a buyback around $4,160 – $4,180, the confluence between the 0.5 Fib and the midline of the rising channel, where bottom-fishing buying is likely to emerge.
• The short-term target is $4,280 – $4,300/oz, corresponding to the upper boundary of the rising channel.
• Technical stop-loss should be placed below $4,050 (psychological support and short-term MA).
Overview
Speculative money still dominates, but the market is showing signs of needing a “technical breather” to consolidate the new price base. In the context of the Fed easing signals and escalating geopolitical tensions, the main uptrend of gold is not yet threatened, but short-term trading should prioritize the strategy of buying on corrections instead of chasing high prices.
SELL XAUUSD PRICE 4298 - 4296⚡️
↠↠ Stop Loss 4302
→Take Profit 1 4290
↨
→Take Profit 2 4284
BUY XAUUSD PRICE 4144 - 4146⚡️
↠↠ Stop Loss 4140
→Take Profit 1 4152
↨
→Take Profit 2 4158

XAUUSD: Detecting the Rising Wedge PatternOANDA:XAUUSD has experienced a significant rise recently, but we are currently seeing the formation of a Rising Wedge pattern, which often signals buyer exhaustion and a potential reversal toward a bearish trend. As the structure tightens near the top, the upward momentum starts to weaken, indicating that the buying pressure is fading.
A strong breakout below the trendline would confirm selling pressure and could signal a move toward the 4,130 level. However, until that happens, patience is key. It’s important to wait for a clear breakout with high volume to avoid false signals.
In summary, don’t rush into the market too early. Caution and waiting for a clear signal are essential to maximize your chances of success. Best of luck and happy trading!

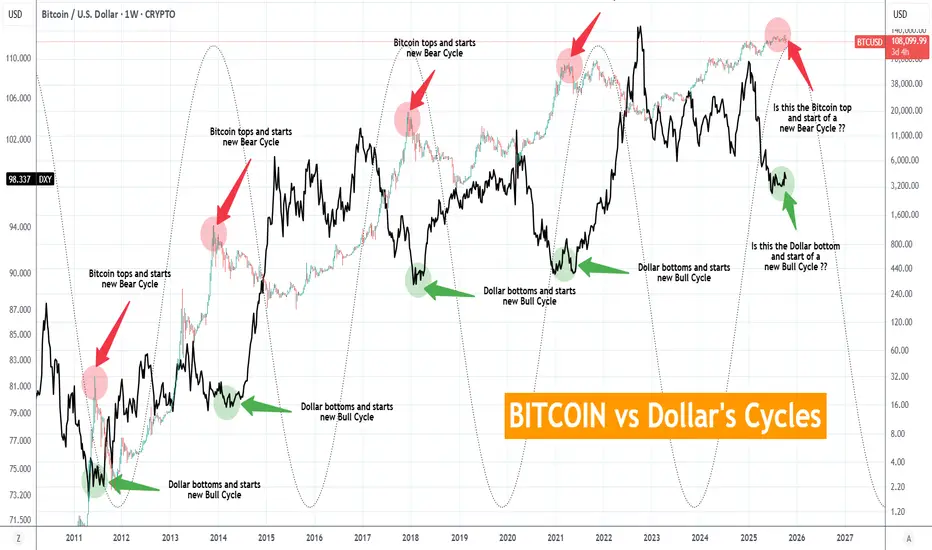
BITCOIN vs Dollar's Cycles. Has the new BTC Bear Cycle started?This is as simple as it can get. And obviously, it is not the first time we give you this chart. This is a cross-asset comparison between Bitcoin (BTCUSD) and the U.S. Dollar Index (DXY) illustrated by the black trend-line. It represents the Cycles of the two assets, typically negatively correlated across the span of 15 years.
As you can see, when the USD bottoms and starts a new Bull Cycle, BTC tops and starts a new Bear Cycle. Similarly vice versa with USD's Bull Cycle tops against BTC's Bear Cycle bottoms.
So the million dollar question is whether the USD has bottomed again. Based on the 4-year Cycle Model and as the Sine Waves illustrate on this chart, it may have. It is no surprise that while the DXY has formed Higher Lows since July 07, BTC has topped and turned sideways on ranged trading with a new Low made on last Friday's crash.
It is not necessary for the USD to break upwards aggressively in order for BTC to start dropping aggressively into its new Bear Cycle. As Jan - March 2018, Jan - March 2013 and May - August 2011 have shown, the USD may range sideways, as long as it is a clear sign of bottom formation, while Bitcoin is already into its Bear Cycle.
So the conclusion is that as long as the USD keeps trading sideways without making a new Low, it is quite like for Bitcoin to be entering its new Bear Cycle. Sound planning, calculated profit taking and gradual (to say the least) de-risking may be required.
So do you think Bitcoin's new Bear Cycle has started? Feel free to let us know in the comments section below!
-------------------------------------------------------------------------------
** Please LIKE 👍, FOLLOW ✅, SHARE 🙌 and COMMENT ✍ if you enjoy this idea! Also share your ideas and charts in the comments section below! This is best way to keep it relevant, support us, keep the content here free and allow the idea to reach as many people as possible. **
-------------------------------------------------------------------------------
💸💸💸💸💸💸
👇 👇 👇 👇 👇 👇
BITCOIN FREE SIGNAL|LONG|
✅BTCUSD has tapped into a major demand zone and printed a bullish shift in structure, suggesting smart money accumulation before expansion. A strong move toward the next liquidity pool is expected.
—————————
Entry: 108,454$
Stop Loss: 107,062$
Take Profit: 110,895$
Time Frame: 6H
Setup Risk: High
—————————
LONG🚀
✅Like and subscribe to never miss a new idea!✅

100% UPSIDE Precious Metals Playbook — Gold, Silver & Miners ETF🏛️ Precious Metals Playbook — Gold, Silver & Miners ETFs
🔑 Executive Summary
• We combine the 2026 parabolic metals thesis gold/silver/platinum with leveraged ETF implementation to target triple-digit portfolio upside under view that gold’s bull run continues into 2026 $5,500–$6,500/oz.
• Miners’ torque has been massive in 2025: GDX ~+123% YTD while gold itself is up ~51% YTD; levered miners e.g., NUGT, JNUG, GDXU show ~360–700%+ YTD — confirming high beta to metal.
• Implementation below caps any single ETF at 10% within 10–20% limit and keeps ≥50% of the book in 2×–3× products for upside torque while diversifying across metal vs. miners and gold vs. silver.
________________________________________
🌍 Market View Condensed
• Gold: Momentum + macro easing bias, softer USD, central-bank demand support the “second-leg melt-up” case into 2026; miners’ margin torque can deliver 2–3× metal beta.
• Silver: Structural deficits + PV/EV/datacenter demand have super-charged silver miners in 2025.
________________________________________
📊 2025 YTD Scorecard Key ETFs
• Gold metal (unlevered): GLD +50.9% YTD.
• Gold miners (unlevered): GDX ~+123% YTD.
• Silver miners (unlevered): SIL ~+137% YTD.
• Leveraged miners:
o NUGT (2× miners) ~+361% YTD; JNUG (2× juniors) ~+394% YTD.
o GDXU (3× miners ETN) ~+706% YTD (top performer cohort of 2025).
• Leveraged gold & silver metals: UGL (2× gold) ~+125% YTD; DGP (2× gold ETN) ~+123% YTD; AGQ (2× silver) ~+159% YTD.
________________________________________
🧩 Portfolio Construction Target book: $100,000
Constraints honored: max 10% per ETF, ≥50% allocation to 2×/3× ETFs.
🎯 Target Allocation 60% leveraged / 40% unlevered
Leveraged — 60% total
• 10% GDXU 3× gold miners ETN
• 10% NUGT 2× gold miners
• 10% JNUG 2× junior gold miners
• 10% AGQ 2× silver
• 10% UGL 2× gold
• 10% DGP 2× gold ETN
Rationale: diversify torque across miners vs. metals, 2× vs. 3×, and gold vs. silver to avoid single-product concentration risk.
Unlevered — 40% total
• 10% GDX VanEck Gold Miners
• 10% GLD SPDR Gold Trust
• 10% SIL Global X Silver Miners
• 10% SLV (or) IAU silver or gold bullion, choose per preference
Rationale: ballast and liquidity; preserves exposure if volatility in levered products forces risk-off.
Dollar mapping (@ $100k):
• Each 10% line = $10,000 notional; 10 tickers → $100,000 fully invested.
________________________________________
📈 Scenario Analysis Hypothetical, path-dependent
Gold advances toward $5,500–$6,500 by 2026. We translate that into rough upside bands using historical betas and allowing for daily-reset drag on leveraged products.
• Base case +100% portfolio:
o Gold +40–60% from here; 2× gold funds net ~+70–110% conservative for compounding/decay.
o GDX sensitivity ~2–3× metal → ~+80–150%; 2× miners ~+160–300%; 3× miners can overshoot in trending tapes.
o With 60% in levered assets and 40% in unlevered miners/metals, blended outcome can land near ~+100% if trends persist and volatility stays manageable.
• Stretch case +200% portfolio:
o If the “second-leg melt-up” plays out momentum + flows + central-bank bid and miners’ margins expand, levered miners dominate returns similar to 2025 YTD pattern.
o Portfolio hits ~+200% if miners continue to over-beta the metal and 3× exposure compounds favorably no major whipsaws.
Risk reality check: Leveraged ETFs reset daily; high volatility or choppy reversals can erode returns even if the long-term trend is up. Position sizing 10% lines and diversification across instruments help mitigate single-name decay risk.
________________________________________
🧭 Implementation Notes
• Execution: stage entries over several days reduce gap/vol risk, prioritize liquid hours; use stop-loss/hedge bands on the 3× sleeve.
• Rebalancing: monthly bands ±3–5% per line to defend the 60/40 torque mix.
• Risk budget: expect 3× ETN drawdowns >60% in sharp pullbacks; keep dry powder OR pre-define risk limits.
________________________________________
🗂️ Product Appendix — Quick Stats
• GDXU (3× miners ETN): ~+706% YTD; ER ~0.95%.
• NUGT (2× miners): ~+361% YTD.
• JNUG (2× junior miners): ~+394% YTD.
• AGQ (2× silver): ~+159% YTD.
• UGL (2× gold): ~+125% YTD.
• DGP (2× gold ETN): ~+123% YTD.
• GDX (miners): ~+123% YTD.
• SIL (silver miners): ~+137% YTD.
• GLD (gold): ~+50.9% YTD.
________________________________________
⚠️ Disclosures & Risks
Leveraged ETFs/ETNs are short-term trading tools with daily reset/compounding; they can significantly underperform their leverage multiple over holding periods with high volatility or mean-reversion. ETNs (e.g., GDXU, DGP) also carry issuer credit risk. This memo is informational, not investment advice; consider your risk tolerance, liquidity needs, and tax/ETN suitability.

Doge- Support turned resistance. What's next?Friday’s crash took DOGE below two key support zones —
first, the ascending trendline around 0.23,
and then the horizontal support near 0.21.
After the drop, DOGE attempted a recovery that only brought it back to retest the broken 0.21 level, which has now turned into resistance. The price has since started to roll back down.
At this stage, if the negative sentiment across the crypto market continues, the probability of a deeper correction remains high — with the next significant target around 0.15.
Only a sustained move above 0.21 would neutralize this bearish scenario and open the path for a potential rebound.

BTC - Another Wick Down to 35,000Per this parallel ascending Channel breakdown - expect another large wick to the downside.
Short Entry - 111,200 to 112,500
Stop Loss - 112,700
Target 1 - 97,350
Target 2 - 64,700
Target 3 - 36,100
This is the first wick down of a 3 wave corrective movement.
I will break the trade down into smaller segments.
For the larger idea see related post “Ultimate Swing Short”
- DD

GBPCAD STRONG BREAKOUT|LONG|
✅GBPCAD has confirmed an ICT-style bullish breakout above the key level, showing strong displacement and market structure shift. A possible retest of the breaker block could offer continuation toward the 1.8920$ target. Time Frame 5H.
LONG🚀
✅Like and subscribe to never miss a new idea!✅

GBP-NZD Strong Bullish Bias! Buy!
Hello,Traders!
GBPNZD has confirmed a bullish breakout above the horizontal demand area. SMC structure remains intact, and price is likely to retest the breakout zone before heading toward the 2.36$ target level. Time Frame 10H.
Buy!
Comment and subscribe to help us grow!
Check out other forecasts below too!
Disclosure: I am part of Trade Nation's Influencer program and receive a monthly fee for using their TradingView charts in my analysis.

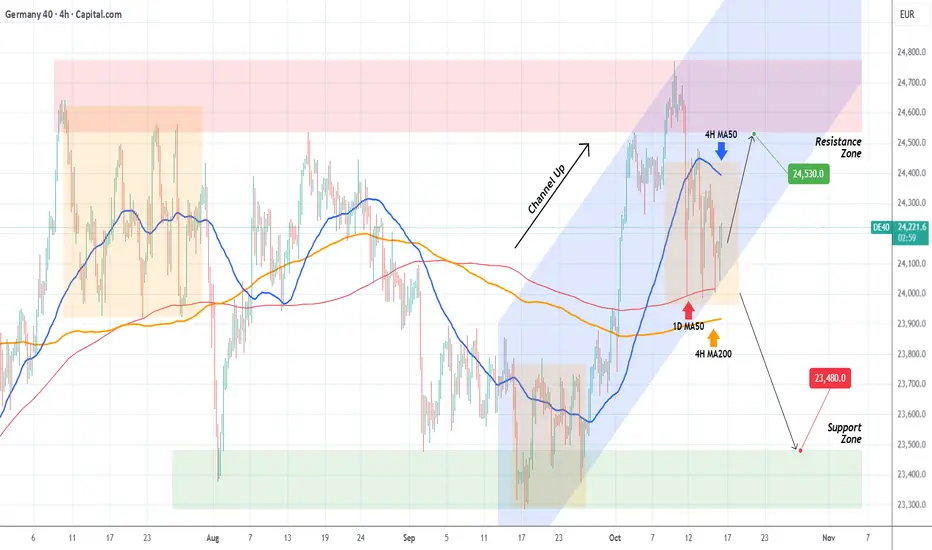
DAX Bullish as long as the 1D MA50 holds.DAX (DE40) has been trading within a 1-month Channel Up and tested today its 1D MA50 (red trend-line) for the 3rd time in the last 6 days.
As long as this holds, we expect a rebound targeting at least the bottom of the Resistance Zone at 24530. A break (and 1D candle close) below the 1D MA50 however, targets at least the top of the Support Zone at 23480.
-------------------------------------------------------------------------------
** Please LIKE 👍, FOLLOW ✅, SHARE 🙌 and COMMENT ✍ if you enjoy this idea! Also share your ideas and charts in the comments section below! This is best way to keep it relevant, support us, keep the content here free and allow the idea to reach as many people as possible. **
-------------------------------------------------------------------------------
💸💸💸💸💸💸
👇 👇 👇 👇 👇 👇
EURGBP LONG FROM TRENDLINE|
✅EURGBP continues to respect its bullish ICT market structure, tapping into the ascending trendline and forming new buy-side liquidity. Expect a reaction from this demand trendline toward 0.8690$. Time Frame 5H.
LONG🚀
✅Like and subscribe to never miss a new idea!✅

USD-CAD Will Keep Growing! Buy!
b]Hello,Traders!
USDCAD is holding firmly above the horizontal demand area, showing bullish SMC structure and continuation potential. A retest of the demand zone could attract more buyers toward the 1.4100$ target. Time Frame 6H.
Buy!
Comment and subscribe to help us grow!
Check out other forecasts below too!
Disclosure: I am part of Trade Nation's Influencer program and receive a monthly fee for using their TradingView charts in my analysis.

SILVER Will Go Lower From Resistance! Sell!
Please, check our technical outlook for SILVER.
Time Frame: 1D
Current Trend: Bearish
Sentiment: Overbought (based on 7-period RSI)
Forecast: Bearish
The market is approaching a significant resistance area 5,316.9.
Due to the fact that we see a positive bearish reaction from the underlined area, I strongly believe that sellers will manage to push the price all the way down to 4,596.2 level.
P.S
We determine oversold/overbought condition with RSI indicator.
When it drops below 30 - the market is considered to be oversold.
When it bounces above 70 - the market is considered to be overbought.
Like and subscribe and comment my ideas if you enjoy them!

NZDCAD Will Move Higher! Buy!
Please, check our technical outlook for NZDCAD.
Time Frame: 4h
Current Trend: Bullish
Sentiment: Oversold
Forecast: Bullish
The market is trading around a solid horizontal structure 0.805.
The above observations make me that the market will inevitably achieve 0.808 level.
P.S
The term oversold refers to a condition where an asset has traded lower in price and has the potential for a price bounce.
Overbought refers to market scenarios where the instrument is traded considerably higher than its fair value. Overvaluation is caused by market sentiments when there is positive news.
Like and subscribe and comment my ideas if you enjoy them!
