GBPJPY Will Fall! Short!
Here is our detailed technical review for GBPJPY.
Time Frame: 1h
Current Trend: Bearish
Sentiment: Overbought (based on 7-period RSI)
Forecast: Bearish
The market is trading around a solid horizontal structure 207.917.
The above observations make me that the market will inevitably achieve 207.292 level.
P.S
Please, note that an oversold/overbought condition can last for a long time, and therefore being oversold/overbought doesn't mean a price rally will come soon, or at all.
Like and subscribe and comment my ideas if you enjoy them!
Signals

GBPCHF Is Going Down! Sell!
Please, check our technical outlook for GBPCHF.
Time Frame: 4h
Current Trend: Bearish
Sentiment: Overbought (based on 7-period RSI)
Forecast: Bearish
The price is testing a key resistance 1.068.
Taking into consideration the current market trend & overbought RSI, chances will be high to see a bearish movement to the downside at least to 1.065 level.
P.S
Overbought describes a period of time where there has been a significant and consistent upward move in price over a period of time without much pullback.
Like and subscribe and comment my ideas if you enjoy them!

$EVH, Long, TP>50%NYSE:EVH , Long, TP>50%
This stock is interesting.
Choose an entry point and do not forget about a protective order if you are trading with leverage.
Don't risk it if you're not sure.
Good luck to everyone.

DOW JONES Multi-month Bear Cycle to 40000 starting.Dow Jones (DJI) has been trading within a 16-year Channel Up since the 2008 Housing Crisis and approximately every 3.5 years (44 months) it tops and starts a technical correction/ Bearish Leg.
All of those Bear Cycles essentially since October 2011 have eventually pulled-back to the 1M MA50 (blue trend-line) at roughly he 0.382 Fibonacci retracement level. Only once time the 1M MA50 broke significantly and that was in March 2020 during the COVID flash crash, which eventually found Support on the 1M MA100 (green trend-line).
As a result, we expect Dow to start its Bear Cycle in 2026. From the current high the 0.382 Fib stands at exactly 40000, which based on its trajectory is where the 1M MA50 is headed by Q3 2026.
---
** Please LIKE 👍, FOLLOW ✅, SHARE 🙌 and COMMENT ✍ if you enjoy this idea! Also share your ideas and charts in the comments section below! This is best way to keep it relevant, support us, keep the content here free and allow the idea to reach as many people as possible. **
---
💸💸💸💸💸💸
👇 👇 👇 👇 👇 👇

BITCOIN Ichimoku red flip taking place. NOT GOOD.Bitcoin (BTCUSD) is in the process of turning its 1W Ichimoku Cloud from bullish (green) to bearish (red). It has been on a consecutive green state since October 23 2023.
This red flipping is a major development as relative to the previous BTC Bear Cycles, it has happened around the exact same stage that we are at right now. This technically confirms that we are already on the new Bear Cycle (something we've been talking about since September) and that the basic stages/ phases of it remain the same.
The high degree of symmetry is further shown by the fact that when this Ichimoku flip takes place, the price has historically been trading around 175 days (25 weeks) away from it (green circle), supported by the 1W MA100 (green trend-line). And that has always been the stage of a counter-trend rebound/ rally that targeted and was rejected on the 1D MA200 (red trend-line).
The second remarkable display of symmetry is that following this Ichimoku red flip, the Bear Cycles bottomed around 105 days (15 weeks) after it (blue circles).
So what do the above data suggest for the market right now? That there is a short-term rally pending towards the 1D MA200 and that we may see the Bear Cycle bottoming around the end of September 2026.
Would you agree with this thesis? Feel free to let us know in the comments section below!
---
** Please LIKE 👍, FOLLOW ✅, SHARE 🙌 and COMMENT ✍ if you enjoy this idea! Also share your ideas and charts in the comments section below! This is best way to keep it relevant, support us, keep the content here free and allow the idea to reach as many people as possible. **
---
💸💸💸💸💸💸
👇 👇 👇 👇 👇 👇

AUDUSD Will Go Up! Buy!
Take a look at our analysis for AUDUSD.
Time Frame: 4h
Current Trend: Bullish
Sentiment: Oversold (based on 7-period RSI)
Forecast: Bullish
The market is testing a major horizontal structure 0.662.
Taking into consideration the structure & trend analysis, I believe that the market will reach 0.666 level soon.
P.S
Overbought describes a period of time where there has been a significant and consistent upward move in price over a period of time without much pullback.
Like and subscribe and comment my ideas if you enjoy them!

EURUSD Will Move Higher! Long!
Please, check our technical outlook for EURUSD.
Time Frame: 1h
Current Trend: Bullish
Sentiment: Oversold (based on 7-period RSI)
Forecast: Bullish
The market is approaching a key horizontal level 1.171.
Considering the today's price action, probabilities will be high to see a movement to 1.174.
P.S
Please, note that an oversold/overbought condition can last for a long time, and therefore being oversold/overbought doesn't mean a price rally will come soon, or at all.
Like and subscribe and comment my ideas if you enjoy them!

EURUSD SELL | Idea Trading AnalysisEURUSD is moving on resistance zone
The chart is above the support level, which has already become a reversal point twice.
We expect a decline in the channel after testing the current level.
We expect a decline in the channel after testing the current level
Hello Traders, here is the full analysis.
I think we can soon see more fall from this range! GOOD LUCK! Great SELL opportunity EURUSD
I still did my best and this is the most likely count for me at the moment.
-------------------
Traders, if you liked this idea or if you have your own opinion about it, write in the comments. I will be glad ⚜️

Ethereum — Bearish structure confirmed amid weak macro sentimentHello everyone,
At the moment, Ethereum is trading within a broader risk-off environment, where defensive sentiment continues to dominate risk assets. Capital flows have yet to show a strong enough return to support a sustainable bullish trend, while investors remain cautious amid macroeconomic uncertainty and overall liquidity conditions. This hesitation has caused recent ETH rebounds to lack follow-through and remain vulnerable to selling pressure.
From a technical perspective , the H4 chart clearly reflects a weakening market structure. After a sharp impulsive move higher, Ethereum failed to maintain expansion and was quickly rejected at higher levels, forming a failed breakout . The return of price below the breakout area signals that buyers were unable to maintain control, allowing sellers to reassert dominance.
The zone around 3,270–3,320 USD now acts as a key resistance area . This region aligns with prior supply and important technical factors, where price has repeatedly faced rejection. As long as the bearish structure remains intact, rallies into this area should be viewed as trend-aligned SELL opportunities , rather than early signs of a bullish reversal.
On the downside, the 3,070–3,000 USD region represents the nearest support target. While this zone has previously generated price reactions, within an active downtrend it should be treated primarily as a potential profit-taking area , not a safe BUY zone. Attempting to catch a bottom while the lower-high, lower-low structure remains intact introduces unnecessary risk.
Looking at market behavior , recent recoveries have been characterized by weak momentum, narrow ranges, and a lack of decisive buying participation. This suggests a phase of distribution and rebalancing , rather than accumulation for trend continuation. When the market fails to accept higher prices, the probability of downside continuation outweighs that of an early reversal.
In conclusion , Ethereum remains in a controlled corrective downtrend. With neither the technical structure nor the current news backdrop supporting a bullish scenario, the most prudent approach is to prioritize selling rallies , apply strict risk management, and remain patient until the market delivers clearer signals. In trading, aligning with the dominant trend consistently offers a higher probability edge than attempting to anticipate a bottom.
Wishing you clear judgment, disciplined risk management, and sustainable trading performance.

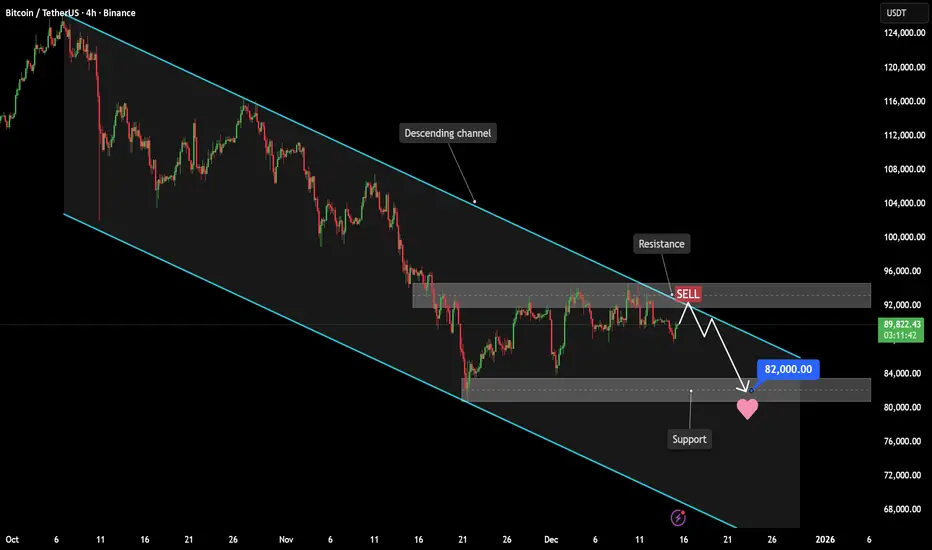
Bitcoin - Downtrend reinforced by technicals and macro sentimentHello everyone,
At the moment, Bitcoin is trading cautiously as capital has yet to decisively return to risk assets. Overall market sentiment remains defensive, with investors continuing to assess macroeconomic conditions and monetary policy. As a result, buying pressure has not been strong enough to reverse the prevailing trend.
From a technical perspective , the H4 chart shows that Bitcoin continues to respect a well-defined descending channel . Market structure remains bearish, with a clear sequence of lower highs and lower lows, confirming that selling pressure is still dominant. Recent rebounds have been purely technical in nature and have repeatedly been rejected near the upper boundary of the channel, signaling that buyers lack control.
Notably, the 92,000–94,000 USD area is acting as a key resistance zone. This region aligns with the upper boundary of the descending channel and a prior distribution area, where price has been rejected multiple times. In the current context, each failed attempt to close decisively above this zone reinforces the view that it is a trend-aligned SELL area , rather than a bullish reversal signal.
On the news front , the crypto market continues to be influenced by a broader risk-off environment, with capital favoring safety and liquidity. The absence of strong positive catalysts makes it difficult for Bitcoin to sustain a meaningful breakout. This cautious investor behavior effectively supports the existing bearish structure, as weak and hesitant demand often allows downtrends to persist.
On the downside, the 80,000–82,000 USD region stands out as an important support area. While price has reacted from this zone in the past, within a broader downtrend it should be viewed primarily as a potential profit-taking target , not a safe BUY zone. Attempting to catch the bottom before the bearish structure is broken carries elevated risk and does not align with disciplined trading.
Overall, both technical structure and the current news backdrop point toward a bearish continuation scenario . Until there is a clear shift in market structure or a meaningful improvement in capital flows, the most rational approach remains to sell rallies in line with the trend , rather than trying to predict a bottom.
In conclusion , Bitcoin remains in a controlled downtrend. Only a decisive break above the descending channel, supported by a more favorable news environment, would justify considering a trend reversal. Until then, patience, discipline, and respect for the dominant trend are essential for capital protection and consistent performance.
Wishing you clear judgment, strong risk management, and disciplined trading in line with the primary trend.
GBPJPY: COT & Seasonality Align for Bullish ContinuationCOT (Commitment of Traders): On GBP futures, Non-Commercial traders remain heavily net short, with an unbalanced structure and a further increase in short exposure over recent weeks. This positioning is typically contrarian in nature and remains consistent with continued upside potential in the cross. On the JPY side, Non-Commercials are still net long, but the broader context points to a structurally weak yen. Positioning momentum is fading, suggesting a higher risk of short covering rather than genuine defensive strength. From a relative perspective, the GBP vs JPY COT spread continues to favor further upside in GBPJPY.
Seasonality: Historical seasonality highlights December as one of the strongest months for GBPJPY, showing positive average performance across the 20-, 15-, 10- and 5-year datasets, with frequent accelerations during the second half of the month. This reinforces the broader bullish bias and reduces the probability of deep reversals as long as the technical structure remains intact.
Sentiment (retail): Retail positioning shows a clear majority short (around 80%), a classic setup that tends to support trend continuation and potential squeezes above highs, particularly when aligned with a well-defined trend and no signs of institutional distribution.
Daily technicals: The daily chart maintains a clean bullish structure, defined by higher highs and higher lows within an ascending channel. Price continues to trade above key value areas while respecting dynamic demand zones. The 206.5–205.5 area represents the first continuation demand, while a broader daily demand sits lower around 203–200, overlapping with a daily FVG and structural support. On the upside, 211.5–213 stands out as daily supply and the natural upside objective. Technically, there is room for an extension toward new highs as long as no structural breakdown or distribution signals emerge. The daily RSI remains constructive, with no meaningful bearish divergences, fully consistent with trend continuation.
Operational conclusion: The medium-term bias remains bullish. The preferred strategy is buying pullbacks into daily/H4 demand zones, with invalidation only below the key structural lows. Counter-trend shorts should be avoided. Short opportunities become relevant only if clear exhaustion signals appear at daily supply, supported by divergences and a confirmed structural shift, which are currently absent.

EURUSD Watching for a Potential Sell Zone Near 1.17830Quick Summary
EURUSD has rallied strongly and left a large liquidity void behind. Despite this, there is currently no sign of weakness, so selling at current levels is not justified. A potential sell opportunity may appear near 1.17830, where a strong daily orderblock is expected. From that area, a corrective decline could develop, targeting 1.15804 to fill the liquidity void.
Full Analysis
EURUSD has shown strong and consistent bullish momentum over the recent period. The move higher has been impulsive, leaving behind a significant liquidity void below. Normally, such imbalances tend to be revisited over time. However, at the moment, there is no clear sign of weakness in price action. The market continues to respect the bullish structure, which makes selling at current levels premature and risky.
Instead of anticipating a reversal too early, the focus should be on higher levels where sellers may become active. The zone around 1.17830 stands out as a potential sell area. This level represents a well defined daily orderblock and could act as a point where bullish momentum starts to slow and corrective pressure begins to appear.
If price reaches this zone and shows a valid reaction, a corrective move to the downside becomes more likely. In that scenario, the expected target for the correction would be the area around 1.15804. This move would allow the market to rebalance and fill the large liquidity void left behind during the strong bullish expansion.

EURUSD new bearish biasQuick Summary
Continuing the bearish outlook on EURUSD, the pair is expected to resume its decline after breaking the ascending channel, targeting 1.16822 first, followed by 1.16163 to fill the liquidity void left behind.
Full Analysis
EURUSD has recently experienced a strong upward move, testing the boundaries of the ascending channel, however, respected the channel structure, showing that buyers were initially in control but lacked sufficient momentum to push the price significantly higher. As price broke below the ascending channel, it signaled that the bearish momentum is set to resume, with the market aiming to correct previous inefficiencies and fill liquidity void that were left during the recent bullish run.
The first key level to watch is 1.16822, which acts as the initial support and a potential reaction zone for short-term. A break of this level would indicate that the market is committed to deeper corrections, with the next target at 1.16163, marking a more significant liquidity void. Filling these gaps is a common behavior in technical price action, as the market seeks to balance out areas of concentrated orders and unfilled trades left from the previous move.

Why Consistency Beats Talent in TradingWelcome all to another post! In today's post we will review the difference between Talented trading and consistent trading.
Why Consistency Beats Talent in Trading
Many new traders usually enter trading believing that success belongs to the most intelligent individuals, the most analytical, or the most “naturally gifted.” In any field.
When in reality, the market only rewards something that is far less glamorous, and that is.. consistency.
Talent can help you understand charts faster and/or grasp concepts a lot quicker, but it is consistency that determines and shows whether you survive long enough to become profitable and make a positive return.
Talent Creates Potential | Consistency Creates Results
Talent shows up early, like in the first week or two.
You might spot patterns instantly, win a few trades, or feel like trading “just makes sense” to you.
Consistency shows up later and it’s far rarer.
The market does not care how smart you are.
It only responds to:
- How often you follow your rules and system.
- How well you manage risk ( or gamble it. )
- How disciplined you are under pressure and stress
- A talented trader who trades emotionally will eventually lose, ( always lose. )
- A consistent trader with average skills can compound them steadily over time.
Why Talented Traders Often Struggle
Ironically, talent can be a disadvantage ( keep on reading )
Talented traders often:
- Rely on intuition instead of their own rules or the games rules ( or common sense. )
- Take trades outside their plan ( like above, not following their rules. )
- Increase risk after a few wins ( again, not following RM rules. )
- Ignore data because “ they feel confident ”
This leads to inconsistency big wins followed by bigger losses. ( Gambling )
The market eventually punishes anyone who treats probability like certainty.
Consistency Turns Probability into an Edge
Trading is not about being right it’s about commencing the same process over and over.
Consistency means:
- Taking only the setups you’ve defined. (Defined what A+ is)
- Risking the same amount per trade. (Risk Management)
- Accepting losses without deviation. (Moving on after a loss)
- Following your plan even after losing streaks. (Maintaining consistency)
One trade means nothing.
A hundred trades executed the same way reveal your edge.
Consistency allows probability to work for you, not against you.
The Market Rewards Discipline, Not Brilliance
The best traders in the world are not constantly trying to outsmart the market.
They:
- Trade fewer setups
- Keep their approach simple
- Protect capital first
- Let time and repetition do the work
- They understand that survival is the first goal.
- You can’t compound an account you’ve blown.
Consistency Is Boring and That’s the Point
Consistencty lacks excitement.
There are no adrenaline rushes, no heroic trades, no all-in moments.
Just repetition, patience, and restraint. This is why most people fail.
The market filters out those who chase excitement and rewards those who treat trading like a business, not entertainment.
Talent Without Consistency Is Temporary
Many traders experience early success.
Very few maintain it.
Short-term success often comes from:
- Favorable market conditions
- Random luck
- Overconfidence
Long-term success comes from:
- Process
- Risk control
- Emotional discipline
Consistency is what turns a good month into a sustainable career.
How to Build Consistency as a Trader
Consistency is a skill not a personality trait.
You build it by:
- Defining clear trading rules
- Using fixed risk per trade
- Journaling every trade honestly
- Reviewing performance regularly
- Trading less, not more
Your goal isn’t to be impressive.
Your goal is to be repeatable.
Final Thoughts
Talent may get you interested in trading.
Consistency keeps you in the game.
In a profession driven by uncertainty, the trader who shows up the same way every day will always outperform the one chasing brilliance.
In trading, consistency doesn’t just beat talent > it replaces it.
Thank you all so much for reading, I hope everyone enjoys it and that it benefits you all!
Let me know in the comments below if you have any questions or requests.

GOLD surges after US jobs data, policy uncertaintyOANDA:XAUUSD made a sudden surge during the Asian session on December 17, jumping nearly USD 25 within just a few hours, reaching the 4,327 USD/ounce area before cooling off and consolidating around 4,320 USD/ounce. This was not a “clean” trend-driven rally, but rather a fast market reaction to a series of inconsistent economic signals coming from the US.
This move followed the previous session’s strong volatility, when gold prices reversed multiple times after the Nonfarm Payrolls report. The initial reaction was a sharp rally, consistent with gold’s typical response to weak labor data. However, just minutes later, the market reversed as investors took a closer look at the broader picture: labor conditions were not excessively weak, consumer spending remained resilient, and the Fed had no urgent reason to ease aggressively.
Labor data weak on the surface, firm at the core
The US Bureau of Labor Statistics reported that nonfarm payrolls increased by 64,000 in November, beating expectations, while the unemployment rate rose to 4.6%, the highest level since 2021. This created a “misaligned” data set: jobs are still being added, but the quality of the labor market is beginning to deteriorate.
This very contradiction drove sharp volatility in gold. Initially, the market reacted to the headline: higher unemployment implies the Fed may need to turn more dovish. But once flows calmed, a bigger question emerged: does the Fed really need to ease quickly when consumer spending remains solid?
As a result, expectations for rate cuts in early 2026 remain relatively low, around 25%, indicating that the market is not yet ready to make a strong bet on an aggressive easing cycle.
Monetary policy pulls gold between two opposing forces
Last week, the Fed cut rates by 25 basis points, but the accompanying message remained highly cautious. Interest rate futures currently price in only two modest cuts in 2026, rather than a decisive easing cycle.
In this context, gold — a non-yielding asset — is in a sensitive position:
Benefiting from economic risks, noisy data, and policy uncertainty.
But constrained by the reality that real rates have not fallen deeply enough to build a sustainable upside foundation.
This explains why gold can rally very quickly in the short term, yet is equally prone to sharp corrections shortly afterward.
The broader backdrop: inflation, consumption, and geopolitics
US retail sales data for October were largely flat, showing that consumers are still holding up despite pressure from high prices and the impact of tariffs. This makes it difficult for the Fed to turn more accommodative and is another reason why gold remains stuck in a choppy trading environment.
In the coming days, attention will shift to CPI, jobless claims, and the PCE index. These are not merely economic data points, but key puzzle pieces that will determine whether the low-rate narrative — the long-term foundation for gold — is truly being reinforced.
Personal perspective
This rally is not a confirmation of a new uptrend, but rather a reminder that the gold market is trading in a high-noise environment, where each data release can be interpreted in multiple ways.
Gold is currently reflecting uncertainty in global monetary policy rather than a clear growth story. In such a context, large price swings are not the exception — they are the new normal.
Technical analysis and suggestions OANDA:XAUUSD
The dominant trend for gold remains upward, but it is entering the most sensitive phase of the cycle.
On the daily chart, gold prices maintain a structure of higher highs and higher lows, moving steadily within an upward price channel since Q3 2025. However, the $4,320 – $4,335/ounce range is becoming a short-term distribution zone, where buying pressure is no longer as dominant as during the previous acceleration phase. Prices have approached this area several times but have yet to form a decisive breakout, reflecting the cautious sentiment of large investors.
In terms of momentum, the RSI has moved out of the overbought state but has not yet formed a clear bearish divergence, indicating that the uptrend has not been broken, but is entering a consolidation phase, a technical correction. The current corrections are more of a "cooling" phase than a trend reversal.
Conditions for opening a new uptrend cycle:
The closing price clearly above 4,330 – 4,350 USD, accompanied by increased volume and volatility.
The RSI returns to the region above 65 and remains stable, confirming the return of buying momentum.
When these conditions converge, gold could enter a new sustained uptrend, with a medium-term target extending to the $4,450-$4,600/ounce range, corresponding to the upper boundary of the expanding uptrend channel.
Risk of correction to watch:
Losing the support zone of $4,245 – $4,215 (Fibonacci 0.236 and the nearest consolidation bottom) will trigger stronger profit-taking pressure.
In a negative scenario, gold could retreat further to the $4,050 – $3,970 zone, which could be the convergence of the medium-term moving average and the equilibrium zone of the current uptrend.
Cautious Scenario – Trading on Corrections
If the price clearly fails at $4,330 – $4,350 and short-term weakness signals appear, consider short-term technical selling.
Target: $4,245 → $4,200, with small volume, adhering strictly to discipline as the overall trend remains upward.
SELL XAUUSD PRICE 4392 - 4390⚡️
↠↠ Stop Loss 4396
→Take Profit 1 4384
↨
→Take Profit 2 4378
BUY XAUUSD PRICE 4288 - 4290⚡️
↠↠ Stop Loss 4284
→Take Profit 1 4296
↨
→Take Profit 2 4302

GOLD ANALYSIS 12/17/20251. Fundamental Analysis:
a) Economy:
• USD: Last night, the USD had a technical rebound after US PMI data came in above 50. This caused a short-term USD increase, creating corrective pressure on gold, but it did not reverse the overall trend. Prior to that, weak Nonfarm data, rising unemployment, declining income, and slowing consumption continued to support gold prices.
• US Stock Market: Moving sideways; capital has not exited aggressively → no clear risk-on signal.
• FED: Still in a rate-cutting cycle → medium to long term remains supportive for gold.
• TRUMP: No new statements or policies that could shock the market.
• Gold ETF (SPDR): No significant selling recorded last night → ETF supply is not creating strong pressure on gold.
b) Politics:
• Global geopolitical tensions remain simmering → gold continues to act as a safe-haven asset.
c) Market Sentiment:
• Slight risk-off sentiment after PMI → the market remains cautious, avoiding FOMO.
• Demand remains strong; recently India bought a net USD 10 billion worth of gold, supporting gold at elevated price levels.
• With Christmas and New Year approaching, the market is likely to be quiet with thin liquidity. Reduce position size or stay on the sidelines if needed.
=> Conclusion: News last night only caused a technical correction after the previous rally (driven by earlier news), not strong enough to break gold’s bullish structure. The primary trend remains bullish.
2. Technical Analysis:
M30 Timeframe:
• Price is moving within an ascending channel.
• Demand Zone: 4263 – 4270 acts as a key support area.
• Moving averages continue to provide good support; no structural breakdown.
• Supply Zone: 4350 – 4355 is a strong resistance area where selling previously emerged.
=> Overall Structure: Higher lows – higher highs remain intact.
RESISTANCE: 4330 – 4351 – 4380
SUPPORT: 4288 – 4263 – 4237
3. Previous Session (16/12/25):
• Gradual sideways-to-down movement during the Asian and European sessions.
• Selling pressure weakened as price approached the Demand Zone.
• Strong buying emerged after Nonfarm news, followed by a pullback after PMI data.
• This suggests big players have not exited; the move was mainly a retail shakeout.
4. Today’s Strategy (17/12/25):
🪙 SELL XAUUSD | 4392 – 4390
SL: 4396
TP1: 4384
TP2: 4378
🪙 BUY XAUUSD | 4304 – 4306
SL: 4300
TP1: 4312
TP2: 4318

GOLD → Bearish Pressure Builds, But Confirmation Still RequiredHello everyone,
At the moment, gold is being influenced by a relatively sensitive macro backdrop. The U.S. dollar remains firm and U.S. Treasury yields stay elevated, making capital flows into non-yielding assets like gold more cautious. However, these factors are not yet strong enough to trigger a decisive sell-off ; they are mainly causing price to stall and lose momentum.
From a technical perspective , the H1 chart shows that gold has not confirmed a break of the bullish structure . Price is still hovering around the ascending trendline and consolidating after forming a double top near the highs. This reflects market indecision—buying pressure is weakening, but sellers have not fully taken control.
Therefore, the bearish scenario is only activated if price breaks and closes clearly below the ascending trendline . If that happens, the short-term structure would shift from bullish to bearish, opening the door for a move toward 4,262 , and potentially deeper to 4,207 , where demand previously appeared.
Conversely, as long as no breakout occurs , current price action should be viewed as consolidation or a corrective phase within the trend. Selling prematurely without a confirmed break carries higher risk and does not align with disciplined trading.
In summary , macro news is applying downside pressure, but technically gold still requires clear confirmation. The rational approach right now is not to predict, but to wait for the market to confirm . Only when structure is truly broken does the bearish scenario become valid and actionable.

GBPNZD BULLISH BREAKOUT|LONG|
✅GBPNZD delivers a clean bullish breakout from the demand zone, showing strong displacement and acceptance above prior consolidation. ICT structure flips bullish as buy-side liquidity is targeted, with momentum favoring continuation toward higher imbalance levels. Time Frame 4H.
LONG🚀
✅Like and subscribe to never miss a new idea!✅

GBP-AUD Will Go UP! Buy!
Hello,Traders!
GBPAUD breaks out above a well-defined horizontal demand area after absorbing sell-side liquidity. Strong displacement confirms bullish intent, with structure flipping to higher highs and higher lows. Price now targets the next buy-side liquidity pool resting above the range. Time Frame 3H.
Buy!
Comment and subscribe to help us grow!
Check out other forecasts below too!
Disclosure: I am part of Trade Nation's Influencer program and receive a monthly fee for using their TradingView charts in my analysis.

USDJPY FREE SIGNAL|LONG|
✅USDJPY reacts from a higher-timeframe demand zone after a strong sell-side liquidity sweep, with displacement showing bullish intent. Current structure suggests mitigation of a bullish order block, keeping price in discount and favoring continuation toward resting buy-side liquidity above.
—————————
Entry: 154.76
Stop Loss: 154.680
Take Profit: 155.196
Time Frame: 2H
—————————
LONG🚀
✅Like and subscribe to never miss a new idea!✅

US100 Free Signal! Sell!
Hello,Traders!
US100 taps into a well-defined horizontal supply zone after a strong bearish displacement, confirming smart money distribution. Price failed to reclaim the supply cluster and is now respecting bearish order flow, with downside liquidity resting below recent lows.
--------------------
Stop Loss: 25,283
Take Profit: 24,891
Entry: 25,123
Time Frame: 4H
--------------------
Sell!
Comment and subscribe to help us grow!
Check out other forecasts below too!
Disclosure: I am part of Trade Nation's Influencer program and receive a monthly fee for using their TradingView charts in my analysis.

SILVER BULLISH CONTINUATION|LONG|
✅SILVER compresses into a tightening range above a rising ICT trendline, showing clear bullish market structure and sustained buy-side pressure. Price is coiling below resistance, suggesting smart money accumulation — patience is key while waiting for a clean upside breakout toward higher liquidity. Time Frame 4H.
LONG🚀
✅Like and subscribe to never miss a new idea!✅

SPX to 6792Its hard to see on a 30 minute chart but you created your inverse head and shoulders and you are forming your bull flag. Unless if invalidated and LOD breaks your heading up here EMA's are slightly pointing up. Pay attention to the clue's
