BTCUSDT.P - November 21, 2025Price is in a short‑term downtrend, with a series of lower highs and lower lows after rejecting the highlighted resistance area near 92,300–92,500 and breaking back below intraday consolidation. Loss of upside momentum and a rotation from a prior minor rally confirming sellers’ control and opening the door for continuation toward the marked support area around 88,800–89,200.
Signals

GOLD rises amid uncertain signals from US economyOANDA:XAUUSD continued to rise in Wednesday's session, as investors increased their holdings of safe-haven assets amid the delay of US employment data due to the government shutdown and the market prepared for the minutes of the Federal Reserve's October meeting.
As of the morning of November 20, spot gold was trading around $4,078/ounce, up about $11, or 0.27%, from the previous day.
Gold's rise coincided with the stabilization of global stocks after a sell-off related to concerns about artificial intelligence valuations. However, investor sentiment remained cautious ahead of Nvidia's business results and a series of US economic data due this week.
Weakening labor market signals support OANDA:XAUUSD
Data released on Tuesday showed the number of Americans receiving unemployment benefits rose to a two-month high in mid-October, a sign that the labor market may be losing momentum.
Against this backdrop, any signs of labor market weakness would reinforce expectations that the Fed may have to ease policy more quickly, providing support for gold, a non-yielding asset that benefits from lower interest rates.
Market focus: Fed minutes and delayed jobs data
Investors are turning their attention to the minutes from the Fed’s October meeting, due at 2 p.m. ET. Despite the 25 basis point cut at its most recent meeting, Chairman Jerome Powell continued to maintain a cautious stance, leaving open the possibility of a pause in easing if inflation risks return.
Separately, the September jobs report, delayed by the government shutdown, is due out on Thursday. This is seen as an early indicator of economic growth strength, with Reuters forecasting non-farm payrolls to rise by around 50,000 jobs.
Any weaker-than-expected figure could boost haven demand and continue to support gold prices.
Rising interest rate cut expectations, a key driver of OANDA:XAUUSD
According to CME FedWatch, the market now rates a 51% chance of the Fed cutting rates again at its next meeting, up from 46% in the previous session.
This increase in expectations is the core factor triggering capital flows to gold, in the context of falling real yields and investors looking for value preservation as the growth outlook becomes more uncertain.
TECHNICAL ANALYSIS AND SUGGESTIONS OANDA:XAUUSD
After recovering from the bottom around $4,000, gold price hit the 0.236 Fibonacci retracement at $4,128 and was immediately rejected, showing that profit-taking pressure is still strong.
• The main trend is still up, as the price is still in the medium-term uptrend channel and above the important MA line.
• The 3,972 area (Fib 0.382) is acting as short-term support, accompanied by the MA line right below around 3,942.
• Since it has not been able to break the 0.382 Fib level, gold is currently not in the best condition for a new uptrend.
RSI has rebounded but has not yet exceeded 60, showing that the buyers have not fully returned, but there are no signs of strong weakness.
SELL XAUUSD PRICE 4108 - 4106⚡️
↠↠ Stop Loss 4112
→Take Profit 1 4100
↨
→Take Profit 2 4094
BUY XAUUSD PRICE 3982 - 3984⚡️
↠↠ Stop Loss 3978
→Take Profit 1 3990
↨
→Take Profit 2 3996

USDJPY long-term bullish within 3-year Channel UpThe USDJPY pair has been trading within a 3-year Channel Up ever since the October 17 2022 High.
Right now it has been unfolding its latest Bullish Leg since the April 21 2025 bottom (Higher Low), turning its 1W RSI this week overbought (>70.00).
This signal along with the similarities with the June 26 2023 local High, point towards a potential short-term pull-back to test the 1W MA50 (blue trend-line) - 1D MA100 (red trend-line) Support cluster.
As you can see, those have been the two Support levels on every major rally within this 3-year pattern.
As a result, we will look for an additional opportunity to buy there, maintaining a medium-term Target for this pair at 161.500 (Resistance 1).
---
** Please LIKE 👍, FOLLOW ✅, SHARE 🙌 and COMMENT ✍ if you enjoy this idea! Also share your ideas and charts in the comments section below! This is best way to keep it relevant, support us, keep the content here free and allow the idea to reach as many people as possible. **
---
💸💸💸💸💸💸
👇 👇 👇 👇 👇 👇

XAU/USD | Gold Approaching Key Intraday Supply Zone! (READ)By analyzing the #Gold chart on the 4H timeframe, we can see that after dropping to 3998 dollars, price found strong demand and has now climbed back up to around 4050 dollars.
Keep an eye on the 4056–4064 zone for a potential SELL reaction, as this is a key supply area.
This analysis will be updated soon, and all important supply and demand zones are already marked on the chart.
Please support me with your likes and comments to motivate me to share more analysis with you and share your opinion about the possible trend of this chart with me !
Best Regards , Arman Shaban

EURUSD Short Setup if Key Level BreaksIf the EURUSD manages to break below the 1.15243 level, a potential short opportunity may develop around 1.15273. However, this setup is not confirmed yet, and the key element here is patience and proper validation.
For this scenario to become valid, the market must first close a 15-minute candle below 1.15243. Such a close would indicate that the price has successfully broken through the level and is showing signs of rejection from the 15-minute orderblock, suggesting that sellers are stepping in with intention.
This type of confirmation is essential because it filters out false breaks and ensures that the market is truly shifting momentum. If this rejection is validated, then the retest of 1.15273 could provide a precise and clean entry for short setups, with structure and liquidity alignment supporting the move.
Until that break and close happen, the level remains a potential reaction point rather than a confirmed bearish continuation signal. As always, waiting for clear confirmation helps avoid entering the market prematurely, especially during periods where liquidity sweeps are common.

ETHUSDT.P - November 20, 2025ETHUSD is displaying a series of lower highs beneath a well-defined descending trendline, showing persistent bearish momentum and a clear downtrend. Price repeatedly failed to break resistance around 3,100, leading to sharp declines back toward support near 2,900. Recent price action shows a corrective rally met strong resistance as momentum faded. Overall, the trend remains bearish unless price can decisively breach the descending resistance line and establish higher highs.

XRPUSDT.P - November 20, 2025This chart shows a corrective upward move within a broader downtrend, with current resistance at 2.14 and major resistance at 2.17. The price action indicates a possible rejection from these resistance zones, with a projected move down toward the support level around 2.03. Trend structure remains bearish as rallies are failing to break above prior resistance levels. Momentum appears weak, suggesting sellers are likely to regain control near overhead resistance.

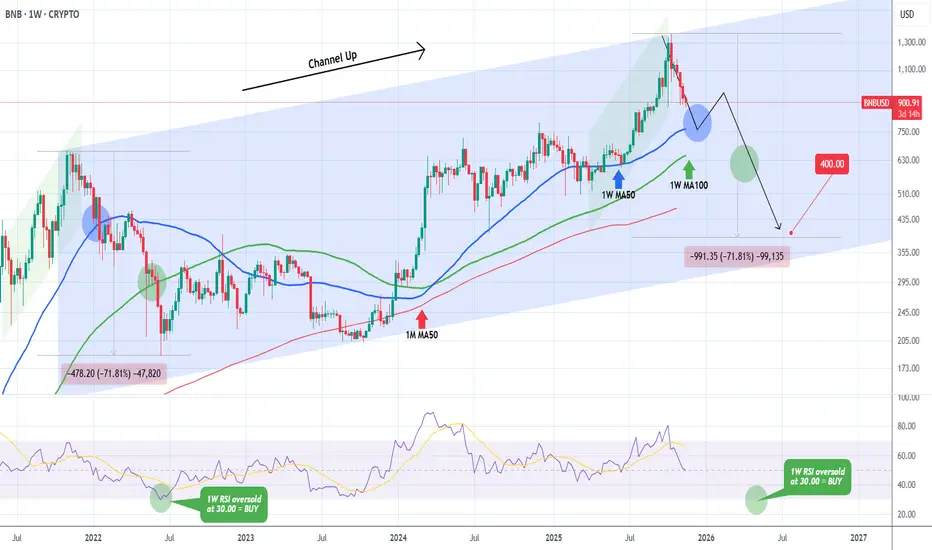
BNBUSD Bear Cycle started and can even crash to $400.Binance Coin (BNBUSD) is currently on its 4th straight red week (and 5 in the last 6), declining aggressively following the October 13 All Time High (ATH). That was also a technical Higher High for the 4-year Channel Up that started following the November 01 2021 Top of the previous Cycle.
As you can see the sequences that led to both Channel Up tops are similar. Technically this implies that the recent 6 week decline is the start of the new Bear Cycle (Bearish Leg for the Channel Up).
The price is now approaching the 1W MA50 (blue trend-line), which is the first Support, with the 1W MA100 (green trend-line), this time right below it.
Technically, we could see this Bear Cycle decline by as much as the previous one, -71.81%, and hit $400 before it bottoms. A solid indicator for when to buy BNB during this correction, is the 1W RSI hitting 30.00 (oversold), as it did on June 13 2022, which market the Cycle's bottom.
---
** Please LIKE 👍, FOLLOW ✅, SHARE 🙌 and COMMENT ✍ if you enjoy this idea! Also share your ideas and charts in the comments section below! This is best way to keep it relevant, support us, keep the content here free and allow the idea to reach as many people as possible. **
---
💸💸💸💸💸💸
👇 👇 👇 👇 👇 👇
BITCOIN Is Bullish! Long!
Here is our detailed technical review for BITCOIN.
Time Frame: 9h
Current Trend: Bullish
Sentiment: Oversold (based on 7-period RSI)
Forecast: Bullish
The market is on a crucial zone of demand 91,866.60.
The oversold market condition in a combination with key structure gives us a relatively strong bullish signal with goal 98,030.74 level.
P.S
The term oversold refers to a condition where an asset has traded lower in price and has the potential for a price bounce.
Overbought refers to market scenarios where the instrument is traded considerably higher than its fair value. Overvaluation is caused by market sentiments when there is positive news.
Like and subscribe and comment my ideas if you enjoy them!

GBPUSD Is Very Bullish! Buy!
Take a look at our analysis for GBPUSD.
Time Frame: 6h
Current Trend: Bullish
Sentiment: Oversold (based on 7-period RSI)
Forecast: Bullish
The price is testing a key support 1.306.
Current market trend & oversold RSI makes me think that buyers will push the price. I will anticipate a bullish movement at least to 1.314 level.
P.S
We determine oversold/overbought condition with RSI indicator.
When it drops below 30 - the market is considered to be oversold.
When it bounces above 70 - the market is considered to be overbought.
Like and subscribe and comment my ideas if you enjoy them!

GBPUSD Is Very Bearish! Sell!
Here is our detailed technical review for GBPUSD.
Time Frame: 4h
Current Trend: Bearish
Sentiment: Overbought (based on 7-period RSI)
Forecast: Bearish
The market is testing a major horizontal structure 1.315.
Taking into consideration the structure & trend analysis, I believe that the market will reach 1.311 level soon.
P.S
We determine oversold/overbought condition with RSI indicator.
When it drops below 30 - the market is considered to be oversold.
When it bounces above 70 - the market is considered to be overbought.
Like and subscribe and comment my ideas if you enjoy them!

GBPJPY Will Grow! Long!
Please, check our technical outlook for GBPJPY.
Time Frame: 1h
Current Trend: Bullish
Sentiment: Oversold (based on 7-period RSI)
Forecast: Bullish
The market is approaching a significant support area 203.989.
The underlined horizontal cluster clearly indicates a highly probable bullish movement with target 204.805 level.
P.S
Please, note that an oversold/overbought condition can last for a long time, and therefore being oversold/overbought doesn't mean a price rally will come soon, or at all.
Like and subscribe and comment my ideas if you enjoy them!

BOUNCE TO 98-100KMorning folks,
Last time we explained in details the fundamental background, so BTC remains bearish. But now it stands at weekly oversold and around 95K Daily support area. This creates friendly background for tactical bounce.
On 4H chart we have DiNapoli DRPO "Buy" pattern, that suggests upside bounce to 98-100K area at least.
That's being said, don't take any new shorts right now - wait for the pullback. For bullish intraday position, you could try to use this DRPO pattern. Don't place too far stop, just under lows should be enough, but be aware of NFP volatility today...

XAU/USD Intraday Plan – NFP Will Decide the Next MoveGold failed to clear the 4115 resistance yesterday, which led to a retest of the 4053 level — now acting as intraday support. Price is currently trapped between the MA200 and MA50, reflecting indecision ahead of the NFP release.
We need to see a clean break above the immediate resistance at 4078.
A sustained move above 4115 would confirm a momentum shift and open the door toward
4170 → 4232.
If price fails to clear 4078, we may see continued consolidation or another pullback into the Support Zone.
A break below 3,996 would expose the HTF Support Zone (3968–3921).
📌Key Levels to Watch:
Resistance:
4078
4115
4170
4232
Support:
4053
4027
3996
3968
3921
🔎Fundamental Focus:
Today is all about NFP, one of the most market-moving releases for gold. With job creation, wages, and unemployment all being published together, we can expect sharp volatility in both directions.

The Arena of XAUUSD-GOLD: New Round BeginsMy friends, Good Morning,
I have prepared a gold analysis for you in a swing trading structure.
The timeframe of this analysis is 4 hours.
In my XAUUSD-GOLD analysis, I will open sell positions between 4124.0 and 4176.0.
My targets are: TP1 - 3995.0 and TP2 - 3969.0.📊
This analysis is purely for your information.
To my friends who support each of my analyses with their likes,
I share these analyses thanks to your likes, because every single like from you is my greatest source of motivation to keep posting.
I sincerely thank all my friends who leave a like. 🙏
With respect and love.❤️

Lingrid | CADJPY Strong Resistance Barrier Selling OpportunityThe price perfectly played out in my last idea . FX:CADJPY is stalling at the major resistance area after tagging the October 2024 high near 112.50, where price previously reacted with sharp selloffs. Price action shows an extended move within the upward channel, forming a potential exhaustion pattern as price rejects both the resistance band and the upper channel boundary. If buyers fail to hold the support, a pullback toward 111.00 becomes the likely scenario as the market cools off from overextended levels.
⚠️ Risks:
A clean breakout above 112.50 would invalidate the selloff scenario and expose 113.20–113.50.
Unexpected JPY weakness could fuel another impulsive leg upward despite resistance.
Holding above the trendline support may limit the depth of any correction and keep CADJPY consolidating instead of reversing.
If this idea resonates with you or you have your own opinion, traders, hit the comments. I’m excited to read your thoughts!

Lingrid | TONUSDT Bearish Momentum Stall - Potential ReversalOKX:TONUSDT is slowing its decline as price decelerates directly on the 1.65 support zone, where the lower boundary of the downward channel has repeatedly produced rebounds. The structure remains bearish overall, but the price action inside this buying area shows early stabilization after a sharp move from the mid-range resistance. If buyers defend 1.64–1.65, a corrective rally toward 1.87 becomes the primary scenario as liquidity gathers near trendline resistance. The broader pattern favors a short-term bullish reaction before the larger downtrend potentially resumes at higher levels.
⚠️ Risks:
A clean breakdown below 1.64 may open a deeper slide toward 1.55–1.50.
Market-wide volatility from BTC could disrupt the developing accumulation structure.
Failure to reclaim the descending trendline could limit upside potential and keep TONUSDT trapped in consolidation.
If this idea resonates with you or you have your own opinion, traders, hit the comments. I’m excited to read your thoughts!

Gold Drops, Rebounds, Drops Again – Structure Still Bearish1. What Happened Yesterday
Gold reacted perfectly from the indicated sell zone, dropping almost 800 pips in a very short period.
However, immediately after the decline, the market turned violent with a 600-pip reversal, followed by another 700-pip drop overnight.
Such chaotic swings clearly show a battle between bulls and bears, with neither side managing to seize full control so far.
2. Current Market Context
This is one of the most difficult types of environments to trade:
- Momentum is uncertain
- Volatility is extreme
- Direction changes rapidly
Still, certain levels remain crucial for identifying the next move.
3. Technical Outlook
Key levels to watch:
- 4050 support → absolutely critical for bulls
A break and sustained move below 4050 would likely open the path toward a retest of 3900
- 4100 zone → immediate upside barrier
A clean stabilization above 4100 could finally give bulls the strength to push toward 4200
Without a decisive break of either level, expect more volatile two-sided trading.
4. Trading Plan
As of now, my bias remains bearish, unchanged from yesterday.
However, I remain aware of the strong intraday volatility and the possibility of fast upside spikes.
My main scenarios:
- Below 4050 → bearish continuation, targeting 3900
- Above 4100 → bullish momentum, possible rise toward 4200
Until one of these breaks occurs, expect Gold to remain noisy and difficult.
5. Conclusion
Gold is in a highly unstable phase, with sharp 600–800 pip swings in both directions. The market is fighting for direction, but structurally, the bearish bias still dominates unless price regains stability above 4100.

Lingrid | GOLD Range Bound Resistance - Potential RejectionThe price perfectly fulfilled my previous idea . OANDA:XAUUSD is moving toward edge of the resistance zone after bouncing off support 4,000 region. Price action remains corrective, with price trading inside a wider consolidation and reacting to both the downward trendline and the mid-range level. If the market stays capped below 4,130, a move back toward 4,045 becomes the likely scenario as sellers regain short-term momentum. The broader pattern continues to reflect a compressing market where bearish reactions inside resistance are still dominant.
⚠️ Risks:
A breakout above 4,130 would invalidate the short-term bearish projection and open the way toward 4,245.
US macro data like FOMC could drive gold sharply higher against the structure.
Failure to sustain momentum below mid-range levels may lead to deeper consolidation instead of a clean drop.
If this idea resonates with you or you have your own opinion, traders, hit the comments. I’m excited to read your thoughts!

ERAUSDT.P - November 18, 2025Price is pulling back from the resistance area near 0.2657 and continuing a short-term downtrend toward the next major support around 0.2271. The structure shows consistent lower highs, indicating bearish momentum.

Tesla Is Moving Toward a Key Support ZoneHello everyone, Tesla is entering a sensitive phase as the strong rally from 310 USD to 406 USD over the past two months begins to lose momentum. The recent decline is not just a normal pullback; the repeated appearance of red FVGs shows that buying pressure is fading while sellers are gradually taking control again. At the moment, the 401 USD level is acting as the nearest support. If this area fails to hold, Tesla could slide further toward 395 USD — a zone with green FVGs and heavy volume where strong buying previously pushed the price upward.
On the fundamental side, the news flow isn’t helping. Tesla’s Q3/2025 report showed adjusted profits dropping nearly 29% even though revenue still grew around 12%, indicating that operational efficiency is weaker than expected. Rising costs, lower income from regulatory credits, and massive investments in AI and robotics continue to squeeze margins. At the same time, competition from Chinese and European EV manufacturers is intensifying, putting additional pressure on Tesla’s future market share. With the broader tech market shifting toward a risk-off mood, growth stocks are taking heavier hits — and Tesla is clearly feeling that weight.
Given both technical structure and market sentiment, the most reasonable scenario right now is a continued move down into the 395 USD support zone to test liquidity and gauge the market’s reaction. This level remains a strong technical area and could trigger a meaningful bounce if buyers step in. However, if 395 USD breaks under negative news or persistent outflows from growth assets, the decline could extend toward 385–380 USD. On the flip side, if a major positive catalyst appears — such as notable progress in robotaxi development, better margins, or a breakthrough in battery technology — the 405–410 USD region would be the first recovery target.
For now, Tesla is standing at a “pivot zone” — a place where the market will soon reveal whether this is just a pause before another upward leg, or the beginning of a deeper corrective cycle.

GBP/USD Could Test Key Support Before ReboundingHello everyone, looking at GBP/USD on the 1H timeframe, I can clearly see the market entering a phase of consolidation, where buyers are trying to maintain control but sellers still hold a slight advantage. The pair is trading around 1.3139, sitting close to the 1.3120–1.3100 support area—where strong buying pressure previously appeared. After the sharp bounce from 1.3080, the upward momentum stalled at 1.3180–1.3200, which aligns with a bearish FVG, signalling early exhaustion in the short-term structure. The series of small candles over the past few hours reflects accumulation, as if both sides are waiting for the right moment to strike.
Meanwhile, the macro backdrop favours the USD, with the probability of a Fed rate cut in December dropping sharply, strengthening the dollar and pressuring GBP. At the same time, the UK economy provides little support—weak GDP and slow inflation progress contribute to cautious sentiment surrounding the pound.
From what I’m observing, the most reasonable scenario is for GBP/USD to continue pulling back toward 1.3120–1.3100 to retest liquidity before seeing a potential rebound. This zone remains a technically significant support, where buyers previously entered with conviction. If bullish reaction reappears—shown by wick rejections or rising volume—I expect a recovery toward 1.3160–1.3180, and possibly 1.3220–1.3250 if aided by supportive news. Conversely, only a clean break below 1.3100 would open the door to deeper downside toward 1.3050. For now, this still looks like a corrective pullback—sometimes, a pullback is simply the market gathering strength before the next upward leg.
What do you think about this scenario?

Gold Surges as Investors Rotate Back to Safe HavensHello everyone, observing XAU/USD on the 1H chart today is genuinely impressive: from the 4,000 USD/oz low last night, gold has shot straight up to 4,074 USD/oz, gaining 74 USD within just a few hours. This is the kind of recovery that signals buyers never disappeared — they were simply waiting for the right moment to strike.
On the chart, the 4,000 USD/oz zone once again proved its role as a “steel defensive line,” where demand stepped in decisively, perfectly aligning with the green FVG that previously triggered a strong bullish leg. From that area, price climbed back into the Ichimoku cloud and is now approaching the 4,075–4,085 USD/oz resistance band. This will be the gateway for the next move: if gold breaks through, the market may push directly toward 4,100–4,120 USD/oz, and even as high as 4,150 USD/oz if momentum expands. Otherwise, rejection here could send price back to 4,040–4,030 USD/oz for a breather before continuing higher. The market tone right now is classic: accumulate – break – retest, with both sides fighting over narrow zones.
Importantly, today’s strong rebound isn’t purely technical. Safe-haven flows are returning as global equities drop sharply and US macro data — particularly labour indicators — show emerging weakness. Investors are pulling away from risk assets, especially overheated tech stocks inflated by the AI wave, and rotating back into gold — the traditional shelter whenever uncertainty grows. At the same time, expectations for a possible December rate cut remain alive, causing USD strength to stall and giving additional room for gold to recover. On top of that, Bloomberg and Goldman Sachs confirmed China bought another 15 tonnes of gold in September, reinforcing the idea that major players are still accumulating — and they usually move earlier than the crowd.
Based on the current signals, I believe this rebound still has room to extend. Gold may continue toward 4,075–4,085 USD/oz to fill the remaining FVG, and if that zone breaks with firm buying interest, the 4,100–4,120 USD/oz target is completely achievable today. A mild correction may still occur if profit-taking kicks in, pulling price back toward 4,040–4,030 USD/oz to build fresh equilibrium before resuming upward. Overall, gold feels like a drawn bow at the moment — ready for a further thrust if risk-off momentum persists.
This is a phase where gold truly returns to its core identity: a refuge when confidence fades. With capital rotating back into safe assets, a dovish signal from the Fed next month could turn this rebound into something much bigger heading into December. What about you — which scenario do you lean toward for gold today?
