Gold- From weekly to 15m chart. Where are the trades?These days, everyone has an opinion on Gold.
Most of them are bullish.
And to be fair — so am I.
But here is what many traders either don’t understand or simply ignore:
There is a huge difference between having an opinion and having a tradable opinion.
A tradable opinion is one that can actually be executed in the market, with leverage, risk control, and realistic stops — not just a direction on a chart.
This analysis is not about saying “Gold is bullish, it will go to 6k or 7k, I’m a genius if it does.”
It’s about giving traders something they can actually work with.
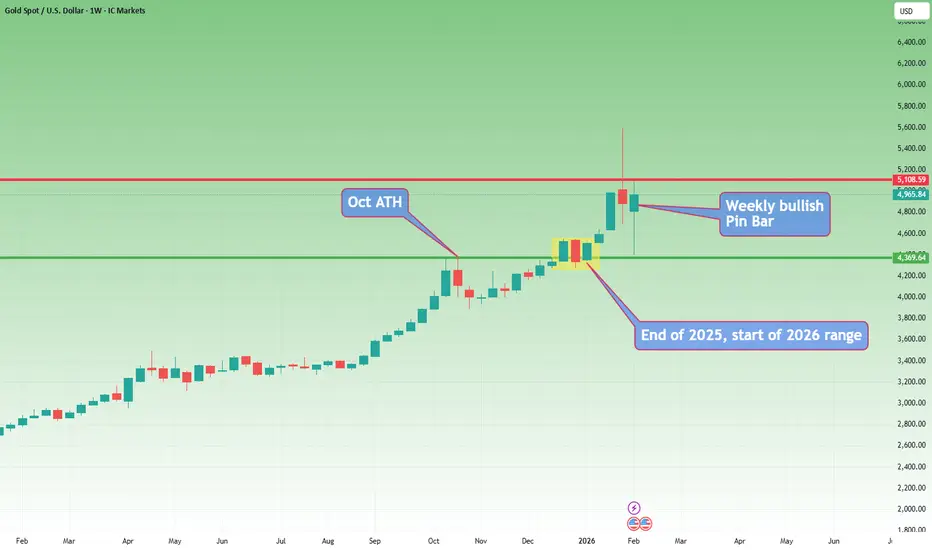
🔎 Weekly Chart — Big Picture Reality
Three things stand out immediately:
1️⃣ The 5600 → 4400 drop
Yes, it was massive:
- ~12,000 pips
- large in percentage terms
- emotionally shocking
But in long-term trend terms?
👉 Just a correction.
Even if we measure only the 2025 rally, the drop didn’t even reach a 50% retracement.
2️⃣ Technical respect of structure
The decline stopped almost exactly at the October 2025 ATH, which acted as support.
Markets remember levels.
This is not random.
3️⃣ Alignment with congestion
The drop also aligned with:
- the late-December congestion zone
- the starting price of 2026
The first prices of the year often act as major S/R zones.
This is classic market behavior.
✅ Conclusion from Weekly:
Trend is bullish. No debate here.
❌ But tradable?
Not really.
Why?
Because a correct structural stop would be ~8,000 pips away.
With leverage, that’s not trading — that’s praying.
🔎 Daily Chart — Still Bullish, Still Not Tradable
On the daily:
- clean reversal from support
- first impulsive leg up
- pullback forming a higher low
- recent Piercing Line bullish pattern
Again:
✅ Bullish structure
❌ Not tradable structure
A proper stop still sits ~4,000 pips away.
That’s not risk management.
🔎 15-Minute Chart — Where Trading Actually Happens for me lately
Given current volatility, this is what matters these days
Here’s what we see:
- initial rally in a rising wedge
- rejection from resistance
- drop from 5100 → 4650 contained within a bullish flag relative to the impulse
- breakout above flag resistance
- continuation toward 5k
- NY close near highs
Structurally?
👉 Still bullish.
But even here:
❌ Buying blindly at 4965 makes no sense.
We need a dip.
We need structure.
We need asymmetric risk.
📌 The Two Buy Zones That Make Sense
If price offers them:
✅ 4900
✅ 4800
Those are the zones where risk/reward becomes logical.
⚠️ The Reality Most Traders Don’t Want to Hear
Even on a 15M chart:
- stops of 300–500 pips are normal
- targets should be well above 1,000 pips
Let’s be honest:
Bragging about a 100-pip Gold target these days is like bragging about a 2-pip win on a EURUSD trade.
simply not trading...
✅ Final Conclusion
✔️ Gold is bullish
✔️ I will look to buy dips
✔️ But only with structure and discipline
Because in this environment:
- volatility is extreme
- emotions are expensive
- precision matters more than bias
A trader’s job is not to be right.
A trader’s job is to make money.
And those are two very different things. 🚀
P.S.
And yes — if I see a clear reversal structure on the 15-minute chart, I can take a short trade, even if my overall bias on Gold remains bullish.
This does not contradict my opinion.
It simply reflects the reality that:
You can be bullish on the bigger picture and still trade short-term corrections.
Have a nice Saturday!
Mihai Iacob
Signalservice
Lingrid | ZECUSDT Round Number Support Zone ReachedBINANCE:ZECUSDT has stabilized near the psychological 200 zone, an area that previously triggered strong demand and now aligns with the lower boundary of the descending channel. The latest drop was met with an aggressive reaction, suggesting selling pressure may be exhausting rather than expanding. Despite the broader downtrend, price behavior around this level hints that bears could be losing control in the short term.
If buyers continue to defend the 200–210 region, it may attempt a recovery toward the former breakdown area near 315, where prior range support now sits. A sustained push through that band could shift momentum further upward and challenge the descending trendline overhead.
➡️ Primary scenario: support holds at 200–210 → rebound toward 315.
⚠️ Risk scenario: a decisive breakdown below 200 might invalidate the bullish reaction and open space toward the next lower demand zone.
If this idea resonates with you or you have your own opinion, traders, hit the comments. I’m excited to read your thoughts!

Lingrid | GOLD Bearish Move Expected from Psychological LevelOANDA:XAUUSD is facing resistance at the 5,000 level above, a significant psychological threshold that has triggered a price pullback. The market recently formed a higher low following the corrective phase, but the bearish structure remains prominent as price action appears to be consolidating below the resistance zone. The rejection from this key level, combined with the ongoing downward pressure, suggests that further declines are likely.
If the price continues to face pressure at the 5,000 mark, it may proceed lower towards the 4,600 area, a support level where a potential reversal could occur. However, until the price breaches the resistance and breaks above this key zone, the bearish trend may persist.
➡️ Primary scenario: Rejection from 5,000 → potential continuation towards 4,600.
⚠️ Risk scenario: A decisive close above 5,000 could signal a shift in trend, opening the door to a move higher towards 5,400.
If this idea resonates with you or you have your own opinion, traders, hit the comments. I’m excited to read your thoughts!

Gold — Wedge Played Out... Is a New Push Above 5K Next?Two days ago, I mentioned that Gold bulls should not forget last week’s events.
Even though we had a strong rebound from Monday’s 4400 low, the structure was forming a rising wedge — a pattern that often signals a downside reversal.
And the market respected that script.
🔎 The Pattern Delivered
The downside move indeed unfolded, and during the early Asian session overnight, Gold dropped into the 4650 zone, almost perfectly aligned with the projected target of the wedge.
From a technical standpoint, that was a textbook resolution.
📈 What Changed Now
The reaction from 4650 has been very strong.
Gold not only bounced, but also pushed back above the short-term downside channel that had formed over the past two days.
That kind of reclaim suggests:
👉 sellers losing control
👉 buyers regaining momentum
📌 Outlook From Here
At least for now, it is reasonable to consider that Gold may have formed a temporary bottom.
If momentum continues to build, a new test above 5000 increasingly looks likely.
✅ Trading Plan
My approach from here:
👉 Look to buy dips, while keeping risk controlled and entries structured.
✅ Conclusion
- Wedge correction: completed
- Support reaction: strong
- Momentum: rebuilding
As always, nothing's sure — but for now, the path of least resistance looks up. 🚀

Lingrid | DOGEUSDT Potential Buy at August 2024 Low ZoneBINANCE:DOGEUSDT perfectly played out my previous trading idea . Price is currently showing signs of a rebound after reaching the lower support zone, with the price testing the August 2024 low. This support level, combined with the downward trendline, suggests a possible bounce back to higher levels, as the price remains within a range. The bullish momentum appears to be building, especially after the recent long-tailed bar formation.
The price could be on the verge of another upward move, with the risk/reward ratio pointing toward a favorable buying opportunity, especially around the 0.0900 levels. If it manages to hold the support and break above, a swift move toward 0.1090 may follow.
➡️ Primary scenario: Rebound from 0.0850 → continuation towards 0.1090.
⚠️ Risk scenario: A break below 0.0850 would invalidate this bullish outlook and indicate further downside toward 0.0800 or lower.
If this idea resonates with you or you have your own opinion, traders, hit the comments. I’m excited to read your thoughts!

Lingrid | EURAUD Bearish Entry After Correction PhaseFX:EURAUD perfectly played out my previous trading idea . Price is encountering strong resistance in the 1.7000 zone, where the price has recently formed a lower high, signaling a potential bearish setup. After the initial impulse move and a brief consolidation phase, the market seems to be undergoing a corrective phase, with the recent price action testing key resistance levels before another possible downturn. The downward channel remains intact, and the price is showing signs of exhaustion as it approaches the resistance zone.
If the price fails to break above the 1.7000 resistance level, it is likely to resume the bearish trend, aiming for the 1.68520 level, where both support and previous lows converge. This presents an opportunity for a sell position as the market could continue its downward trajectory after the correction phase.
➡️ Primary scenario: Rejection at 1.7000 → continuation towards 1.68520.
⚠️ Risk scenario: A clean break above 1.7000 would invalidate the bearish setup and could lead to a retest of higher levels toward 1.7150 or higher.
If this idea resonates with you or you have your own opinion, traders, hit the comments. I’m excited to read your thoughts!

TheGrove | USDJPY Buy | Idea Trading AnalysisEURJPY is moving on Resistance AREA..
The chart is above the support area, which has already become a reversal point twice.
We expect a decline in the channel after testing the current level and moving to resistance line
We expect a decline in the channel after testing the current level
Hello Traders, here is the full analysis.
I think we can soon see more fall from this range! GOOD LUCK! Great BUY opportunity USDJPY
I still did my best and this is the most likely count for me at the moment.
-------------------
Traders, if you liked this idea or if you have your own opinion about it, write in the comments. I will be glad ⚜️

Lingrid | USDCAD Counter-Rally Pullback Short Setup FX:USDCAD has bounced off the support zone and the price is now encountering resistance near the 1.3700 level. After a strong rally, the price is showing signs of a correction with a clear rejection around the resistance zone. This creates an ideal sell-the-pullback setup for a continuation of the downward trend.
If the price retraces towards 1.3700 and struggles to break through, the bearish momentum could resume, targeting the support level around 1.3550. A rejection from this area could lead to a deeper move towards support levels.
➡️ Primary scenario: rejection at 1.3700 → continuation toward 1.3550
⚠️ Risk scenario: a clean break above 1.3700 invalidates the short setup, suggesting a potential move towards the next resistance at 1.3927.
If this idea resonates with you or you have your own opinion, traders, hit the comments. I’m excited to read your thoughts!

Lingrid | TONUSDT Further Downside Continuation LikelyOKX:TONUSDT perfectly played out my previous trading idea . Price has broken through the support zone at 1.450, triggering a fresh leg lower. This breakdown follows the completion of a downward channel, with price action indicating persistent bearish momentum. The recent bounce has failed to reclaim key levels, and the lack of strong buying suggests sellers may maintain control.
If the price fails to reclaim 1.440–1.450, the bearish trend could continue toward 1.200, with the next major support zone aligning with the downward trendline and earlier lows. A continuation of selling pressure could trigger further downside, as momentum shifts in favor of the bears.
➡️ Primary scenario: rejection at 1.440–1.450 → continued downside toward 1.200
⚠️ Risk scenario: a clean close above 1.460 invalidates the bearish structure and opens the door for a possible reversal toward 1.667.
If this idea resonates with you or you have your own opinion, traders, hit the comments. I’m excited to read your thoughts!

Silver —Violent Swings Continue. Long-Term Still Bullish, But...Silver has clearly been the talk of the trading community at the turn of the year, and for good reason.
Price action has been nothing short of dramatic, with extreme moves in both directions.
🔥 Recap: A Historic Shakeout
Last week, after printing a 121 ATH, Silver experienced a brutal collapse of roughly 50,000 pips, dropping into the 71 zone.
That kind of move is not normal volatility — it’s liquidation and repricing.
Buyers eventually stepped in, and Monday marked a local low followed by a rebound. By yesterday, price had already recovered back above 90, reaching around 92.
Today, however, Silver dropped again and, at the time of writing, is trading back near support after only a modest rebound from it.
🔎 Bigger Picture vs. Short-Term Reality
📌 Long-term structure:
Still bullish.
On a multi-month horizon, what we are seeing can still be classified as a correction — even if it’s an aggressive one.
📌 Short-term structure:
Not bullish at all.
The rebound since Monday has a clearly corrective character, lacking impulsive strength and clean continuation.
That’s an important distinction.
⚖️ Two Different Approaches to Silver
1️⃣ Investing Approach
Buying physical Silver for long-term holding can make sense for some investors.
- You may not catch the exact bottom
- But timing matters less if the horizon is measured in years
2️⃣ Trading on Margin
This is a completely different game.
👉 Volatility here is not just “high” — it’s dramatic
👉 Stop placement becomes extremely difficult
👉 Position sizing becomes critical
In this environment:
✅ entry price matters more than bias
✅ quick adapting to market changes matters more than conviction
📌 My Personal Trading Plan
From a speculative perspective:
👉 If Silver rebounds back above 85,
I will look to sell rallies.
✅ Conclusion
Silver remains a fascinating market:
- long-term bullish
- short-term unstable
- emotionally driven
- quick and violante changes of direction
This is a market that rewards precision and punishes ego.
Trade small, plan ahead, and respect the volatility. 🚀

Gold — Back Above 5K, But Short-Term Risks Are RisingOnce again, Gold is trading above 5000, even printing a local high near 5100.
Momentum is back on the bullish side — but this is exactly where memory should matter.
Bulls should not forget so quickly that things flipped last week, and where one-directional thinking can lead in a market like this.
🔎 Technical Perspective
From a technical standpoint, the rally from Monday’s 4400 local low can also be interpreted differently:
👉 it may be a corrective structure, not a fresh impulsive trend
Price action is currently shaping what looks like a rising wedge, a pattern often associated with:
- slowing momentum
- weakening follow-through
- and potential downside resolution
This doesn’t guarantee a drop — but it shifts the risk profile.
📌 Short-Term Outlook
Because of this structure, my short-term outlook has turned bearish.
The market has already shown how quickly it can unwind when positioning becomes crowded.
✅ Trading Plan
My approach from here:
👉 Look to sell rallies
👉 stay tactical and selective
👉 avoid chasing momentum at extremes
✅ Conclusion
Gold remains powerful on the bigger picture, but short-term structure suggests caution.
When wedges form after violent moves, they often resolve fast — and usually when most traders feel comfortable again.

Lingrid | GOLD Correction Ends - Bullish Move Ahead ?OANDA:XAUUSD reacted aggressively from the resistance zone near the recent peak, but the sell-off appears corrective rather than trend-breaking. Price swept liquidity below the rising structure, tagged the higher-timeframe support zone, and quickly rebounded — a sequence that often signals exhaustion on the downside. Importantly, the broader ascending trendline remains intact, keeping the higher-low framework alive.
If price continues to stabilize above the 4,800 support area, upside pressure could rebuild toward the 5,200 level, where previous balance and unfilled liquidity sit. The sharp drop may have served as a reset, allowing momentum to reload rather than reverse.
➡️ Primary scenario: hold above 4,790 → recovery toward 5,200
⚠️ Risk scenario: sustained acceptance below 4,720 could open the door for a deeper structural pullback
If this idea resonates with you or you have your own opinion, traders, hit the comments. I’m excited to read your thoughts!

Lingrid | AUDUSD Price Compression Before Explosive MoveFX:AUDUSD perfectly played out my previous trading idea . Price has shifted into a tight compression phase after printing a clear higher low on the ascending trendline, suggesting downside momentum may be fading. Price continues to hold above the 0.7000 demand zone, while repeated reactions inside the range indicate accumulation. The market structure remains constructive as sellers fail to force acceptance below trend support.
If this base remains intact, price could attempt an upside expansion toward the 0.71000 resistance, where prior highs and the upper channel boundary converge. That zone may act as the next liquidity target if momentum accelerates following the compression.
➡️ Primary scenario: hold above → breakout toward 0.71000.
⚠️ Risk scenario: sustained trading below 0.6980 would weaken the structure and delay bullish continuation
If this idea resonates with you or you have your own opinion, traders, hit the comments. I’m excited to read your thoughts!

Lingrid | ADAUSDT Price Reaches Key Demand ZoneBINANCE:ADAUSDT has completed a structured A-B-C decline into a well-defined higher-timeframe demand zone, where price is now showing signs of stabilization. The sell-off unfolded within a controlled downward channel and stalled precisely at the lower boundary, suggesting selling pressure could be losing momentum. The latest rejection from the lows hints that bears may be struggling to extend further downside.
If this support around 0.277 continues to hold, it might attempt a recovery back toward the 0.3375 region, where prior consolidation and range lows intersect. That zone could act as the first upside magnet if buyers gradually regain control.
➡️ Primary scenario: support holds at 0.2775 → rebound toward 0.3375.
⚠️ Risk scenario: sustained acceptance below 0.265 could invalidate the base and expose deeper downside
If this idea resonates with you or you have your own opinion, traders, hit the comments. I’m excited to read your thoughts!

Lingrid | GBPJPY Channel Break Triggers AccelerationFX:GBPJPY remains supported above the rising trendline after printing consecutive higher lows, suggesting buyers may still be in control of the structure. Price is compressing beneath the upper boundary of the ascending channel while holding above the previous weekly high area, a zone that could act as a springboard. The recent pullback looks corrective, with no decisive bearish follow-through so far.
If price continues to respect the 212.35 support, momentum could expand toward the 214.00 resistance, where the higher-timeframe supply converge. A confirmed push through this ceiling may trigger acceleration, as liquidity above recent highs remains untested.
➡️ Primary scenario: hold above 212.35 → continuation toward 214.00
⚠️ Risk scenario: sustained acceptance below 211.30 may weaken the bullish channel and delay upside expansion
If this idea resonates with you or you have your own opinion, traders, hit the comments. I’m excited to read your thoughts!

Lingrid | ETHUSDT Potential Buy-the-Dip Opportunity ZoneBINANCE:ETHUSDT perfectly played out my previous trading idea . The market has completed a steep corrective leg after rejecting the upper resistance zone, with price now pressing into a long-term demand area near the June 2025 low. The decline appears impulsive, but selling pressure is exhausting as price stabilizes along the lower boundary of the descending channel. The formation of a base near structural support suggests downside momentum could be weakening.
If buyers defend the 2,150–2,200 zone, CRYPTOCAP:ETH may attempt a rebound toward the broken 2,600 level, where prior support could act as resistance. A successful reaction from this demand zone could trigger a broader recovery phase, especially if price manages to reclaim the descending trendline with acceptance.
➡️ Primary scenario: support holds at 2,150–2,220 → rebound toward 2,600
⚠️ Risk scenario: sustained acceptance below 2,150 could expose deeper continuation toward the lower channel boundary
If this idea resonates with you or you have your own opinion, traders, hit the comments. I’m excited to read your thoughts!

Extreme Volatility Remains. Structure Rebuilding After Shakeout.Yesterday, Gold extended its wild behavior with a move that, at one point, reached nearly a 10% drop, only for price to reverse the entire decline — and then fall again by roughly 5%.
This kind of price action is a clear sign of unstable, high-volatility conditions, where emotion and positioning play a bigger role than clean technical flows.
🔎 Where We Stand Now
The second sell-off of the day found support around the 4600 zone, and since then Gold has rebounded back above 4800.
At the moment, price is pressing into the median line of the ascending channel, which becomes a key technical reference.
📈 What Happens Next?
👉 If price manages a clean break back above the median line, upside continuation becomes the more probable scenario.
In that case, the next clear resistance sits around:
🎯 5150 zone
That would be the next logical magnet if bullish momentum rebuilds.
📌 Trading Plan
My approach remains cautious and tactical:
👉 look to buy dips,
but only:
- if the risk-to-reward is favorable
- and with reduced position size
✅ Conclusion
Gold is still in a high-volatility regime — which means opportunity exists, but so does HUGE risk.
No chasing, no oversized positions.
In this environment, precision entries matter more than direction. 🚀

Hellena | EUR/USD (4H): LONG to MAX wave 3 (1.20813).I think that the price confirmed the extension of wave “3” and, as a result, the continuation of the upward movement.
This means that we will see new highs, but the correction in wave “4” should end before wave “5” begins.
In our case, wave “4” has either ended or will soon end in the area of 38.2% - 50% Fibonacci levels (1.18594).
Then I expect the upward movement to continue at least to the area of wave “3” high at 1.20813.
The forecast may take quite a long time to play out, so I will immediately indicate that I will consider closing positions at the level of 1.20000 if the price reaches that level after a good correction.
Manage your capital correctly and competently! Only enter trades based on reliable patterns!

Hellena | Oil (4H): SHORT to support area 62.295.Colleagues, earlier I described the upward movement as a full-fledged ABC correction, and the price justified expectations and completed the planned upward movement, but at the moment I think it is worth considering that wave A has been extended.
This fits well with both the old and new scenarios.
I expect wave “B” to begin its movement soon.
I will not set distant goals and will wait for the price to reach the first support area — the maximum of wave “3” of the middle order at 62.295.
I admit the possibility of updating the maximum of wave “A” approximately in the resistance area of 65.199.
In general, if correction “B” continues too far down, I will return to the old scenario.
Manage your capital correctly and competently! Only enter trades based on reliable patterns!

Gold — Massive Drop After 5600 ATH. Is the Correction Ending?Last week was absolutely crazy for Gold traders. After printing a new ATH near 5600 following the FOMC, price collapsed aggressively — a reminder, once again, that markets reward humility more than confidence.
To be honest, although I expected a correction, the magnitude of the drop far exceeded my expectations.
❓ The Big Question: Is the Correction Over?
With Gold falling more than 10,000 pips in just three days, the natural question now is whether the correction is nearing completion.
My view:
👉 a reversal to the upside becomes possible after such an extreme move, especially as the market approaches key technical levels.
🔎 Technical Context
- Price is now approaching a major confluence support around 4500, reinforced by:
- previous structural reactions
- the psychological round-number effect
- oversold short-term conditions after a vertical drop
This is the type of zone where markets often attempt stabilization or at least a meaningful bounce.
📌 Trading Plan
My approach here:
👉 Look to buy dips around the 4500 area, if price shows stabilization or reversal signals.
However, realism is important.
⚠️ Risk Management First
These are extreme market conditions:
- volatility is elevated
- ranges are abnormal
- reactions are fast and unforgiving
Because of that, I will trade with reduced volume and stay flexible.
✅ Conclusion
The correction may not be fully over, but the market is entering a zone where a relief bounce or reversal attempt is reasonable.
In conditions like this, survival > prediction.
Low size, clear levels, and patience. 🚀

Lingrid | GOLD Weekly Analysis: Overbought Peak and Next MoveOANDA:XAUUSD perfectly played out my previous weekly idea . The market’s turbulent week saw traders shift focus to overbought conditions, with social media buzz signaling excessive bullish sentiment. The market’s rapid ascent into the $5,600 resistance zone triggered a sharp 16% correction, underscoring the fragility of momentum-driven rallies. As the weekly chart reveals a massive rejection candle, the narrative shifts from euphoria to caution, with technical indicators flashing early warning signs of a potential trend reversal. The 4H chart’s sell-off signal and price acceleration into resistance confirm a classic exhaustion pattern, highlighting how sentiment-driven spikes often precede corrective phases.
The confluence of resistance zones—$5,120 on the weekly chart and the $5,000 monthly breakdown—creates a critical stress test for bullish momentum. The 16% drop from the all-time high resistance aligns with historical patterns where parabolic moves face mean-reversion pressure, while the $4,560 support level acts as a pivotal battlefield. A sustained break below this zone could accelerate downside momentum toward lower levels, whereas a rebound here might signal a healthy consolidation.
We should prioritize risk management as TVC:GOLD may test lower support, with a close below this level opening the door to deeper retracement. However, the broader bull thesis remains intact given persistent geopolitical tensions and central bank demand, suggesting this correction could be a strategic entry point for long-term players. Monitoring the $5,000 - $5,200 retest will be critical—failure to reclaim this level may cement near-term bearish bias, while a decisive break above resistance could reignite the rally toward $5,500. For now, the structure favors caution, with the weekly rejection candle serving as a stark reminder that even the strongest trends require periodic resets.
If this idea resonates with you or you have your own opinion, traders, hit the comments. I’m excited to read your thoughts!

Lingrid | SUIUSDT Bearish Trend Selling OpportunityBINANCE:SUIUSDT has rolled over after failing to hold the prior consolidation range, with price slipping below the descending trendline and accelerating downside momentum. The breakdown from the mid-range base suggests distribution rather than accumulation, while successive lower highs indicate sellers may still control short-term direction. The recent pullback attempts appear shallow and corrective, lacking strong buying follow-through.
If price continues to trade below the 1.32–1.35 zone, bearish continuation could unfold toward the psychological 1.00 level, where long-term trend support and demand converge. That area may act as a temporary pause, but until reclaimed levels above the broken trendline are seen, downside pressure could remain dominant.
➡️ Primary scenario: failure below 1.32 → extension toward 1.00
⚠️ Risk scenario: a sustained reclaim above 1.40 could weaken the bearish setup and force a broader consolidation
If this idea resonates with you or you have your own opinion, traders, hit the comments. I’m excited to read your thoughts!

Lingrid | SOLUSDT Momentum Slowdown: Potential ShortBINANCE:SOLUSDT remains capped below a trendline, with the latest rebound stalling inside the 125–127 supply zone. The recovery from the recent low lacks follow-through, and price action continues to form compressed candles, suggesting momentum exhaustion rather than trend reversal. The broader sequence of lower highs and lower lows remains intact.
If sellers step in around the current consolidation band, price could roll over and resume its broader decline toward the support, where the lower boundary of the descending channel aligns with horizontal demand. This zone may act as a magnet if downside pressure accelerates again.
➡️ Primary scenario: rejection from 126.5–127 → continuation toward 118.
⚠️ Risk scenario: a sustained break and hold above 127 could open room for a corrective push toward 135, weakening the short-term bearish bias.
If this idea resonates with you or you have your own opinion, traders, hit the comments. I’m excited to read your thoughts!
