30-minute USOIL Key Buy Zones AnalysisHello Guys,
I’ve prepared a USOIL analysis for you.
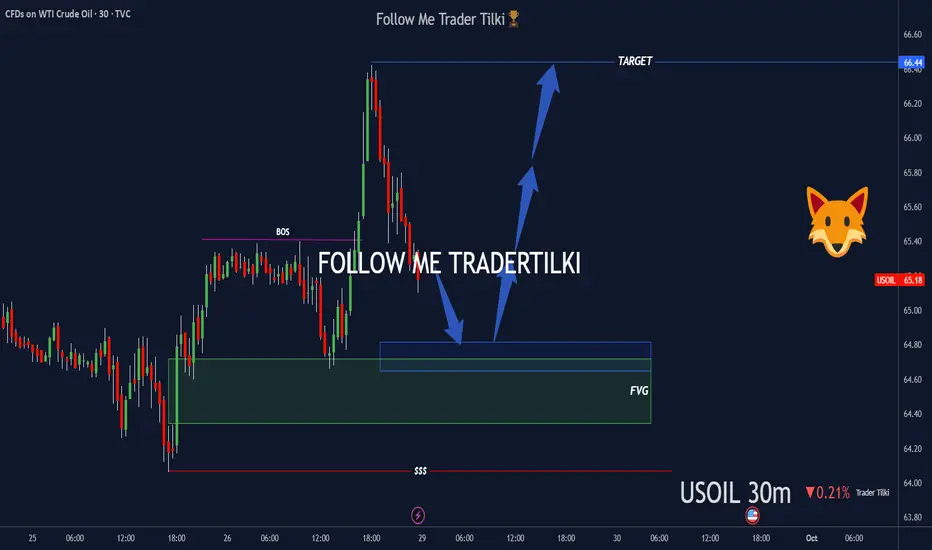
I’m watching two buy zones on USOIL:
🔹 First buy zone: 64.70
🔹 Second buy zone: 64.35 or 64,00
From these levels, I’ll definitely open buy positions and take my shot.
🎯 Target level: 66.40
Every like is my biggest motivation to keep sharing these analyses.
Thanks to everyone supporting me!
Signalservice
Ethereum Daily Technical Signal: Buy and Target 4330Ethereum Daily Technical Analysis
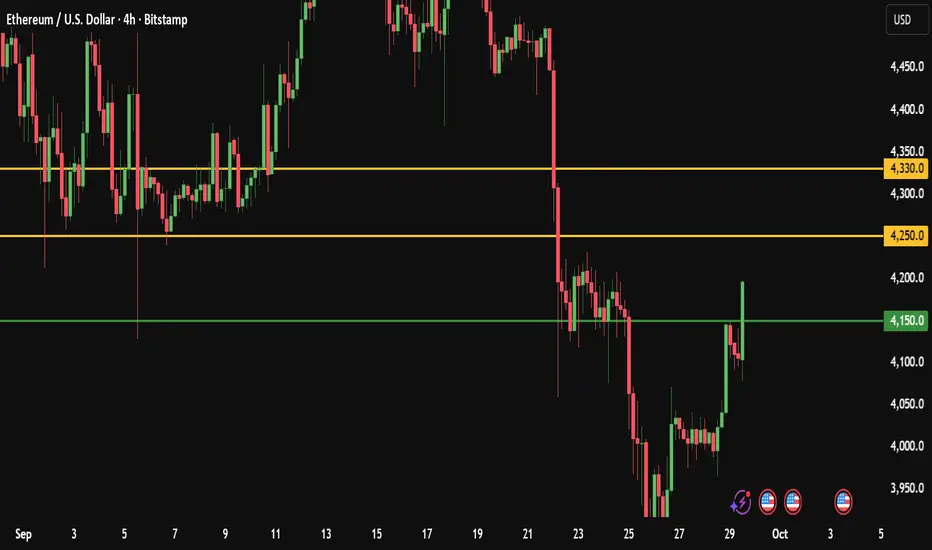
Ethereum is currently showing signs of strength as it tests the key resistance level around 4150.
A confirmed 4H candle breakout above this zone could trigger fresh bullish momentum, opening the door for higher targets in the short term.
My Personal Long Setup
If the price breaks and closes a 4H candle above 4150, I will enter a long position.
🎯 Target 1: 4250
🎯 Target 2: 4330
❌ Stop-loss: 4040
👍 Don’t forget to boost this trading idea if you found it helpful,
and follow me for more daily crypto insights and trade setups.
⚠️ Please note:
This is not financial advice – I’m only sharing my personal trades.
Always do your own research before taking action.
Best of luck 🌹
XAU/USD: When Common Sense Beats Hype1. Market Recap
Gold’s rally looks unstoppable. Fundamentals are clearly supportive and technically, the chart screams bullish .
But here comes the trader’s problem: just saying “Gold is bullish” doesn’t make a trade. Everyone knows that already. What matters is not the direction, but the structure of the trade itself.
2. The Educational Point – The 3 Pillars of Every Trade
No matter what market you trade, a professional trader always defines three things before taking a position:
1. Entry Point – where you get in.
2. Exit Point (Target) – where you aim to take profit.
3. Negation Point (Stop-Loss) – where you admit you’re wrong and cut the trade.
Without all three, you don’t have a trade — you just repeating what everyone knows.
3. The Current Problem With Gold
• If you buy at market (3816), your nearest stop is today’s low (3758). That’s ~600 pips risk, and with a 1:2 ratio, you need 3950 just to make sense of it. Not impossible, but not elegant either.
• If you wait for a dip to support at 3785, risk improves to ~300 pips. But this setup is already a 450 pip fail from the ATH — and failures at highs are not to be ignored and not very bullish either.
• Selling at market? Again tricky, because spikes in bullish trends can wipe out shorts before the market even breathes.
In short: at current levels, both long and short lack a clear, controlled setup.
4. My Trading Approach
Here’s where I apply common sense:
• Gold is already +1.5% since Friday’s close.
• If it extends to 3850, that’s where I’ll look to fade the move.
• Even if it’s not a major correction, an intraday drop is realistic. From 3850, a 500 pip move back to 3800 is enough to structure a 1:2 trade.
• If stop-loss gets hit, so be it — that’s trading.
5. Conclusion
At current price (3816), I don’t see a clean entry and I don’t have a favorite scenario. However, if Gold pushes into 3850, the most probable outcome in my view is at least a short-term correction.
This should be a trader’s mindset: not chasing every move, but waiting until risk, reward, and probability align. 🚀

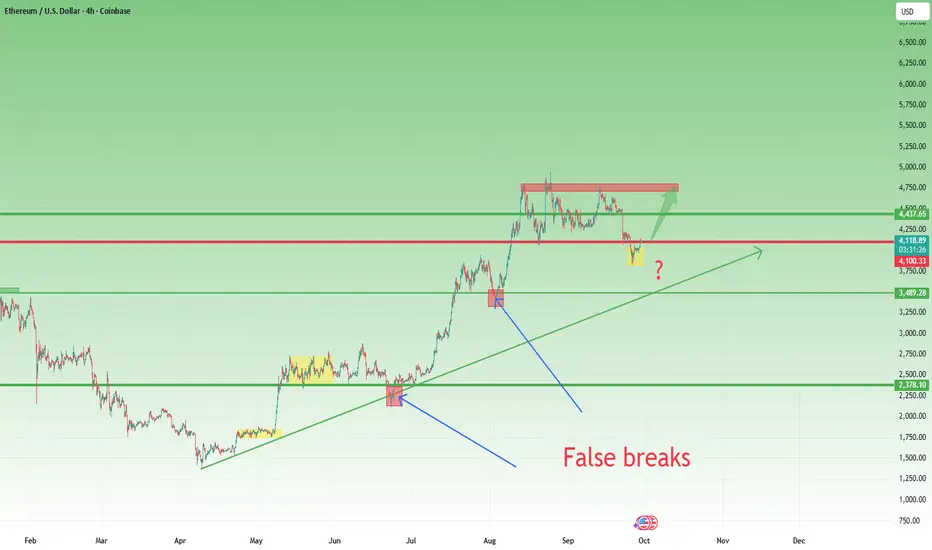
ETH Repeats the Pattern – $4800 Next Target?In my previous ETH analysis, I pointed out that while the price broke below the $4100 technical support and the $4000 psychological level, this move could represent a false break. But for this scenario to be valid, the market needed confirmation.
Since then, ETH has stabilized above $4000 and is now hovering around the $4100 level again.
📌 Looking back at the April rally (from $1400 upwards), we can already identify two similar cases of temporary breakdowns followed by strong recoveries.
• Each time, the market shook out weak hands before resuming the bullish leg.
• This repetition builds the case for another potential rebound, even if no outcome is ever guaranteed.
⚡ Trading Outlook:
• Bullish scenario: I expect ETH to rebound towards the $4400 zone, with the possibility of a retest of the $4800 resistance.
• Invalidation: A daily close back under $4000 would cancel this bullish setup and reopen the downside risk.
• Confirmation: A strong daily close near the highs of the day will add conviction to the bullish continuation.
👉 For now, the structure remains intact, and the bias stays bullish. The key levels to watch are $4000–4100 supports and $4400–4800 for resistance. 🚀
NASDAQ | Diagonal resistance | GTradingmethodGood morning Traders,
I hope everyone has had a winning week so far :)
The US100 is sitting at a pivotal point. Price is currently at all-time highs but also testing two key diagonal resistance levels — one medium-term and one short-term. These resistance lines are intersecting right now, which adds extra weight to this resistance zone.
The big question:
👉 Will the US100 break through resistance and push higher into uncharted territory, or are we about to see a short-term correction from here?
📊 Trade Plan:
Not entering a trade just yet — waiting for confirmation of either a breakout with retest or rejection and reversal.
Very keen to hear what everyone thinks, let me know please :)
Peace
G

Lingrid | GOLD Weekly Outlook: The $3,800 Battle Royale BeginsThe price perfectly fulfilled my previous weekly idea . OANDA:XAUUSD maintains its relentless upward trajectory, with persistent buying interest emerging on every meaningful decline. The precious metal has transformed into a premium "buy the dip" opportunity, reflecting underlying strength that continues to attract investors.
The technical picture reveals that gold is trading the support zone around $3,760, having successfully broken out of its previous range. The upward channel structure remains intact, supported by a robust trendline that has guided the rally from the $3,400 level. The re-accumulation phase visible in the charts suggests institutional positioning ahead of the next leg higher.
However, the market may be approaching a temporary consolidation phase. The 1H chart indicates potential for a 2-10% pullback toward the $3,720 - $3,710 support zone like it did before, and this area would align with the 50% Fibonacci retracement level. This healthy correction could provide an excellent optimal entry opportunity for late buyers.
The psychological $3,800 level may serve as a consolidation floor, creating the foundation for gold's next assault on higher targets. With the upward momentum firmly established and technical indicators showing bullish structure, any weakness should be viewed as a strategic accumulation opportunity rather than a trend reversal. The long-term trajectory remains decidedly bullish until the price action will show otherwise.
If this idea resonates with you or you have your own opinion, traders, hit the comments. I’m excited to read your thoughts!

Lingrid | BTCUSDT Support Hold Bottom Bounce PlayBINANCE:BTCUSDT is stabilizing after setting a higher low near 110k, signaling demand at the support trendline. Price action shows a corrective phase following the prior range breakout, with structure now coiling just above 110,760 support level. A recovery above this zone could trigger momentum toward the 114,500 resistance area and higher levels. Broader context suggests consolidation within the upward structure, leaving room for a rebound attempt if buyers defend key levels.
⚠️ Risks:
Breakdown below 109,000 would reopen downside toward 107,000 support.
Strong dollar strength or macro headwinds could cap crypto momentum.
Failure to retake 112.5k may keep CRYPTOCAP:BTC stuck in a corrective range.
If this idea resonates with you or you have your own opinion, traders, hit the comments. I’m excited to read your thoughts!

Daily Bitcoin Signal: Watching the 112,600 Breakout, target 115K
Bitcoin Daily Numeric Analysis
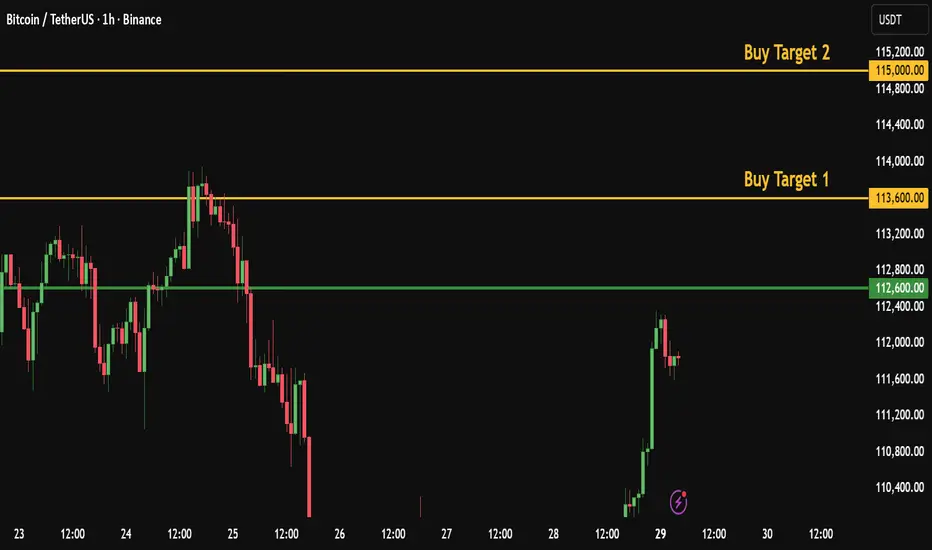
Bitcoin is currently showing signs of strength as it tests the key resistance level around 112,600. A confirmed breakout above this zone could trigger fresh bullish momentum, opening the door for higher targets in the short term.
My Personal Long Setup
If price breaks and closes a 1H candle below 109,150, I will enter a short trade.
🎯 Target 1: 108,250
🎯 Target 2: 107,500
❌ Stop-loss: 110,600
👍 Don’t forget to boost this trading idea if you found it helpful,
and follow me for more daily crypto insights and trade setups.
Please note:
This is not financial advice – I’m only sharing my personal trades.
Always do your own research before taking action.
Best of luck 🌹
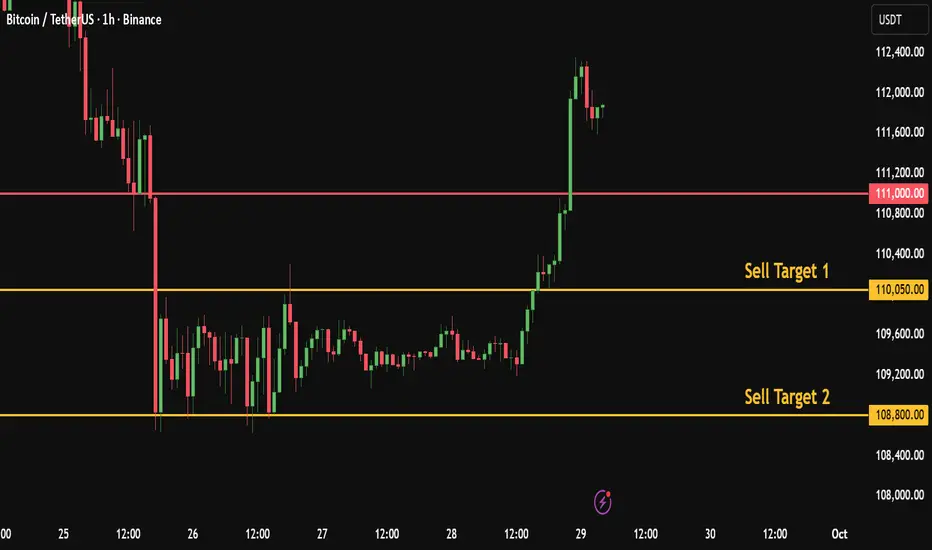
Daily Bitcoin Signal: Watching the 111K Breakout, target 108KBitcoin Daily Numeric Analysis
Based on my numeric analysis, Bitcoin is showing potential weakness near key support.
My Personal Short Setup
If price breaks and closes a 1H candle below 111K, I will enter a short trade.
🎯 Target 1: 110,050
🎯 Target 2: 108,800
❌ Stop-loss: 112,700
👍 Don’t forget to boost this trading idea if you found it helpful,
and follow me for more daily crypto insights and trade setups.
Please note:
This is not financial advice – I’m only sharing my personal trades.
Always do your own research before taking action.
Best of luck 🌹
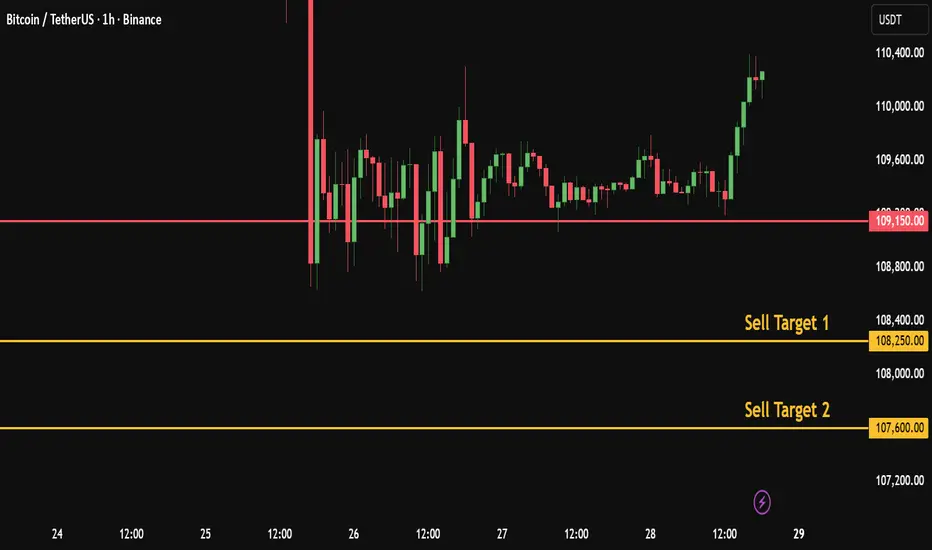
Daily Bitcoin Signal: Watching the 109K Breakout, target 107KBitcoin Daily Numeric Analysis
Based on my numeric analysis, Bitcoin is showing potential weakness near key support.
If price breaks and closes a 1H candle below 109,150, I will enter a short trade.
My Personal Short Setup
🎯 Target 1: 108,250
🎯 Target 2: 107,500
❌ Stop-loss: 110,600
👍 Don’t forget to boost this trading idea if you found it helpful,
and follow me for more daily crypto insights and trade setups.
Please note:
This is not financial advice – I’m only sharing my personal trades.
Always do your own research before taking action.
Best of luck 🌹
Daily Bitcoin Signal: Watching the 110,500 Breakout, target 113KBitcoin Technical Signal
Bitcoin is currently showing signs of strength as it tests the key resistance level around 110,500. A confirmed breakout above this zone could trigger fresh bullish momentum, opening the door for higher targets in the short term.
Here’s my personal trade plan:
If the price breaks and closes a 1H candle above 110,500, I will enter a long position.
🎯 Target 1: 111,650
🎯 Target 2: 113,200
🛑 Stop-loss: 109,500
Please note:
This is not financial advice – I’m only sharing my personal trades.
Always do your own research before taking action.
👍 Don’t forget to boost my trading idea if you found this useful, and feel free to follow me for more analysis of this kind.
Best of luck 🌹

Gold awaits PCE | EMA squeeze, big waves aheadXAU/USD – 09/26 | Captain Vincent ⚓
🔎 Captain’s Log – Context & News
Trump : Announced a 100% tariff on branded drugs if not produced in the US → escalating trade tensions.
PCE tonight : The FED’s most important inflation gauge, key to shaping October rate cut expectations (current probability 91.09%).
The market is in “hold breath” mode, awaiting the PCE spark to decide the next direction.
⏩ Captain’s Summary : Gold is squeezed between two winds – short-term EMA pressure and major expectations from PCE.
📈 Captain’s Chart – Technical Analysis
EMA : EMA 34 (yellow) remains below EMA 89 (red) → short-term bearish pressure persists, but narrowing gap signals big volatility ahead.
Golden Harbor (Support / Buy Zone)
3,738 – 3,730
3,718
3,687
3,651
Storm Breaker (Resistance / Sell Zone)
3,755 – 3,773
🎯 Captain’s Map – Trade Plan
⚡ Sell (scalp at resistance)
Entry: 3,773 – 3,776
SL: 3,783
TP: 3,755 – 3,745 – 3,734
✅ Buy (trend-follow priority)
Buy Zone 1 (Scalping)
Entry: 3,72x – 3,718
SL: 3,710
TP: 3,750 – 3,769 – 3,776
Buy Zone 2 (Deeper OB)
Entry: 3,685 – 3,683
SL: 3,675
TP: 3,690 – 3,695 – 3,700 – 3,705 – 3,7xx
⚓ Captain’s Note
“The Golden sails are being squeezed between EMA 34 & 89. Golden Harbor 🏝️ (3,734 – 3,683) remains the safe dock for sailors to await the big wave. Storm Breaker 🌊 (3,773 – 3,776) is raising fierce waves, only suitable for short Quick Boarding 🚤 scalps. Tonight’s PCE will be the decisive wind – either pushing the ship beyond 3,78x or forcing it back to retest 3,72x.”
📢 If you find Captain’s Log useful, don’t forget to Follow for the latest updates.
💬 What do you think? Will Gold break through 3,78x or retest 3,72x first?

TRX/USDT – Long-Term Buying Opportunity?1. Quick Market Recap
Since the double top near 0.37 in mid-August, TRX has been under pressure. A strong spike down early September briefly shook the market, but buyers stepped in quickly, recovering the price back into the 0.35 zone.
However, momentum faded, and the coin started to roll back again.
2. Key Question
Is this pullback simply a healthy correction in a broader bullish trend, or the start of a deeper breakdown?
3. Why I Lean Toward a Buying Opportunity
• The overall trend remains bullish despite the correction.
• The quick recovery from the September spike showed strong buyer interest.
• Supports at 0.30 and 0.2750 align with attractive long-term accumulation zones.
4. Trading Plan
• If price breaks below 0.33, I will watch for a retest of the 0.30 support — a strong level that held earlier this month. For me, this is a medium to long-term entry opportunity.
• If the correction extends deeper toward 0.2750, I plan to DCA (dollar-cost average) into the position.
• My medium/long-term target remains 0.50, aligning with the bullish structure of TRX.
5. Final Note
Corrections in bullish markets are often where the best opportunities appear. TRX fits this pattern well, and in my opinion, it’s shaping up as a solid candidate for accumulation with a 0.50 target 🚀

Lingrid | DOGEUSDT Buy at Potential Demand ZoneBINANCE:DOGEUSDT is testing the critical support level around 0.22900 after a significant -28% retracement from its recent highs near the resistance zone. The price action shows a completed triangle pattern breakout that led to bullish momentum, followed by a corrective move that has brought the pair back to test the lower boundary of the trading range. A sustained hold above the 0.22000 psychological level could signal renewed buying interest and potential for another leg higher toward the resistance zone.
💡 Risks:
Break below 0.22000 support could trigger further downside toward the 0.18810 price rebound level
Triangle pattern failure if price cannot reclaim higher ground within the established range
Broader crypto market weakness could pressure DOGE regardless of technical setup
If this idea resonates with you or you have your own opinion, traders, hit the comments. I’m excited to read your thoughts!

Btc / UsdtCOINBASE:BTCUSD
1. **Price Action**
* BTC dropped from \~117K to \~109K.
* Current price is consolidating around **109.5K** after a sharp fall.
2. **Levels Marked**
* **117,398 (dotted red)** → Resistance zone.
* **111,849 (gray dashed)** → Mid-level resistance/support.
* **105,736 (red dotted)** → Strong support.
* **Weekly EQ Wick (around 108K)** and a **demand zone (blue box "Bags")** → Potential bounce area.
3. **Structure**
* Trend is **short-term bearish** (lower highs, lower lows).
* Price is nearing the demand zone, so buyers may step in around **107K–106K**.
4.**Inflation**
* Rate Cut Important For Bitcoin
Disclaimer : Not Financial Advice..

From 4800 Highs to 3850 Lows – ETH Eyes RecoveryAfter a fresh test of the 4800 zone in mid-September, ETH started to decline, with the selloff accelerating after September 22nd, in line with the broader crypto market weakness.
The drop broke below the 4100 technical support and even under the psychological 4K mark, sending price as low as 3850.
Yesterday, however, ETH managed to recover part of the losses and climbed back above 4K, a positive sign for the bulls.
From a structural point of view, the overall trend remains strongly bullish, and I see this move as nothing more than a correction and a hunt for liquidity at lower levels.
Trading Outlook:
• In the coming days, I expect ETH to reclaim the 4100 zone, turning the breakdown into a false break.
• If that happens, the door opens for upside continuation, with potential to retest 4500 and even challenge the 4800 resistance again.
• For now, I remain on the sidelines, waiting for confirmation before taking a new position.

BTC – Key Supports Breaking, Bears Gaining ControlAfter reaching a local high around 118K in mid-September, Bitcoin turned lower and yesterday broke decisively below the important 112K support.
The break accelerated the selloff, sending price tumbling into the next key zone around 108,500 – 109,000.
With a clear lower high now in place compared to the 124,500 ATH, the structure doesn’t look favorable for the bulls. On the contrary, there are strong chances of continued downside pressure, with the 100K level standing out as the next major magnet for price.
Trading Plan:
• As long as 112,000 – 112,500 holds as resistance, I maintain a bearish bias.
• The strategy remains to sell rallies into resistance, keeping targets toward 105K and potentially 100K.
• Only a decisive reclaim above 112.5K would weaken the bearish case and force me to reassess.

Lingrid | GOLD Retracement Complete Potential ContinuationOANDA:XAUUSD pulled back after hitting the 3,790 resistance but continues to respect the upward trendline and channel structure. Price action shows a trend continuation setup with consolidation zones acting as mid-support. As long as 3,730 holds, buyers may attempt another push toward the 3,800 and higher resistance zone. Overall momentum remains bullish, supported by higher lows and sustained channel direction.
⚠️ Risks:
Failure to hold 3,730 could trigger a deeper correction toward 3,700 support.
Strong USD recovery on economic data like GDP may weigh on gold prices.
Sudden shifts in bond yields could reduce safe-haven demand.
If this idea resonates with you or you have your own opinion, traders, hit the comments. I’m excited to read your thoughts!

Lingrid | GBPUSD Follow Through Trade Setup ReadyFX:GBPUSD continues its decline after rejection from the resistance zone, following a sharp selloff that pushed price back into the descending channel. Price action is consolidating within a downward structure, with a triangle breakdown fueling bearish continuation. A failed recovery above 1.3400 would keep momentum tilted toward the 1.3277 support level. The broader trend remains bearish as long as the channel holds resistance.
⚠️ Risks:
A strong reclaim above 1.3400 could trigger short covering.
Shifts in USD fundamentals (Core PCE Price Index data) may weaken bearish bias.
Unexpected positive UK economic releases could support GBP and break the channel.
If this idea resonates with you or you have your own opinion, traders, hit the comments. I’m excited to read your thoughts!

Lingrid | TONUSDT Break Lower Retesting Year LowOKX:TONUSDT has slipped lower after repeated rejections from the resistance zone, with sellers controlling momentum. Price action is carving a downward structure under the descending trendline, while the failed breakout highlights weakness. A move under 2.60 could confirm continuation toward the 2.34 support zone. Broader momentum favors bearish extension as long as resistance holds firm.
⚠️ Risks:
Break above the descending trendline could invalidate the bearish outlook.
Macro or crypto-wide relief rally could lift OKX:TONUSDT back toward 3.00.
Unexpected bullish sentiment shift in altcoins may reduce sell pressure.
If this idea resonates with you or you have your own opinion, traders, hit the comments. I’m excited to read your thoughts!

Hellena | EUR/USD (4H): LONG to the resistance area 1.18935.We did pretty well last week and I was waiting for the correction to show us its movement in wave “4”. Now I believe that the correction is coming to an end and I expect the upward movement to continue in wave “5”.
I think that we will target the resistance area at 1.18935.
Fundamentals:
Euro is supported by stable inflation in the Euro area at 2.0% YoY in August, while in Germany it ticked slightly higher to 2.2%. Meanwhile, the U.S. Dollar Index (DXY) trades around 97.77, showing that dollar pressure hasn’t intensified.
Manage your capital correctly and competently! Only enter trades based on reliable patterns!

GBPUSD – Rebound Before the Next Leg DownIn my previous GBPUSD analysis, I pointed out that the pair could reverse sharply and head toward the 1.32 support zone.
That move has already begun: after reaching a high slightly above 1.37, the pair dropped aggressively into the 1.3335 interim support.
Currently, price is in the middle of a normal rebound, which I see as a potential setup for sellers rather than a change in trend.
Key Levels & Trading Plan:
• The sell zone is between 1.3460 – 1.3500, where I expect bears to regain control.
• My downside target remains 1.3200, in line with the broader bearish structure.
• Only a decisive break above 1.3500 would force me to re-evaluate this view.
For now, this rebound looks like an opportunity to rejoin the trend from better prices 🚀

Lingrid | USDCHF Channel Exit Long OpportunityThe price perfectly fulfilled my previous idea . FX:USDCHF rebounded from the 0.78465 support and is testing the downward trendline again after forming a higher low structure. Price action shows a triangle breakout attempt supported by an upward trendline, suggesting growing bullish pressure. A sustained move above 0.79350 opens the door toward the 0.80000 resistance zone. Broader structure hints at an inverse head and shoulders pattern forming on the higher timeframe.
⚠️ Risks:
Rejection at the downward trendline could push price back toward 0.78465 support.
Strong CHF inflows from risk-off sentiment may limit upside.
Upcoming US data surprises could shift momentum against the setup.
If this idea resonates with you or you have your own opinion, traders, hit the comments. I’m excited to read your thoughts!
