Lingrid | XRPUSDT Short from Resistance Confluence ZoneBINANCE:XRPUSDT perfectly played out my previous trading idea . Price bounced sharply from the lower low, but price is now approaching a heavy confluence zone around 2.4340, where the upward trendline, the channel border, and the resistance block all meet. This is the same area that previously produced two lower highs, making it a structurally significant turning point. Unless buyers break through this cluster with strong momentum, the rally is likely to fade.
From a market perspective, CRYPTOCAP:XRP remains fundamentally sensitive to risk sentiment and regulatory headlines, while broader crypto flows remain mixed. If sellers defend the 2.4340 region again, the structure favors a continuation lower toward 2.0600.
➡️ Primary scenario: rejection from 2.4340 → move toward 2.0600.
⚠️ Risk scenario: breakout above the confluence flips momentum and opens the path toward 2.83 resistance.
If this idea resonates with you or you have your own opinion, traders, hit the comments. I’m excited to read your thoughts!
Signalservice

DXY Coils Above 100 – Build-Up Before the Breakout?1. Recap of Recent Analysis
In my last DXY update, I highlighted the 100.00 zone as both a major psychological resistance and my initial upside target for the entire rise from 99.
Price reached that zone perfectly.
Since then, the index has been consolidating, but not in a weak way — the structure looks tight, controlled, and directional, not corrective or exhausted.
2. Current Market Context – Sideways, But With a Bullish Tilt
What stands out in this consolidation is:
- DXY is not rejecting 100 zone aggressively.
- Candles are small but.
- Sellers are not showing real control.
This type of behavior suggests a market that is building energy, not one that is rolling over.
The sideways action appears more like a pause before a breakout, not the start of a larger correction.
3. Technical Outlook – Trend is Up Since Mid-September
The broader structure is clear:
- DXY has been in an uptrend since mid-September.
Based on the trend, structure, and consolidation behaviour, the probability favors upside continuation.
Next technical target:
➡️ 102.00 zone
This level stands out as the next meaningful resistance and a natural extension of the current rally.
4. Trading Plan – Follow the Trend, Don’t Fight It
My approach remains simple:
Bullish outlook stays active as long as DXY holds above 99.20.
I expect a break above resistance soon, especially if volatility picks up.
First major target: 102.
Only if DXY fails dramatically at 100 with strong rejections would I consider a short-term bearish adjustment — not the case right now.
5. Conclusion – The Dollar Looks Ready for the Next Push
The index is coiling at resistance, but the structure favors buyers, not sellers.
Given the steady uptrend since September and the controlled consolidation just above 100, the most probable scenario remains an upside continuation toward 102. 💵📈

Below 51, Silver Remains Heavy – Watching 47.50 Next1. What Happened After Last Week’s Call
As expected — and exactly as outlined in last week’s analysis — Silver reversed sharply from the sell zone above 52, dropping nearly 4,000 pips from that level.
This was a textbook reversal from resistance, confirming that the 52+ area is a major rejection zone for the metal.
After the drop:
- Price reclaimed the 49 support, showing short-term stabilization,
- But failed to regain the 50.50 zone, which was crucial for a genuine bullish recovery.
- Instead, Silver has now slipped into a sideways consolidation, showing hesitation and lack of strong buyers.
2. Current Market Context – Not the Same as Gold, but Still Bearish
While Silver’s structure is not identical to Gold’s, it shares the same underlying message:
➡️ The market is heavy, not neutral.
Key observations:
- The rebound lacked momentum.
- Every rally since the drop has been corrective, not impulsive.
- The failure at 50.50–51.00 confirms that sellers are still defending this zone aggressively.
This leaves Silver stuck under resistance with a bearish tone, despite the temporary bounce above 49.
3. Technical Outlook – Preparing for the Next Leg Down
Resistance zone:
50.50 – 51.00
This remains the decisive ceiling.
As long as Silver stays below this band, the market structure is bearish, and every rally into this area is a sell opportunity.
Support zone:
49.00
A key reference point.
If Silver breaks below 49 again, sellers will likely push aggressively.
Downside target:
47.50 zone
This is the next major support, and the most logical destination for a completed second leg down.
Given the current rhythm of the market, a drop into this zone is highly plausible if 49 gives way.
4. Trading Plan – Clear, Simple, Disciplined
- Sell rallies into 50.50–51.00 resistance
- More confirmation if price approaches 49 again
- If 49 breaks, expect a continuation toward 47.50
Bias changes only if Silver reclaims 51 with strong buying (low probability for now)
No need to overcomplicate this setup — the market is offering clear technical boundaries.

Lingrid | GOLD Weekly Analysis: Coiled Spring at Key CrossroadsOANDA:XAUUSD price action has settled into a tense, range-bound struggle, repeatedly testing the ascending trendline that has defined its path since late October. This persistent retest is a double-edged sword: while it demonstrates underlying buying interest, it also signals exhaustion and a growing risk of failure. The market is now at a critical juncture where the next decisive move will determine the immediate direction. A close below this trendline would be a significant bearish signal, such a break often triggers a deeper corrective pullback to complete an ABC pattern. Conversely, a strong breakout above the recent lower high near $4,130 could reignite the bullish momentum and target the $4,200 resistance zone.
The broader structure on the 4-hour chart reveals a clear downward channel forming from the peak in mid-October, with price currently trapped between the channel’s upper boundary and the ascending trendline support. This creates a tightening triangle pattern, a classic consolidation formation that typically precedes a sharp, directional move. Key levels to watch are the immediate support around $4,020 and the more substantial monthly low near $3,930. The current corrective move phase suggests the market is digesting prior gains, and the upcoming catalyst—whether it’s a fundamental driver or pure technical exhaustion—will likely force a resolution. The repeated tests of resistance near $4,230 have so far been unsuccessful, reinforcing the view that bulls lack the conviction to push higher without a catalyst.
For us the strategy is simple: wait for the breakout. The neutral stance is warranted as long as price remains within the converging trendlines. A close below the ascending trendline would be a clear sell signal, targeting the $3,930 support area. On the flip side, a sustained move above $4,150, especially with increasing volume, would be a buy signal, opening the path toward $4,200 and potentially $4,300. Until then, the market is in a holding pattern, with the balance of power shifting with every candle. The key takeaway is that the longer price trades in this narrow range, the more explosive the eventual breakout is likely to be, making patience the most valuable tool for navigating the coming week.
If this idea resonates with you or you have your own opinion, traders, hit the comments. I’m excited to read your thoughts!

Lingrid | BTCUSDT April Lows Revisit - Possible Reversal ZoneBINANCE:BTCUSDT is rebounding from the major support zone near 82,300 after completing a full extension inside the downward channel. Price is now pressing into the descending trendline — a level that has capped every bullish attempt since early November. The market is forming a higher-low structure on the retest, hinting at an early accumulation phase.
From a fundamental side, Bitcoin is stabilizing as ETF inflows recover and risk sentiment improves after softer U.S. data this week, reducing pressure on high-beta assets. If buyers manage to break above the descending trendline and reclaim 93,300, this would confirm the start of a bullish recovery cycle.
➡️ Primary scenario: Break above the trendline → move toward 93,300.
⚠️ Risk scenario: Failure to break the trendline sends CRYPTOCAP:BTC back to for another liquidity sweep.
If this idea resonates with you or you have your own opinion, traders, hit the comments. I’m excited to read your thoughts!

Gold Dancing Around 4050– Will the Market Rhyme With Last Month?1. Recap of Last Week’s Price Action
Last week started with a fake attempt at recovery:
Gold reversed early in the week back above 4100, reaching a local high around 4133.
From there, sellers stepped back in and pushed the price lower, bringing us once again into the familiar 4050–4100 range I have been talking about for days.
On Friday, we had a classic whipsaw:
- Price dipped below 4050 support,
- Then reversed sharply and tested 4100 resistance again,
- Only to close the day slightly above support, right back inside the range.
Today, during the Asian session, selling pressure returned and Gold is trading below 4050 support once again. The market is still orbiting this key zone like a magnet.
2. Current Technical Picture – A Heavy Market Hiding Behind a Sideways Range
Right now, the chart shows:
- Well-defined resistance: 4100–4110
- Broken/fragile support: 4050
- Key downside reference: 3900 zone
Even though we are “just” ranging between 4050 and 4100 most of the time, I still see the structure as heavy, not neutral.
The fact that:
- Every bounce above 4100 fails quickly, and
- Every dip below 4050 gets a bit deeper or a bit more frequent,
…suggests that sellers are slowly gaining control, even if there is no clean breakdown yet.
3. Bigger Picture Outlook – Why I Still Expect 3900 📉
My medium-term outlook remains the same:
➡️ I still expect a drop toward the 3900 zone.
Why?
- Failed upside follow-through:
- The reversal back around 4100 looked promising for bulls, but there was no continuation. That kind of failed breakout often precedes a deeper leg down.
Support erosion at 4050:
4050 used to be a clean support. Now it’s constantly pierced, reclaimed, then lost again. When a level is “played with” too much, it often breaks properly later.
Lack of strong bullish candles:
We see bounces, yes, but not the kind of decisive ones that normally start a new leg up.
Because of this, I still see 3900 as the next logical destination once the market finally gives up on this range.
For now, I’m out of the market, waiting patiently to sell rallies, not chase price in the middle.
4. The “Rhyme” With Last Month – A Speculative but Interesting Angle 📅
“Markets don’t repeat, but they often rhyme.”
If we look back at last month’s end-of-month action, there’s an interesting similarity in structure:
- On Thu 23 Oct, we had a low, then a reversal up.
- By Mon 27 Oct, price was back to support around 4050 – yes, the same 4050 zone we’re dealing with now.
- On that Monday, we then got the real break, followed by a 1,500-pip drop into Thu 28 Oct.
Now compare that to the current price action:
- We have a low → bounce → failure → back to 4050 pattern,
- We’re again at (or just under) 4050,
- The broader structure feels like a tired consolidation after an earlier strong move.
Is this a guarantee that we’ll see another sharp fall like last time?
👉 Of course not. This is only speculation and observation.
But the similarity in the structure is worth keeping on the radar, especially considering that:
- We’re again at 4050,
- We’re again in a sideways consolidation after a strong leg down
- And again the market seems to be “deciding” whether to finally break.
If the “rhyme” plays out, we might see:
- A bit more back-and-forth around 4050–4080,
- A clean, decisive break of 4050,
- A more direct move toward 3900 (or even beyond) with less hesitation than now.
5. Trading Plan – What I’m Actually Doing (Not Just Thinking)
Despite the interesting fractal and speculation, my plan stays simple and disciplined:
- I’m currently out of the market – volatility around 4050 is messy.
- I’m looking to sell rallies, especially if we see:
- Price popping back into 4100 area, but failing to hold, or
- Weak, corrective rebounds into resistance after another dip.
I’m not interested in chasing shorts after a big down candle at 4010 or 4000. I want price to come to me, not the other way around.
Target remains: 3900 zone.
If the market gives a similar “impulsive leg” as it did last month, this level can be reached faster than most traders expect.
6. Conclusion – Logic First, Speculation Second
Bias: still bearish.
Key level: 4050 – the market is clearly “fighting” around this line.
Plan: stay patient, sell rallies, target 3900.
The October “rhyme” is just an extra narrative layer – nice to watch, but risk management and levels still come first.
If the market decides to repeat that end-of-month pattern, I’ll be ready. If not, I’ll still trade the levels, not the story. 😊

Lingrid | GOLD Possible Long Opportunity At Channel FloorOANDA:XAUUSD perfectly played out in my previous idea. Price is pulling back toward the key 4,000 support zone after failing to hold above the mid-range level near 4,130, where sellers re-entered the market. The structure still respects the ascending trendline, forming a sequence of higher lows that keeps the broader bullish outlook intact. If buyers defend the 4,000–4,025 zone again, a rebound toward 4,145 becomes the primary scenario as demand builds at trendline support. The broader momentum continues to favor upside continuation as long as the higher-low structure remains unbroken.
⚠️ Risks:
A decisive break below 4,000 may trigger deeper downside toward 3,892.
Strong USD momentum could suppress bullish attempts and delay any rebound.
Failure to form a clean rejection candle at support may signal ongoing consolidation instead of a renewed rally.
If this idea resonates with you or you have your own opinion, traders, hit the comments. I’m excited to read your thoughts!

Lingrid | AUDUSD Relief Rally Then Downtrend ContinuationFX:AUDUSD perfectly played out my previous trading idea . Price is pulling back toward the mid-range zone after rejecting the descending trendline, confirming that sellers still control the broader structure. The market continues to form lower highs and lower lows inside the downward channel, with the recent compression breakdown reinforcing bearish momentum. If price retests 0.64750 and fails to break above it, continuation toward the 0.64150 support becomes the most likely scenario as the trend resumes. Broader context shows a consistent bearish flow, with corrective rallies repeatedly turning into continuation moves.
⚠️ Risks:
A clean breakout above 0.64750 may invalidate the bearish setup and trigger a deeper correction.
USD weakness or unexpected macro data could disrupt downside continuation.
Failure to maintain momentum along the trendline may lead to sideways consolidation instead of a clean drop.
If this idea resonates with you or you have your own opinion, traders, hit the comments. I’m excited to read your thoughts!

Lingrid | HYPEUSDT Gravitational Pull Toward Round NumberKUCOIN:HYPEUSDT perfectly played out previous trading idea . Price is breaking down from the compression zone after repeatedly failing to reclaim the mid-range resistance near 37.50, confirming renewed bearish pressure. The market structure aligns with the broader downward channel, where lower highs and weakening rebounds signal persistent seller control. If price stays below the broken support, a continuation toward the 30.00 level becomes the primary scenario as momentum accelerates to the downside. The broader pattern still reflects a market trapped in distribution, favoring further decline unless buyers reclaim the trendline.
⚠️ Risks:
A sharp reclaim of 37.50 could neutralize the bearish continuation setup.
Market-wide volatility, especially from BTC, may cause sudden corrective spikes.
Failure to maintain momentum below the trendline could lead to short-term consolidation before another move.
If this idea resonates with you or you have your own opinion, traders, hit the comments. I’m excited to read your thoughts!

Bias Still Bearish, But Confirmation Below 4050 Is Needed1. What Happened Yesterday
Gold continued to trade inside the well-defined 4050–4100 range discussed in the previous analysis.
Aside from a few small spikes, price respected the boundaries perfectly, confirming this as the current “decision zone” for the market.
2. Current Market Context
My outlook remains bearish, but as mentioned yesterday, nothing meaningful happens until 4050 breaks cleanly.
This level is acting as the floor of the range, while 4100 caps every bullish attempt.
We are simply waiting for confirmation.
3. Technical Outlook
The levels are very straightforward:
- Below 4050 → bearish continuation
A decisive break opens the path toward 3900, which remains the primary downside target.
- Above 4100 → bullish extension
A clear breakout and stabilization above 4100 would give scope for a move toward 4200.
Until one of these levels goes, expect more range-bound trading.
4. Trading Plan
No changes from yesterday:
Bias stays bearish, but only with confirmation below 4050.
If price breaks above 4100, short-term upside to 4200 becomes the higher-probability scenario.
5. Conclusion
Gold is trapped in a tight range, and the next major move will be decided by a clean breakout from 4050 or 4100.
For now, patience is key.

Hellena | SPX500 (4H): LONG to resistance area of 6775.Dear colleagues, according to the last forecast the price is at the support level, but as it turned out, the correction in wave “4” is a bit more complicated than I thought.
Wave “4” consists of three waves “ABC” and should be over soon. The upward movement is still in priority, but I will target the not so distant resistance area of 6775.
Once it is reached, we will think about how to reach higher levels.
Manage your capital correctly and competently! Only enter trades based on reliable patterns!

XAU/USD | Gold Approaching Key Intraday Supply Zone! (READ)By analyzing the #Gold chart on the 4H timeframe, we can see that after dropping to 3998 dollars, price found strong demand and has now climbed back up to around 4050 dollars.
Keep an eye on the 4056–4064 zone for a potential SELL reaction, as this is a key supply area.
This analysis will be updated soon, and all important supply and demand zones are already marked on the chart.
Please support me with your likes and comments to motivate me to share more analysis with you and share your opinion about the possible trend of this chart with me !
Best Regards , Arman Shaban

Lingrid | CADJPY Strong Resistance Barrier Selling OpportunityThe price perfectly played out in my last idea . FX:CADJPY is stalling at the major resistance area after tagging the October 2024 high near 112.50, where price previously reacted with sharp selloffs. Price action shows an extended move within the upward channel, forming a potential exhaustion pattern as price rejects both the resistance band and the upper channel boundary. If buyers fail to hold the support, a pullback toward 111.00 becomes the likely scenario as the market cools off from overextended levels.
⚠️ Risks:
A clean breakout above 112.50 would invalidate the selloff scenario and expose 113.20–113.50.
Unexpected JPY weakness could fuel another impulsive leg upward despite resistance.
Holding above the trendline support may limit the depth of any correction and keep CADJPY consolidating instead of reversing.
If this idea resonates with you or you have your own opinion, traders, hit the comments. I’m excited to read your thoughts!

Lingrid | TONUSDT Bearish Momentum Stall - Potential ReversalOKX:TONUSDT is slowing its decline as price decelerates directly on the 1.65 support zone, where the lower boundary of the downward channel has repeatedly produced rebounds. The structure remains bearish overall, but the price action inside this buying area shows early stabilization after a sharp move from the mid-range resistance. If buyers defend 1.64–1.65, a corrective rally toward 1.87 becomes the primary scenario as liquidity gathers near trendline resistance. The broader pattern favors a short-term bullish reaction before the larger downtrend potentially resumes at higher levels.
⚠️ Risks:
A clean breakdown below 1.64 may open a deeper slide toward 1.55–1.50.
Market-wide volatility from BTC could disrupt the developing accumulation structure.
Failure to reclaim the descending trendline could limit upside potential and keep TONUSDT trapped in consolidation.
If this idea resonates with you or you have your own opinion, traders, hit the comments. I’m excited to read your thoughts!

Hellena | EUR/USD (4H): SHORT to the support area 1.14647.Colleagues, the corrective movement in wave “4” seems to be completed at 1.16529.
Further I expect the continuation of the impulse movement in wave “5” at least to the support area at 1.14647.
All this impulse will mark the movement in the bigger wave “C”.
Fundamental Context
The US Dollar remains firm as markets downgrade expectations for further Fed rate cuts. This keeps pressure on the euro, especially since Eurozone macro data is still weak and provides little support. At the moment, EUR/USD is mostly driven by USD dynamics rather than European fundamentals.
Manage your capital correctly and competently! Only enter trades based on reliable patterns!

Gold Drops, Rebounds, Drops Again – Structure Still Bearish1. What Happened Yesterday
Gold reacted perfectly from the indicated sell zone, dropping almost 800 pips in a very short period.
However, immediately after the decline, the market turned violent with a 600-pip reversal, followed by another 700-pip drop overnight.
Such chaotic swings clearly show a battle between bulls and bears, with neither side managing to seize full control so far.
2. Current Market Context
This is one of the most difficult types of environments to trade:
- Momentum is uncertain
- Volatility is extreme
- Direction changes rapidly
Still, certain levels remain crucial for identifying the next move.
3. Technical Outlook
Key levels to watch:
- 4050 support → absolutely critical for bulls
A break and sustained move below 4050 would likely open the path toward a retest of 3900
- 4100 zone → immediate upside barrier
A clean stabilization above 4100 could finally give bulls the strength to push toward 4200
Without a decisive break of either level, expect more volatile two-sided trading.
4. Trading Plan
As of now, my bias remains bearish, unchanged from yesterday.
However, I remain aware of the strong intraday volatility and the possibility of fast upside spikes.
My main scenarios:
- Below 4050 → bearish continuation, targeting 3900
- Above 4100 → bullish momentum, possible rise toward 4200
Until one of these breaks occurs, expect Gold to remain noisy and difficult.
5. Conclusion
Gold is in a highly unstable phase, with sharp 600–800 pip swings in both directions. The market is fighting for direction, but structurally, the bearish bias still dominates unless price regains stability above 4100.

Lingrid | GOLD Range Bound Resistance - Potential RejectionThe price perfectly fulfilled my previous idea . OANDA:XAUUSD is moving toward edge of the resistance zone after bouncing off support 4,000 region. Price action remains corrective, with price trading inside a wider consolidation and reacting to both the downward trendline and the mid-range level. If the market stays capped below 4,130, a move back toward 4,045 becomes the likely scenario as sellers regain short-term momentum. The broader pattern continues to reflect a compressing market where bearish reactions inside resistance are still dominant.
⚠️ Risks:
A breakout above 4,130 would invalidate the short-term bearish projection and open the way toward 4,245.
US macro data like FOMC could drive gold sharply higher against the structure.
Failure to sustain momentum below mid-range levels may lead to deeper consolidation instead of a clean drop.
If this idea resonates with you or you have your own opinion, traders, hit the comments. I’m excited to read your thoughts!

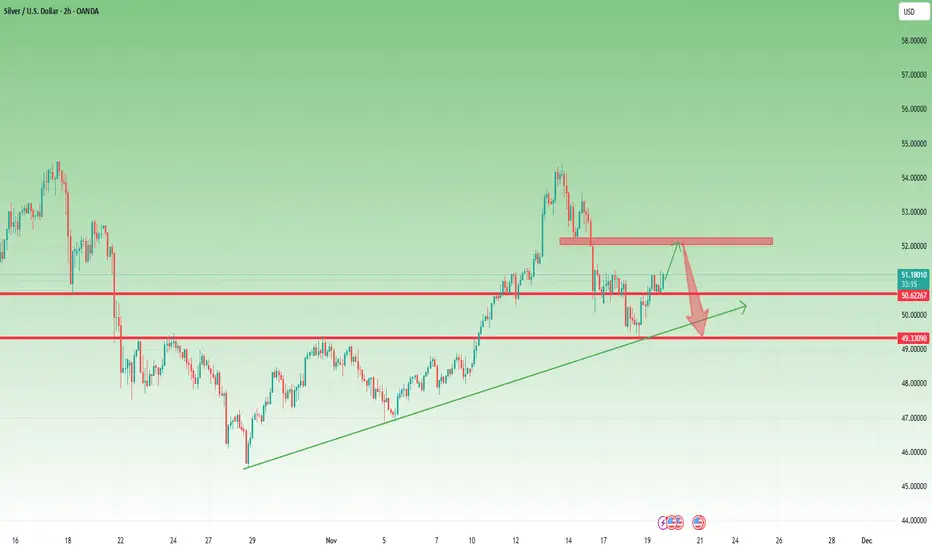
New Leg Up Possible, Yet I Expect Another Decline Toward 491. What Happened Since Yesterday
In yesterday’s analysis, I highlighted the possibility of a rebound from the confluence support and mentioned that Silver could rise toward the 50.50 resistance.
Not only did Silver reach that target — it broke above it, and the price is now trading above 51.00.
The bullish momentum was stronger than expected, confirming buyers stepped in aggressively from support.
2. Current Market Context
With price holding above 51, the short-term chart structure is slightly bullish, and a new leg up is possible in the immediate term.
However, despite this strength, I believe the overall correction is not yet complete. Silver has a habit of producing sharp counter-trend moves before continuing the broader direction.
3. Technical Outlook
Key levels to monitor:
Resistance:
- 52.00 – major short-term barrier; ideal area to search for shorts
- 50.50 – intraday resistance turned support
Support / Downside target:
- 49.00 – the next major support and my preferred downside target
Until Silver breaks and holds above 52, upside continuation remains limited in my view.
4. Trading Plan
My plan is straightforward:
If price reaches the 52 zone, I will look for short entries.
Downside target is 49.
I will reassess the bias only if Silver starts to stabilize well above 52, which would shift the structure back to bullish.
5. Conclusion
Silver exceeded expectations on the rebound, but the larger corrective structure appears intact.
Short-term upside is possible, yet I still expect another leg down, with 49 as the main target.
Gold Rebounds, But Sellers Likely Preparing for Another Drop1. What Happened Yesterday
Gold finally rebounded after the steep 2500-pip drop from the recent top.
Although I anticipated this rebound, my preferred buy zone around 3970 was never reached. Instead, Gold dipped only slightly below the 4000 figure, then climbed to the 4080 zone.
This confirms that buyers are still active
2. Current Market Context
In my view, this bounce is just a corrective move, not the start of a new bullish leg.
Momentum remains bearish, and the market structure still favors another wave of selling.
3. Technical Outlook
Key levels to watch:
- 4120–4140 → resistance zone and ideal area to hunt for new short entries
- 4080 → intraday pivot
- 3900 → next major target and strong technical support
As long as Gold stays below 4140, the path of least resistance remains to the downside.
4. Trading Plan
My plan going forward is simple:
- Look for shorts on rallies into 4120–4140
- Hold a downside target at 3900
- Reassess only if Gold breaks and stabilizes above 4140
Until then, selling strength continues to make the most sense.
5. Conclusion
Gold’s rebound was expected — but limited. With the broader trend still bearish, I anticipate another decline, potentially toward the 3900 zone. Any rally into resistance should provide attractive selling opportunities.

Gold pullbacks present buying opportunities.The gold pullback has ended, with a steady rebound after retracing to the 4000 psychological level, forming an upward trend.
Therefore, the strategy should focus on buying, following the mainstream trend.
From the current price action, the 4100 resistance level has been broken and has now become support. The Fibonacci retracement level also shows the 0.382 Fibonacci retracement is around 4092.
The 1-hour moving average for gold has turned upwards, indicating continued upward momentum. After breaking and stabilizing above 4100, gold is now steadily rising on the 1-hour chart. The 4090 area has formed short-term support, and a pullback to the 4090-4100 range presents a buying opportunity.
Therefore, we simply need to wait for a pullback to the 4090-4100 range to buy.
I personally believe the US session will provide such an opportunity.

Lingrid | AUDJPY Possible Corrective Channel BreakFX:AUDJPY is bouncing from the support after a clear rejection at the upward trendline, where price formed multiple higher lows. The market structure remains bullish on the higher timeframe as the pair holds above 100.75 and continues to respect the ascending support. If buyers maintain control above this level, a push toward the 101.730 resistance zone becomes the next likely scenario as the market retraces the previous swing high. Broader momentum suggests a continuation of the higher timeframe uptrend, with price compressing before a potential breakout.
⚠️ Risks:
A break below 100.75 could weaken the bullish structure and send price toward 100.100.
JPY strength driven by macro catalysts may cap upside progress.
Failure to hold the trendline support could trigger deeper consolidation before any further move higher.
If this idea resonates with you or you have your own opinion, traders, hit the comments. I’m excited to read your thoughts!

Lingrid | SOLUSDT Critical Support Zone Reversal WatchBINANCE:SOLUSDT rebounded from the 128–130 support zone after a clean reaction on the lower boundary of the downward channel. The market structure still leans bearish overall, but the recent rebound above the 130 signals early accumulation pressure. If price maintains support above 130, a corrective rally toward the 155 resistance zone becomes the next likely scenario as oversold conditions unwind. Broader momentum suggests a short-term bullish relief move since the market is approaching major demand zone.
⚠️ Risks:
Losing the 128–130 support zone may reopen downside toward 120–115.
Strong BTC volatility could limit the strength of any bounce.
Failure to reclaim midpoint levels of the channel may stall bullish attempts.
If this idea resonates with you or you have your own opinion, traders, hit the comments. I’m excited to read your thoughts!

USDJPY Near Major Resistance – Rising Wedge Signals Reversal1. What Happened Recently
After the gap up above resistance in early October, USDJPY has continued to climb, recently breaking above the 155.00 psychological level.
However, the entire advance of the past weeks is developing inside a rising wedge pattern — a structure that usually signals loss of momentum and often precedes a bearish reversal.
2. Current Market Context
It is also important to note that if USDJPY rises above 156.50, it enters a major resistance zone, historically triggering significant pullbacks.
So while the trend is still technically up, the risk-reward for new longs is deteriorating rapidly.
3. Technical Outlook
Key levels to watch:
- 156.50 → strong resistance; break above it creates a fade-the-rally opportunity
- Rising wedge support → a break below confirms a reversal signal
- 158.00 → invalidation; strong buying above this level cancels the bearish scenario
Downside target:
- 150.00 → main objective for a completed wedge breakdown
4. Trading Plan
I am currently preparing two sell plans:
- Break above 156.50 → fade rallies
If price spikes above this zone but fails to hold, I will look to sell.
- Break of the wedge support → trend reversal setup
A clean breakdown from the wedge would confirm that the uptrend is exhausted, offering another shorting opportunity.
5. Conclusion
Although USDJPY remains in an uptrend for now, the combination of a rising wedge, major resistance at 156.50, and weak bullish momentum makes a reversal increasingly probable.
My target is 150, with invalidation only if strong buying appears above 158.
