Lingrid | GBPAUD Structure Based Trading OpportunityFX:GBPAUD is pulling back from the resistance zone after tapping the upper boundary of the structure, where price previously formed a major swing high. The pair is still trading below the upward trendline and the latest rejection shows buyers losing momentum near 2.0360. If price slips back below 2.0190, a corrective move toward the broader support zone becomes likely as the range breakout begins to fade. Broader momentum signals a short-term bearish reaction inside the higher-timeframe resistance band.
⚠️ Risks:
A strong rebound from 2.0190 could invalidate the downside projection and restore bullish momentum.
AUD news or macro volatility could distort pullback symmetry and trigger unexpected spikes.
Holding above the trendline may keep buyers active, reducing the probability of a deeper correction.
If this idea resonates with you or you have your own opinion, traders, hit the comments. I’m excited to read your thoughts!
Signalservice

Lingrid | LINKUSDT Bearish Momentum ContinuesThe price perfectly fulfilled my previous idea . BINANCE:LINKUSDT is sliding lower after failing to reclaim the mid-range resistance near 15, keeping price capped beneath the descending trendline. The structure remains firmly bearish with a clear downward channel guiding lower highs and lower lows. As long as price stays under the 15.00 rejection zone, the outlook favors continuation toward the 11.35 support area. Broader momentum still leans to the downside as compression breaks are consistently resolving lower and sellers maintain control.
⚠️ Risks:
A sudden reclaim of 15.00 could invalidate the channel-driven bearish outlook.
Strong BTC recovery may lift overall market sentiment and reduce downside pressure on LINK.
Upcoming macro data or unexpected market volatility could trigger short-term squeezes against the trend.
If this idea resonates with you or you have your own opinion, traders, hit the comments. I’m excited to read your thoughts!

Gold Losing 4050 Support – 4K Now at Risk1. What Happened Yesterday
Gold broke below the key 4050 support zone and continued to decline, coming very close to the psychological 4000 level.
This is the most significant bearish continuation we’ve seen since the strong rally earlier this month.
2. Current Market Context
At the time of writing, price is showing only a weak and shallow rebound, hovering around 4017.
Momentum remains bearish, and structurally, the market looks vulnerable to a clean break below 4K.
3. Technical Outlook
If price continues lower, the 3950–3970 zone becomes highly relevant. This area represents a medium-term bullish demand zone, and a drop into it could offer a meaningful buying opportunity — but only with confirmation.
Right now, the structure remains bearish. A genuine shift back to bullish conditions would require:
- A reclaim of 4050, and more importantly
- A stabilization above that level, not just a wick or intraday spike.
Without that, any bounce is just noise inside a bearish trend.
4. Trading Plan
- Bearish bias remains active as long as price trades under 4050
- A flush into 3950–3970 could be a buy zone, but only if price shows clear support and reversal signs
- Until then, bulls are on defense, and shorts continue to have the advantage
5. Conclusion
Gold is under pressure, and a break below 4K is a strong possibility. A deeper drop may eventually turn into an opportunity for medium-term buyers, but at this moment the structure is bearish and caution is required.

Rebound Possible, But Below 50.50 Silver Remains Vulnerable1. What Happened Recently
After touching the old all-time high at 54.50 last week, Silver reversed sharply. Initially, the decline looked like a normal correction, and price held at 50.50 support — the level that had acted as a major bullish reference point.
However, yesterday Silver broke below 50.50, and today it is trading near the next key support zone, which now represents the line in the sand for bulls.
2. Technical Outlook
A short-term rebound from current levels is possible — markets rarely fall in a straight line — but for bulls to regain control, price must stabilize back above 50.50.
If this does not happen, the structure remains vulnerable.
The decisive level is 49.50.
A sustained break below 49.50 would likely trigger a new bearish leg, confirming that last week’s rejection from ATH was not just noise — but a meaningful shift in momentum.
3. Trading Plan
I remain cautious and will look to sell any rally back into 50.50, as long as price fails to reclaim that level.
Below 49.50, I expect continuation lower.
Only a firm close back above 50.50 would negate the bearish outlook.
4. Conclusion
Short-term bounces may occur, but the broader picture now favors downside continuation unless bulls can defend the current support and recover 50.50.
For now, the path of least resistance is lower, and I will position accordingly.

Lingrid | AUDUSD Weekly High False Breakout - Sell SetupFX:AUDUSD is rejecting the resistance block after forming a clear lower high right beneath the descending red trendline. Price is now slipping back under the minor breakout zone, showing fading bullish momentum inside the shaded range. As long as price stays below 0.6550, sellers remain in control with a clean path toward the 0.6500 liquidity zone. A break and retest of that zone may open further downside into the deeper support area.
⚠️ Risks:
A strong reclaim above 0.6550 would invalidate the bearish structure.
Sudden USD weakness could trigger a corrective bounce.
Failure to hold below the blue trendline may cause a short-term squeeze before continuation lower.
If this idea resonates with you or you have your own opinion, traders, hit the comments. I’m excited to read your thoughts!

Lingrid | GOLD Weekly Analysis: The $4,000 Gatekeeper DecidesOANDA:XAUUSD recent rally hit a wall, surrendering a significant chunk of its weekly gains as trading volume dried up, signaling waning bullish conviction. The critical resistance zone near $4,250 proved impenetrable, acting like a magnet that pulled price back down after a brief flirtation. This failure to break higher, combined with the fading volume, suggests the market run out of steam. A decisive breach below the $4,000 psychological and technical level could act as a catalyst, unleashing deeper corrective pressure and potentially retesting the recent higher low near $3,900.
Looking at the broader picture, the 4H chart reveals a powerful uptrend from October’s bottom, which has now entered a complex corrective phase. Price is currently consolidating within a triangle pattern, defined by a lower high trendline and a rising support line converging near $4,000. This setup is a classic sign of indecision; a breakdown through the triangle’s lower boundary would confirm bearish momentum and likely target the next major support zone around $3,900-$3,850. Conversely, a bounce off would invalidate this bearish scenario and could propel price toward the $4,200 resistance area once more. The previous weekly high (PWH) at $4,030 acts as an immediate pivot point; holding above it offers a glimmer of hope for bulls, while a close below it would be a bearish signal.
For the coming week, the key watchlist is the $4,000 level. If price holds firm here, expect continued consolidation or a shallow bounce toward the $4,200. However, if sellers gain control and push price decisively under $4,000, the narrative shifts entirely. We should prepare for a potential ABC corrective wave, the drop below $4,000 becomes final leg down. Keep an eye on the triangle formation; its resolution will dictate the short-term direction. At the moment, the path of least resistance lies at $4,000 — the last barrier between consolidation and correction.
If this idea resonates with you or you have your own opinion, traders, hit the comments. I’m excited to read your thoughts!

Lingrid | EURUSD Trend Continuation OpportunityThe price perfectly fulfilled my previous idea . FX:EURUSD is pulling back into the mid-range demand zone after forming a higher high inside the broader ascending channel. Price is retesting both the breakout area and the upward trendline, creating a potential higher-low formation. As long as 1.16000 psychological zone holds, the structure supports a continuation toward the resistance zone near 1.16550. The overall trend remains bullish on the 1H timeframe with buyers defending each corrective dip.
⚠️ Risks:
A daily close below 1.16000 weakens the bullish setup and exposes 1.15290.
Break of the trendline may trigger deeper corrective momentum.
Strong USD spikes during news events could invalidate the short-term bullish continuation.
If this idea resonates with you or you have your own opinion, traders, hit the comments. I’m excited to read your thoughts!

Lingrid | BTCUSDT Potential Brief Recovery Key Support ZoneThe price perfectly fulfilled my previous idea . BINANCE:BTCUSDT is pressing into the key support zone near 92,000, where price previously created a major reaction and where a fresh bullish divergence is forming. The market structure shows a clean downward channel, but price is stabilizing inside a localized compression at the bottom of the range. A rebound from 92,000 keeps the door open for a short-term rally toward the 100,500 resistance as long as buyers defend the zone. Momentum remains bearish overall, but the divergence suggests a corrective bullish swing is likely before trend direction resumes.
⚠️ Risks:
Breakdown below 92,000 invalidates the bullish rebound and exposes deeper downside.
Strong continuation of the macro downtrend may override divergence signals.
Failed reaction at mid-range resistance could stall the bullish leg earlier than expected.
If this idea resonates with you or you have your own opinion, traders, hit the comments. I’m excited to read your thoughts!

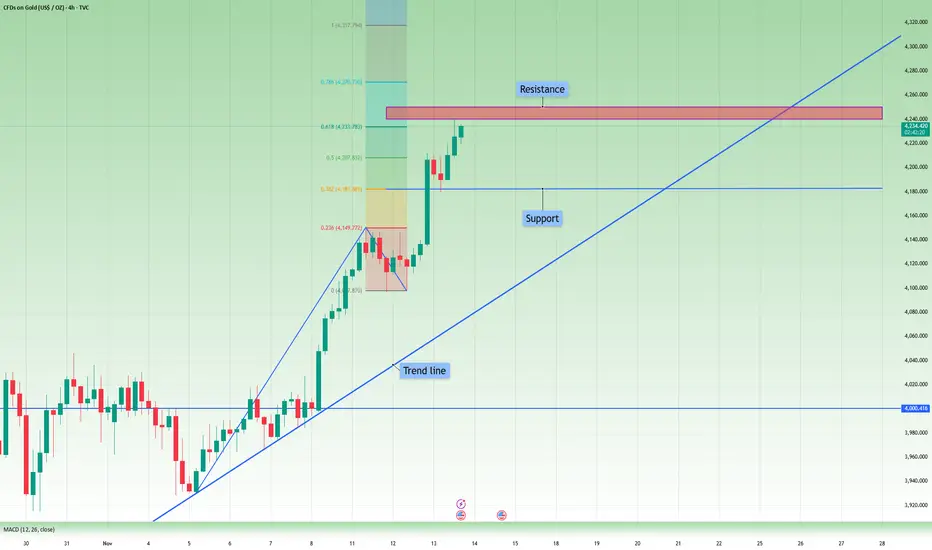
Hellena | GOLD (4H): LONG to resistance area of 4382.Colleagues, in the last forecast I made a markup of corrective movement (ABC), but the price broke important resistance levels and it means that the price is still in the impulse, namely in the wave “5” of higher order and wave “3” of medium order.
I believe that soon we will see a correction in wave “4”, then an upward movement to the resistance area of 4382.
The correction in wave “4” may reach the support area of 4075, but I still recommend to work with pending orders and look out for long positions.
Fundamental context
The gold market continues to benefit from favourable conditions: demand for safe-haven assets is increasing amid global uncertainty and a weaker US dollar. At the same time, central banks’ purchases of gold remain at record highs, providing a strong structural base for further upside. Despite the recent pullback, the key drivers — low real interest rates and reserve-diversification efforts — remain intact.
Manage your capital correctly and competently! Only enter trades based on reliable patterns!

Lingrid | XRPUSDT Flag Pattern Exit Downside MoveBINANCE:XRPUSDT remains trapped inside a clear downward channel, repeatedly rejecting both the resistance trendline and the mid-range supply zone around 2.4150. The chart shows multiple fake breaks and failed bullish attempts, confirming sellers are still in control. Price is now forming a small corrective bounce, but the structure points to a continuation pattern toward the lower support. As long as CRYPTOCAP:XRP stays below 2.4150, the likelihood of a bearish extension toward the 2.0000 target zone remains high.
⚠️ Risks:
A clean breakout above 2.4150 may invalidate the bearish continuation.
Strong market-wide bullish momentum could slow down the drop.
Sideways compression within the flag could delay the move.
If this idea resonates with you or you have your own opinion, traders, hit the comments. I’m excited to read your thoughts!

Gold faces a test at 4100; time to prepare for positioningGold’s Downtrend Intensifies:
The decline in gold has accelerated, with the previous support at $4,150 now decisively broken. Based on prior price action, the next key support is located near $4,100, a level that the market tested twice during the earlier consolidation phase but failed to break, indicating strong structural support.
At the same time, the ascending trendline also converges near this area, adding further reinforcement to the support zone.
Therefore, $4,100 can be considered the key pivot level going forward. Should this level be breached, gold could face deeper downside risk, with a potential move back toward the $4,000 psychological level not out of the question.
However, as noted, the $4,100 area carries significant support, so monitoring the price reaction closely will be crucial. If this level holds, long positions may be considered.
If $4,100 breaks decisively, I believe momentum shorts (trend continuation trades) become viable.

XAUUSD: Focus on trading opportunities at these two levels todayMarket Review:
Yesterday, the U.S. government struggled back into operation, and gold reacted with a sharp spike followed by an equally sharp reversal. During the U.S. session, prices once again tested the $2,240–$2,250 resistance zone, but failed to break through and subsequently plunged, giving back the entirety of the day’s gains.
In yesterday’s trading strategy, I highlighted the $2,240–$2,250 resistance area, noting that failure to break above would provide a short opportunity. The nearly $100 price drop that followed should have allowed anyone who followed the strategy to secure substantial profits.
Market Analysis:
On the 1-hour chart, the key short-term resistance for gold is around $2,210—the rebound high from last night and also the 0.5 Fibonacci retracement level.
As long as $2,210 fails to break, gold is likely to maintain a range-bound to bearish bias today, offering opportunities to position on the short side.
Key support lies at $2,150, which coincides with a previous swing high and the lowest point of yesterday’s retracement rebound. If prices pull back to this level without breaking below, it provides a potential long entry setup.
Trading Strategy:
The strategy is straightforward
$2,210 and $2,150 are today’s critical levels.
As long as these levels hold, each offers an entry opportunity.
It’s best to avoid chasing breakouts; instead, focus on selling high and buying low within the defined range.
Overall, short setups from higher levels appear more favorable for today’s market conditions.

Lingrid | GOLD Potential Channel Retest. Long From SupportOANDA:XAUUSD is climbing back above the broken range structure and retested the 4,150 zone while maintaining bullish pressure from the recent breakout. The chart shows price riding along the upward trendline and forming a higher-low structure beneath the descending trendline. A clean hold above 4,150 keeps the path open for continuation toward channel border at 4,285 as long as buyers defend the retest. Overall, momentum leans bullish with a projected extension into the resistance zone.
⚠️ Risks:
A H4 close back below 4,150 would weaken the bullish continuation setup.
Strong USD data this week could trigger a deeper corrective pullback.
A rejection from the descending red trendline may stall upside momentum and force consolidation.
If this idea resonates with you or you have your own opinion, traders, hit the comments. I’m excited to read your thoughts!

Lingrid | TONUSDT Demand Area Long Entry OpportunityThe price perfectly fulfilled my previous idea . OKX:TONUSDT is dipping into the support zone after a sharp breakdown from the compression structure, retesting the lower boundary of the descending channel. 4H chart shows price interacting with both the long-term support line and the short-term descending trendline, creating a confluence area for a potential rebound. A sustained hold above 1.85 opens the path for a corrective rally toward the 2.00 psychological mark as buyers step in from the reaction zone. Overall, the structure favors a short-term bullish bounce as long as the support base remains intact.
⚠️ Risks:
A clean H1/H4 close below 1.86 would invalidate the rebound setup and expose 1.79.
Weak market sentiment across majors could limit the strength of the corrective move.
Failure to break above the descending trendline may trap price in extended consolidation.
If this idea resonates with you or you have your own opinion, traders, hit the comments. I’m excited to read your thoughts!

11/13 XAUUSD: How should you trade after the surge?Fundamental Analysis:
The U.S. government has officially ended its shutdown today. The passage of the funding bill will ensure continuous appropriations, providing operational funding for most federal agencies through January 30, 2026.
Following the announcement, White House Press Secretary Levitt stated that due to the earlier government shutdown, it is unlikely that the October Non-Farm Payrolls (NFP) and CPI data will be released as scheduled.
With the market eagerly awaiting data-driven guidance, this unexpected development has instead intensified risk aversion, triggering another sharp rally in gold prices.
Technical Analysis:
On the 4-hour chart, gold prices have reached the 0.618 Fibonacci extension level of the current uptrend, where they are now encountering resistance.
At this stage, chasing the rally carries a potential pullback risk. Therefore, any further bullish positioning should ideally be considered after a corrective retracement.
Support and Resistance:
Support: $2,180 — today’s intraday low and the 0.382 Fibonacci retracement level.
Resistance: $2,240–$2,250 — today’s intraday high and the 0.618 Fibonacci extension level.
Trading Strategy:
Primary bias: Buy on dips; short at highs as a secondary approach.
Entry (Long): Consider buying near $2,180, provided the level holds and is not breached.
Entry (Short): If gold rallies into the $2,240–$2,250 zone and fails to break above, consider short positions from that area.
EURUSD BUY OPPORTUNITY SWING TRADERS 30min There is a clear trend break and retest on 30min timeframe. Waiting for price to retest the support level and hit off 10 20 EMA. Targeting 1.17100. 4hr timeframe EMA's are also on uptrend. Potentially big rr trade....

Lingrid | EURUSD Failed Monthly Break Bullish OpportunityFX:EURUSD is rebounding from the psychological 1.15 support area after a fake breakdown of the October low. The structure shows a potential reversal forming through an upward correction inside the short-term rising channel. If the pair holds above 1.1530, buyers could attempt to push toward 1.1620 resistance. Overall momentum suggests a short-term bullish bias before the broader downtrend resumes.
⚠️ Risks:
A sudden USD rally driven by stronger U.S. CPI could pressure the pair lower.
ECB policymakers’ dovish tone may limit euro upside.
Failure to sustain above 1.1520 would invalidate the recovery scenario.
If this idea resonates with you or you have your own opinion, traders, hit the comments. I’m excited to read your thoughts!

Lingrid | GBPJPY Bullish Continuation Following Upside BreakoutFX:GBPJPY is consolidating near its mid-range level after a strong rebound from 200.65 support. The structure has shifted into an ascending channel with a clear series of higher lows confirming buyer control. A breakout above 203.50 could open the way toward 204.50, where major resistance aligns with the previous high zone. The bullish sequence remains intact as long as the 202.50 level holds, hinting at further momentum toward the resistance zone.
⚠️ Risks:
Rejection from the upper channel boundary could trigger a pullback toward 202.00.
Stronger JPY demand due to risk-off sentiment may cap short-term gains.
A break below 200.65 would invalidate the bullish outlook and signal deeper correction potential.
If this idea resonates with you or you have your own opinion, traders, hit the comments. I’m excited to read your thoughts!

Silver Breaks All Levels – New ATH Coming Soon?1. What Happened This Week
Even more aggressive than Gold, Silver delivered an explosive rally, completely blowing past my “normal” target at the 50.50 zone. The move has been vertical, with the metal rising over 10% in just three days — an extremely rare occurrence for a major precious metal.
2. Current Market Context
At the time of writing, Silver is trading directly inside the old all-time-high zone above 54, and the probability of a new ATH being printed soon is very high.
However, as with Gold, trading this kind of momentum with leverage becomes almost impossible. Moves are too fast, volatility is too extreme, and normal risk management gets distorted.
3. Technical Outlook
Technically, Silver is sitting inside major resistance and is clearly overstretched.
But overstretched does not mean it cannot go another 2,000 pips higher before any meaningful correction — the current flow is too strong to underestimate.
Key support levels on the way down:
- 50.50 – first important structural support
- 49.50 – deeper but still valid support
4. Trading Plan
At this point:
- Shorting is pure gambling.
- Buying is also risky — entries are too high and volatility too elevated.
Therefore, the smart trade is to stay patient and simply observe, waiting for a cleaner structure and better levels before participating again.
5. Conclusion
Silver is in a powerful breakout phase, trading inside ATH territory with strong momentum. The trend is bullish, but conditions are extreme, and the best approach now is to stay on the sidelines until the market offers a safer opportunity. ⚡️

Lingrid | USDCHF Bearish Extension Expected Sell SignalFX:USDCHF is pulling back from the previous higher high and retesting the broken structure from above, signaling fading bullish momentum. The chart shows price sliding back toward the upward trendline while forming a lower-timeframe corrective structure under the 0.8000 zone. A clean rejection from 0.8000 could trigger the expected bearish extension toward the 0.7940 support. Overall, structure points to a sell bias as long as price remains below the resistance block.
⚠️ Risks:
A breakout and H4 close above 0.8000 would invalidate the bearish setup.
Strong USD flows from upcoming US data may fuel a bullish recovery.
A bounce from the trendline could shift bias back to consolidation instead of continuation lower.
If this idea resonates with you or you have your own opinion, traders, hit the comments. I’m excited to read your thoughts!

Lingrid | SOLUSDT Buying Opportunity at Psychological LevelThe price perfectly fulfilled my previous idea . BINANCE:SOLUSDT CRYPTOCAP:SOL is testing the lower boundary of market structure after multiple failed attempts to break the descending trendline. Price action shows a clear compression phase above the psychological $150 support, indicating potential accumulation. A bullish breakout above $160 and trendline could open a short-term recovery toward the $175 resistance zone. Overall, momentum hints at a buy bias from a key psychological and structural level.
⚠️ Risks:
Rejection from $160 may lead to a retest of $147 support.
Bitcoin weakness could suppress recovery momentum.
Stronger USD or risk-off sentiment may delay a breakout.
If this idea resonates with you or you have your own opinion, traders, hit the comments. I’m excited to read your thoughts!

Gold Hits 4150 Resistance: Healthy Correction or Reversal?1. What Happened in the Last 24 Hours
Gold delivered an impressive bullish surge of over 1000 pips, reaching the 4150 resistance zone — precisely the level mentioned in yesterday’s analysis. The move was nearly one-directional, with only a brief intraday retracement after crossing above 4100.
2. Market Context
Such a strong advance often leads to short-term exhaustion, and that’s exactly what we’re seeing now. After touching the 4150 resistance, the price has started to pull back, which appears to be a normal correction rather than a trend reversal.
3. Technical Outlook
The first key support for bulls lies near 4075, followed by the 4050 zone, which is now an important structural level. As long as these supports remain intact, the uptrend remains healthy and the probability of another bullish leg is high.
4. Trading Plan
I remain bullish on Gold and plan to buy dips toward 4075–4050 zones. A sustained hold above these levels could open the way for a retest of 4200 resistance in the next sessions.
If the price falls below 4050 with strong momentum, I’ll reassess the bias — but for now, the path of least resistance is still up.
5. Conclusion
Yesterday’s explosive rally confirmed the bullish structure, and today’s pullback looks like a healthy correction within an ongoing trend. As long as 4050–4075 holds, buying dips remains the smart play. 🚀

Gold Momentum Extreme – Shorting Is High-Risk Despite Resistance1. What Happened Yesterday
Despite a weak start to the day that looked like the beginning of a deeper correction after Monday’s strong rally, Gold once again defended the 4100 interim support. Bulls quickly stepped in, and the market delivered yet another 1,000-pip bullish session — a pattern Gold has normalized these days.
2. Current Market Context
At the time of writing, price is hovering around the 4200 resistance zone, and the upside momentum remains extremely strong. Yes, after a 2,000-pip rise in just three days, a correction seems not only possible but probable.
However, we must also remember that last month Gold rallied 4,000 pips in a single week without any meaningful pullback — making short-term timing very tricky.
3. Technical Outlook
Key support levels to watch:
- 4150 – first intraday support
- 4100 – strong structural level
- 4050 – major swing support and line in the sand for bulls
Resistance levels:
- 4200 – current zone being tested
- 4280 – next clear target
- 4400 – all-time-high resistance
The structure remains bullish, but stretched.
4. Trading Plan
For swing traders, this is a difficult location to initiate new positions in either direction.
I personally prefer to buy only if Gold pulls back under 4100, where the risk-reward becomes more reasonable.
As for short trades, the combination of strong momentum and last month’s parabolic behavior makes them very high risk, even in strong resistance.
5. Conclusion
Gold remains in a powerful uptrend, and although a correction is likely, timing it is extremely challenging. Until we see a deeper pullback, I remain patient and only consider buys from lower support zones, preferably below 4100. 🚀
