Hellena | GOLD (4H): LONG to 61.8% Fibo of 4265.Dear colleagues, in the new forecast the idea remains the same - the upward momentum (12345) is not yet complete.
At the moment I see the end of the formation of the corrective wave “4” at the level of 4000, as stated earlier, and the beginning of the upward movement in wave “5”.
I do not want to set distant targets, because their achievement may take time, so let's start small - the nearest target is the resistance area at 4265 - the area beyond the 61.8% level of wave “4”. I think that this is the nearest target that we should expect.
Fundamental context
Earlier this week, gold experienced a sharp pull-back after its recent record highs. Nothing to panic about — it’s simply a technical correction: investors are taking profits after a rapid and extended rally. Key drivers like central bank buying and lower rate expectations remain intact, so the broader bullish story is still alive. In fact, this brief dip may offer a better entry point before the next leg up.
Manage your capital correctly and competently! Only enter trades based on reliable patterns!
Signalservice

XAUUSD: 800 Pips Secured, but Is the Correction Really Over?Yesterday, after revisiting the 4,000 support zone as expected and explained in my previous analysis, Gold bounced strongly and tested the area above 4,100.
That rally delivered around 800 pips profit on my long trade, and now the market is showing a mild pullback, consolidating around 4,085.
The key question now:
👉 Is the overall correction over, or is there still more to unfold?
From a technical perspective, as long as 4,000 remains intact, Gold retains its bullish potential toward the 4,200 resistance zone.
However, I prefer to stay patient at the moment — being flat at the time of writing — and will wait for a potential dip toward 4,050 or slightly below.
If the price shows a positive reaction in that area, I’ll consider re-entering long positions.
🎯 Upside targets:
• First: 4,150
• Second: 4,200
Keeping a positive risk-reward balance remains the main priority.
🚀 Let’s see if the market confirms the plan.

Lingrid | GBPJPY False Channel Break Bearish SignThe price perfectly fulfilled my previous idea . FX:GBPJPY faded from the 202.6–203.0 supply, slipping back beneath the red downtrend and eyeing the mid-range support at 201.45. Structurally, price printed a lower high at the trendline, then failed a breakout from the rising trendline, keeping it inside the broader descending channel. If 202.6/203.0 isn’t reclaimed, I expect continuation toward 201.45 and potentially 200.63; a clean reclaim above 203.0 would invalidate and re-open 204.5. Broader momentum still shows lower highs within a down-channel, and the recent false break reinforces the sell-side control until higher-timeframe support changes that.
⚠️ Risks:
A sudden risk-on shift or yen weakness from BOJ headlines could fuel a squeeze back above 203.0.
UK/JP data surprises or central bank commentary may whipsaw price around the trendline.
A sharp drop in US yields could undermine JPY strength and negate the bearish setup.
If this idea resonates with you or you have your own opinion, traders, hit the comments. I’m excited to read your thoughts!

Lingrid | AVAXUSDT Pullback Sell Downside ExtensionBINANCE:AVAXUSDT is showing rejection from the confluence of the downward trendline and the $20 psychological zone, confirming sellers' control in the short term. The structure remains within a bearish channel with a lower-high formation maintaining downside pressure. Price may retest $20 before extending losses toward $17.5 if momentum weakens further. This retracement aligns with the broader descending structure visible since mid-October, keeping bias bearish for now.
⚠️ Risks:
Break above $20.5 could invalidate the current bearish setup.
Strong BTC recovery may support short-term upside correction.
Lower volatility could delay breakdown confirmation below $18.
If this idea resonates with you or you have your own opinion, traders, hit the comments. I’m excited to read your thoughts!

Hellena | GOLD (4H): SHORT to support area of 4040.Gold is actively rising and I believe that before the impulse ends we should see the correction that many are expecting.
As of today, I see the completion of the higher order wave “3” and the approaching start of the correction in wave “4”. It makes no sense to put any distant plans in the correction and I think that the support area of 4040 looks quite attractive.
Fundamental context
Gold continues its rally and recently broke new highs, fueled by expectations of U.S. rate cuts, global uncertainty, and safe-haven demand. Central banks are still actively increasing their gold reserves — this structural demand adds support even if price pullbacks occur.
Supply growth is modest — mining output is constrained, and recycling of gold is not enough, which limits the downward pressure on prices.
Given this backdrop, the chance of a correction rises as momentum stretches — but the underlying fundamentals remain favorable for further upside once the correction completes.
Manage your capital correctly and competently! Only enter trades based on reliable patterns!

Gold – 24 Hours of Chaos: From 4400 to 4000The last 24 hours in Gold trading were absolutely insane. After retesting the 4400 zone all-time high last night, XAUUSD literally collapsed, dropping straight to the 4000 zone in just one day — a 10% move that’s unheard of for gold (at least I haven't seen).
1️⃣ Technical Picture
Once the price broke back below 4200, it confirmed a double top formation, and the selloff accelerated dramatically toward its measured target around 4000 — a level also supported by the ascending trendline that started in late August.
2️⃣ Current Context
At the time of writing, gold already rebounded nearly 1300 pips from the low, which means there’s no attractive level to enter long right now, even though the recovery might continue in the short term.
3️⃣ Key Levels to Watch
• Resistance: 4200 zone – now turned into a major resistance. If the price revisits this level, I’ll be looking for short setups, ideally on intraday spikes.
• Support: 4000 zone – if the price dips again before testing resistance, it could offer long opportunities from this confluence area.
4️⃣ Trading Plan
In short, we’re in a wide range between 4000 and 4200, both levels offering potential trades but in opposite directions. For now, I’ll stay patient and wait for price to get closer to one of these extremes before taking action.
⚠️ Final Note
Volatility is off the charts, so if you decide to trade XAUUSD these days, adjust your stop losses and targets accordingly. This is not the time for tight stops, is time for patience, and flexibility. 🚀

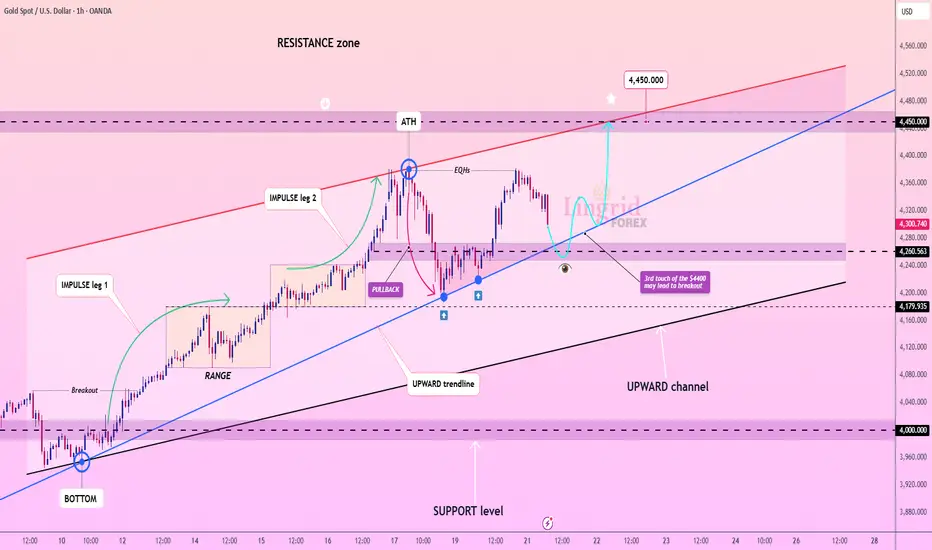
Lingrid | GOLD Trend Continuation Pattern FormingOANDA:XAUUSD is maintaining its bullish structure within an upward channel, where the price continues to create impulsive legs followed by controlled pullbacks. The third touch of the $4,380 resistance area suggests an increasing probability of a breakout continuation toward $4,450. As long as the $4,250–$4,270 support region holds, buyers remain in control of the broader trend. Momentum remains constructive, supported by higher lows and consistent rebounds from the trendline base.
⚠️ Risks:
Failure to hold $4,240 could invalidate the bullish setup.
Strong CPI data may cap gold’s upside.
A sudden drop in inflation expectations could weaken safe-haven demand.
If this idea resonates with you or you have your own opinion, traders, hit the comments. I’m excited to read your thoughts!
Lingrid | USDCAD Contraction Leading to Bullish BreakoutFX:USDCAD continues to respect its upward channel, consolidating after multiple tests of the ascending trendline that define the current bullish structure. The confluence near 1.4036 aligns with dynamic support, suggesting buyers may soon attempt another push toward the 1.4100 resistance. A sustained move above this level could extend momentum toward the upper boundary of the channel. The overall compression phase indicates market preparation for a breakout continuation.
⚠️ Risks:
A breakdown below 1.4030 may invalidate the bullish scenario.
Strong CPI data or oil price rally could pressure USD and reverse gains.
Broader risk sentiment shifts may limit upside potential.
If this idea resonates with you or you have your own opinion, traders, hit the comments. I’m excited to read your thoughts!

Lingrid | LINKUSDT Bearish Continuation Short OpportunityBINANCE:LINKUSDT has been moving inside a well-defined downward channel, consistently forming lower highs and lower lows in line with bearish structure. The recent rejection from the downward trendline confirms continued pressure from sellers near $18.50 resistance. Unless price breaks and sustains above this area, the broader momentum favors a move toward the $15.00 support level. Current structure implies that each rally attempt remains corrective within a larger downtrend.
⚠️ Risks:
A sudden BTC recovery could invalidate the bearish setup.
Failure to hold below $18.50 may trigger a short squeeze.
Softer macro sentiment or lower volatility could delay breakdown momentum.
If this idea resonates with you or you have your own opinion, traders, hit the comments. I’m excited to read your thoughts!

Hellena | Oil (4H): SHORT to support area of 54.00.As I continued to watch oil I realized that the structure I built in the last forecast is still in place. I think we should expect a correction in wave “4” to the 59.3 area, then a continuation of the downward movement at least to the 54.00 support area. This will be the completion of the downward impulse.
I do not exclude the probability of lengthening of wave “3” and in this case there will be no correction and the price will immediately reach the target.
Fundamental context
The oil market remains under pressure as supply continues to outpace demand, raising the risk of a surplus. Forecasts for 2025-2026 indicate higher production growth while consumption slows.
Rising inventories and a shift in the futures curve into contango suggest growing storage levels and weaker near-term demand.
Under these conditions, downside pressure persists, keeping the probability of a further decline high.
Manage your capital correctly and competently! Only enter trades based on reliable patterns!

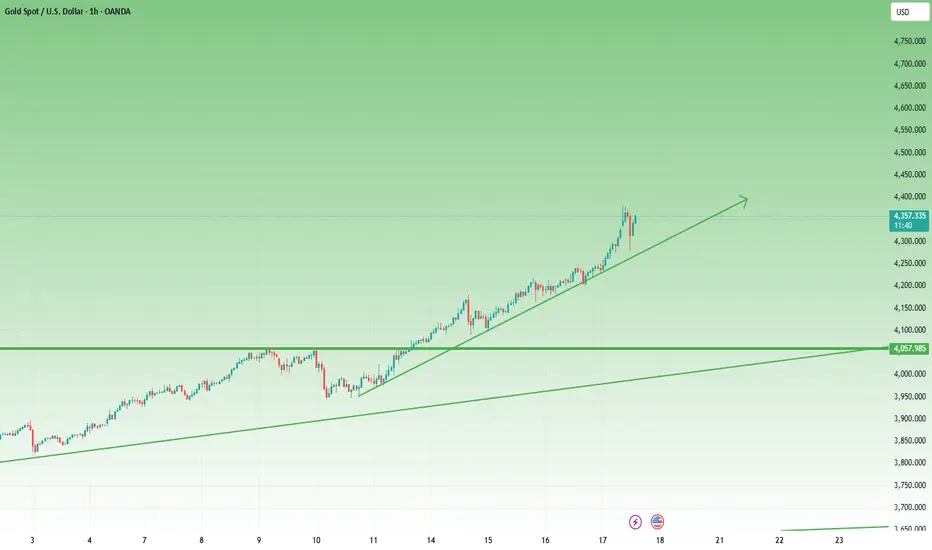
Gold Analysis – Volatility Rules the GameYesterday marked another strong bullish session for Gold, as the price completely erased Friday’s losses, confirming that buyers are far from done. Regardless of how high the market has already climbed, momentum remains firmly on the bullish side.
Technically, Gold managed to reclaim and break above the 4285–4300 resistance zone, which triggered a sharp acceleration toward the recent all-time high around 4380.
At the time of writing, the market is undergoing a normal retracement, which is a healthy technical reaction after such an aggressive move. The 4300 area has now turned into key short-term support, and as long as bulls defend this level, the probability of a new ATH remains high.
From a trading perspective, however, volatility has reached extreme levels. This type of price action often favors large players with fundamental reasons rather than discretionary traders. For that reason, I prefer to stay on the sidelines today, waiting for volatility to stabilize before engaging again.

Lingrid | GOLD Weekly Analysis: Pullback From Record HighsThe price perfectly fulfilled my previous weekly idea . OANDA:XAUUSD market continues to navigate through considerable volatility as it pulls back from the recent spike that tested zone below the $4,400 resistance zone. After achieving a new all-time high, the metal is now experiencing natural selling pressure and technical correction, bringing some gravitational force into the equation. Despite this near-term weakness, the underlying trend structure remains constructively bullish, suggesting any substantial decline could present attractive entry opportunities for those seeking value.
The technical landscape reveals gold trading within a well-defined upward channel that has guided the rally since late September. The recent rejection from resistance has brought price action back toward the mid-channel area around $4,200, which aligns with the previous Monday high below and represents a crucial inflection, optimal entry point. The triangle pattern that formed during the consolidation phase earlier in the trend provided the springboard for the explosive breakout, and now the market may repeat this pattern, creating continuation formation.
The key support zone sits at $4,130-$4,135, and holding above this level would keep the bullish structure intact for another potential test of $4,400 and beyond toward the $4,500 projection zone. However, failure to hold could trigger deeper correction toward the lower channel boundary near $4,000 or even the stronger support at $3,730-$3,780, which would actually offer more compelling risk-reward for strategic accumulation. The coming week will clarify whether this represents healthy digestion or something more corrective in nature.
If this idea resonates with you or you have your own opinion, traders, hit the comments. I’m excited to read your thoughts!

Lingrid | EURUSD Round Number Resistance Short SetupFX:EURUSD faded from a lower high at the channel border and slipped back beneath the 1.1700 pivot inside the highlighted range. Structure shows a descending sequence within a broader downward channel, with the recent squeeze stalling just under the 1.1700 mark. While price holds below 1.1700, continuation toward 1.16175 and potentially 1.1600 is favored. Bearish momentum prevails with lower highs and repeated rejections from trend resistance.
⚠️ Risks:
A sustained reclaim and 4H close above 1.1700 would invalidate the bearish view.
US data/ECB headlines could spark volatility and squeeze price higher.
A DXY pullback or broad risk-on bid could buoy FX:EURUSD toward 1.1780.
If this idea resonates with you or you have your own opinion, traders, hit the comments. I’m excited to read your thoughts!

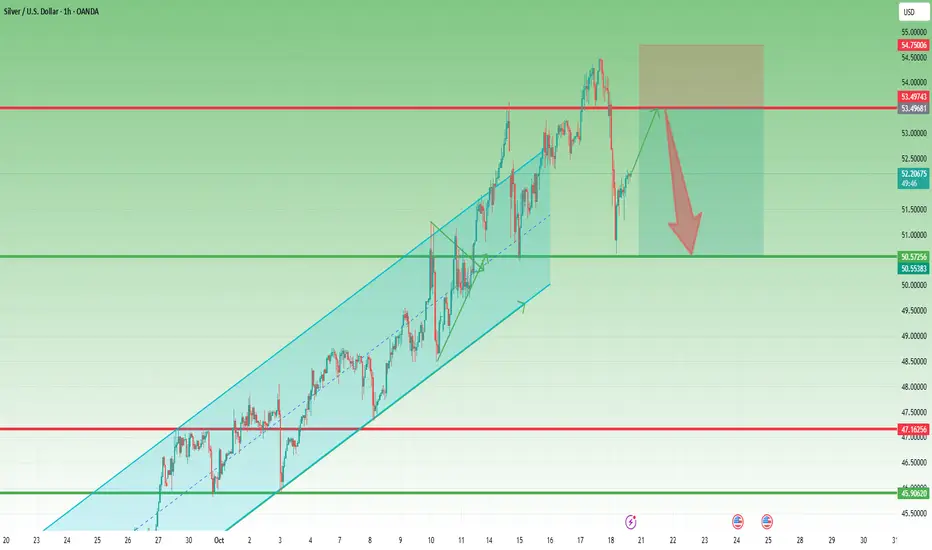
Silver: After New All-Time Highs, a Sharp CorrectionLast week, Silver reached a new all-time high, almost touching my $55 target.
However, on Friday, the market delivered a powerful sell-off, with the price dropping by around 4,000 pips — from the $54.50 ATH down to the $50.50 support zone.
At this stage, I expect the price to stabilize and form a temporary base of consolidation.
My focus now shifts to the $53.50 resistance zone, which could act as a short-term decision point.
If I observe signs of weakness or rejection in that area, I’ll consider short positions, targeting a potential retest of the $50 support zone.
4,000 Pips Up, 2,000 Down – Gold’s Wild Ride Continues!Last week has been a wild ride for Gold traders, with the price rallying aprox 4,000 pips (around 10%), only to sell off 2,000 pips on Friday in what many expected to be a well-deserved correction.
The big question now is: was that correction enough, or is Gold preparing for another leg down before continuing higher?
In my view, this was just the first leg of the correction, and I expect another wave of selling to come this week.
Currently, Gold is recovering from Friday’s sharp drop, and this rebound could potentially push prices back above 4,300.
If that happens, I’ll be watching closely for signs of weakness to position myself short.
Overall, I believe a new test of the 4,200 area is likely before any sustainable recovery can take place.

When Everyone’s Buying, I’m Watching for the TopAs we’ve grown used to by now, Gold sets a new ATH almost every day — and by the time we, in Europe, wake up, it’s already 300–400 pips higher.
Yet despite the strong bullish momentum, speculative trading remains extremely difficult. Sudden drops of hundreds of pips can easily hit your stop loss if your entry timing isn’t perfect.
From my perspective — even though I don’t have an open position — the idea remains the same: a correction is inevitable.
Since Friday’s low, the price has rallied around 3,000 pips — a fabulous move, but like any late-stage rally, it’s becoming excessive and irrational (even more than it already was).
Of course, it can always go higher, but the more it exaggerates, the faster it tends to normalize.
As I mentioned before, my approach remains focused on identifying potential tops — and while that’s the riskiest thing a trader can do, it has worked quite well during the sharp downward spikes of the last two weeks.
Technically, the move from Friday’s low is forming a rising wedge, with resistance around 4270, which is where I’ll be looking to sell.
The target zone is roughly 1,000 pips lower.
One encouraging factor — even more so than before — is the noticeable narrowing of the spread between futures and spot, now at just 0.2–0.25%, compared to the usual ~1% (and sometimes higher) during strong bullish phases.

Lingrid | GOLD Consolidation - Breakout - Momentum TradeThe price perfectly fulfilled my previous idea . OANDA:XAUUSD recently made new all-time high inside a steep upward channel, maintaining strong bullish momentum. The structure suggests a healthy correction phase forming a short-term range above the 4,280 support zone. As long as the price remains above the upward trendline, the bullish structure remains intact with potential continuation toward 4,450 and higher. The ongoing range formation may serve as consolidation before the next impulsive breakout higher.
⚠️ Risks:
A sustained break below 4,280 could trigger a deeper correction.
Rising U.S. yields or hawkish Fed comments may weigh on gold prices.
Reduced geopolitical tension could cool safe-haven demand.
If this idea resonates with you or you have your own opinion, traders, hit the comments. I’m excited to read your thoughts!

Lingrid | EURAUD Failed Break Resistance Fade TradeThe price perfectly fulfilled my previous idea . FX:EURAUD surged strongly after rebounding from the double-bottom setup, completing an A-B-C bullish correction into the resistance area near 1.820. The structure now shows signs of exhaustion after a fake breakout above the psychological level, suggesting a potential short setup. Price remains within an upward channel but has started to lose momentum near the upper boundary. A failure to sustain above 1.8200 could confirm a pullback toward the 1.800 support zone.
⚠️ Risks:
A break and close above 1.820 could invalidate the short setup.
Unexpected AUD weakness from macro data could trigger renewed buying.
Broader risk-on sentiment may support continued bullish pressure.
If this idea resonates with you or you have your own opinion, traders, hit the comments. I’m excited to read your thoughts!

Lingrid | TONUSDT Bearish Formation Short OpportunityOKX:TONUSDT price faced resistance within the descending triangle pattern and rejected near the downward trendline, signaling continuation of its bearish structure. The pair is now hovering just above the 2.10 level, testing the lower range boundary inside the upward channel. A confirmed break below 2.10 could open the way toward 2.00 psychological support as sellers regain control. The overall pattern indicates persistent pressure with a potential retest of deeper support before any sustained recovery attempt.
⚠️ Risks:
A bullish reversal in BTC or broader crypto sentiment could invalidate the bearish setup.
Failure to break below 2.10 may trigger a temporary short squeeze.
Positive macro or regulatory news could shift momentum upward prematurely.
If this idea resonates with you or you have your own opinion, traders, hit the comments. I’m excited to read your thoughts!

Hellena | Oil (4H): SHORT to support area of 56-57.Colleagues, price is actively moving in a downward direction and I believe the move is not yet complete.
Earlier I saw this move as a big correction, but now the structure is more of an impulsive one. This means that the price is moving in the wave “3” of the higher order (Red), which should be completed soon.
For this to happen, the price needs to complete the correction in the wave “4” of medium order and then update the low, reaching the support area of 56-57.
The extension of wave “3” is possible - then the price will reach the target without correction.
Fundamental context
Global oil inventories are forecast to rise through 2025, putting downward pressure on prices despite efforts by some producers to restrain output.
OPEC+ has been increasing production again, which adds to the supply burden.
Meanwhile, demand forecasts have been trimmed amid softer economic growth indicators in key consuming regions.
Major banks have lowered long-term price expectations for crude — the balance is tilting toward a more bearish outlook.
Manage your capital correctly and competently! Only enter trades based on reliable patterns!

Gold – Madness in MotionGold rose this week — so far (and I really want to stress so far ) — by around 10%. That’s massive by any standard.
On Monday, I tried to catch a dip and missed it. Since Tuesday, I’ve been on the sell side — completely wrong on direction , yet somehow still managed to finish positive overall.
Yesterday my stop got hit, but after what happened overnight, it turned out to be just a scratch. With this kind of volatility, a recovery of 250pips can happen in ten minutes.
Looking at the chart — it’s bullish, no question. Should it be bought? Hmmmm...
Looking at the volatility… for me, it’s become untradeable.
Can it keep going higher? Of course.
How high? Nobody knows.
At this point, any prediction is just throwing numbers in the air.
Trading corrections, as I’ve tried to do, is a guessing game. I’ve had some luck so far, but after yesterday's stop loss, I’m stepping aside.
My take: stay out. Let others make money if they can.
A 1,000-pip rise and an equal reversal — all while I was asleep (and trust me, I sleep very little) — is too crazy. Stops can be wiped for bulls just as easily as for bears.
At some point, it will settle down and define its levels.
Until then — it’s not for me anymore.
Doge- Support turned resistance. What's next?Friday’s crash took DOGE below two key support zones —
first, the ascending trendline around 0.23,
and then the horizontal support near 0.21.
After the drop, DOGE attempted a recovery that only brought it back to retest the broken 0.21 level, which has now turned into resistance. The price has since started to roll back down.
At this stage, if the negative sentiment across the crypto market continues, the probability of a deeper correction remains high — with the next significant target around 0.15.
Only a sustained move above 0.21 would neutralize this bearish scenario and open the path for a potential rebound.

Bitcoin Under Pressure: 108-110k Zone Support Now CriticalI’m struggling to maintain my bullishness lately — not because of Friday’s crash, but because, regardless of what timeframe I analyze, I just can’t find a convincing bullish bias anymore.
On the weekly chart, the structure looks increasingly fragile. After breaking above the 108k zone in mid-summer, Bitcoin pushed to a new ATH around 125k, then pulled back to retest the broken resistance. That was fine — a normal retest within a healthy uptrend. But what followed wasn’t.
The price made a new, but very anemic all-time high, showing a clear lack of momentum, and then dropped again to the same support area. Even if this drop was provoked, the fact that BTC returned so quickly to that zone makes me question the strength of any potential reversal.
From a technical standpoint, if we ignore the reasons and look only at the chart, the last 3.5 months resemble more of a distribution phase rather than a solid consolidation before another leg up.
If Bitcoin breaks below the 108k support, the next logical target sits around 100k. But considering the long-term structure I’ve shown on the weekly chart, I wouldn’t be surprised to see a deeper correction toward 90k.
The bulls are still in the game, but they’re losing ground — and unless BTC shows strength soon, the market might be preparing for another leg down before any sustainable recovery
