Bitcoin Under Pressure: 108-110k Zone Support Now CriticalI’m struggling to maintain my bullishness lately — not because of Friday’s crash, but because, regardless of what timeframe I analyze, I just can’t find a convincing bullish bias anymore.
On the weekly chart, the structure looks increasingly fragile. After breaking above the 108k zone in mid-summer, Bitcoin pushed to a new ATH around 125k, then pulled back to retest the broken resistance. That was fine — a normal retest within a healthy uptrend. But what followed wasn’t.
The price made a new, but very anemic all-time high, showing a clear lack of momentum, and then dropped again to the same support area. Even if this drop was provoked, the fact that BTC returned so quickly to that zone makes me question the strength of any potential reversal.
From a technical standpoint, if we ignore the reasons and look only at the chart, the last 3.5 months resemble more of a distribution phase rather than a solid consolidation before another leg up.
If Bitcoin breaks below the 108k support, the next logical target sits around 100k. But considering the long-term structure I’ve shown on the weekly chart, I wouldn’t be surprised to see a deeper correction toward 90k.
The bulls are still in the game, but they’re losing ground — and unless BTC shows strength soon, the market might be preparing for another leg down before any sustainable recovery
Signalservice

Lingrid | GOLD Channel Breakout Bullish Extension ActiveThe price perfectly fulfilled my previous idea . OANDA:XAUUSD continues its bullish structure within the ascending channel, forming a new A-B-C movement after a clean breakout above the compression zone. Price is consolidating just above the previous breakout level near 4200, setting a potential base for the next impulsive leg higher. A sustained move above 4200 could trigger a push toward 4290, marking a retest of the resistance zone. Momentum remains strong, supported by higher highs and channel integrity, suggesting continuation of the broader uptrend.
⚠️ Risks:
Failure to hold above 4100 may trigger a deeper retest toward 4060.
Strong USD recovery or hawkish Fed remarks could pressure gold prices.
A sudden shift in global risk sentiment could limit bullish continuation.
If this idea resonates with you or you have your own opinion, traders, hit the comments. I’m excited to read your thoughts!

Lingrid | GBPCAD Triple Top Break Bull AccelerationThe price perfectly fulfilled my previous idea . FX:GBPCAD reclaimed the uptrend after a fake break, bouncing from a higher low at the channel base and rotating back above the 1.8765 swap zone. Price structure shows an upward channel with a rising trendline, plus a recent range and triple-high cluster that marks overhead supply. If 1.8765/1.8720 holds, bulls can press toward 1.8950 and the broader resistance area. Momentum remains constructive with higher lows and trend-continuation behavior.
⚠️ Risks:
A daily close back below the uptrend line or 1.8765 would reopen a drift toward 1.8485 support.
CAD strength from oil rallies or BOC Gov Macklem commentary could cap upside.
High-impact U.K. data surprises may trigger volatility against the setup.
If this idea resonates with you or you have your own opinion, traders, hit the comments. I’m excited to read your thoughts!

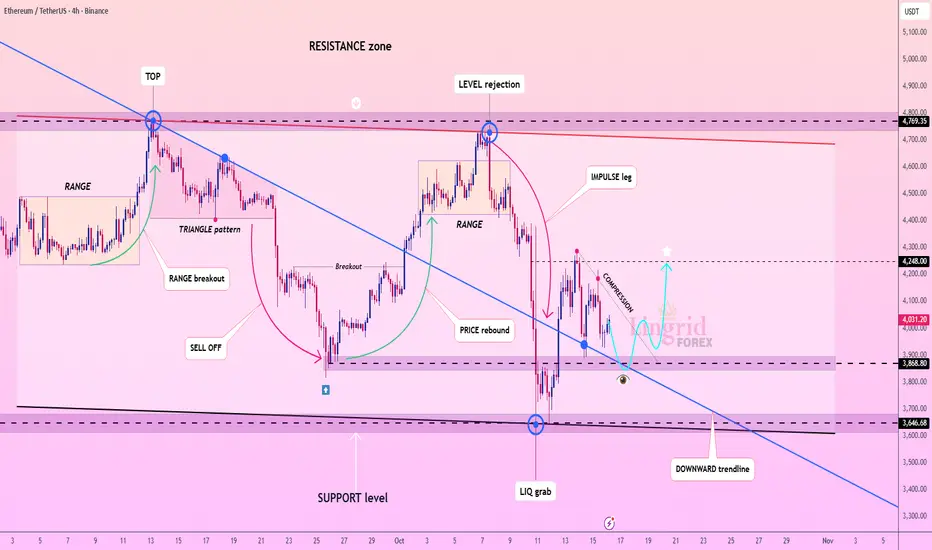
Lingrid | ETHUSDT Squeeze Pattern Breakout ExpectedThe price perfectly fulfilled my previous idea . BINANCE:ETHUSDT rebounded sharply from the liquidity grab near 3500, signaling the defense of the major support level after a deep sell-off. The structure now shows compression just below the downward trendline, hinting at a potential bullish breakout setup. If price sustains above 3900, it could trigger an impulsive rally toward 4250. Momentum remains constructive, and the recovery phase suggests a possible reversal if buyers maintain control.
⚠️ Risks:
Failure to clear the downward trendline may extend the consolidation.
Renewed BTC weakness could cap ETH’s recovery potential.
Unexpected macro data or regulatory developments could pressure the broader crypto market.
If this idea resonates with you or you have your own opinion, traders, hit the comments. I’m excited to read your thoughts!
Lingrid | AUDCAD Key Swap Level Shorting OpportunityFX:AUDCAD recovered from its double-bottom formation near 0.9063, pushing back into the swap zone around 0.9160 after breaking the short-term resistance. The structure reveals a retest of the upward trendline under a descending resistance channel, suggesting a possible corrective pullback before resuming downside pressure. If price fails to sustain above 0.9160, a decline toward 0.9111 or lower remains likely. Market structure favors a bearish continuation as long as the pair trades below the descending red trendline.
⚠️ Risks:
A sustained breakout above 0.9160 could invalidate the bearish outlook.
Stronger Australian employment or CPI data may fuel short-term upside volatility.
Broad CAD weakness tied to oil price drops could trigger unexpected rallies .
If this idea resonates with you or you have your own opinion, traders, hit the comments. I’m excited to read your thoughts!

Lingrid | SOLUSDT Consolidation Break Expansion SetupBINANCE:SOLUSDT rebounded sharply from the $170 support after a flash crash and is now consolidating near the $200 level within a mid-range structure. The chart shows a sequence of impulse and correction leg price action patterns, with buyers attempting to establish momentum. A stable close above $10 may confirm renewed bullish activity toward the $230 resistance zone. The overall structure suggests range accumulation, with a potential upward breakout forming if momentum persists.
⚠️ Risks:
Failure to hold above $190 could lead to renewed selling pressure.
Broader crypto market weakness may cap any upside recovery.
A stronger dollar or macro risk-off sentiment could stall bullish continuation.
If this idea resonates with you or you have your own opinion, traders, hit the comments. I’m excited to read your thoughts!

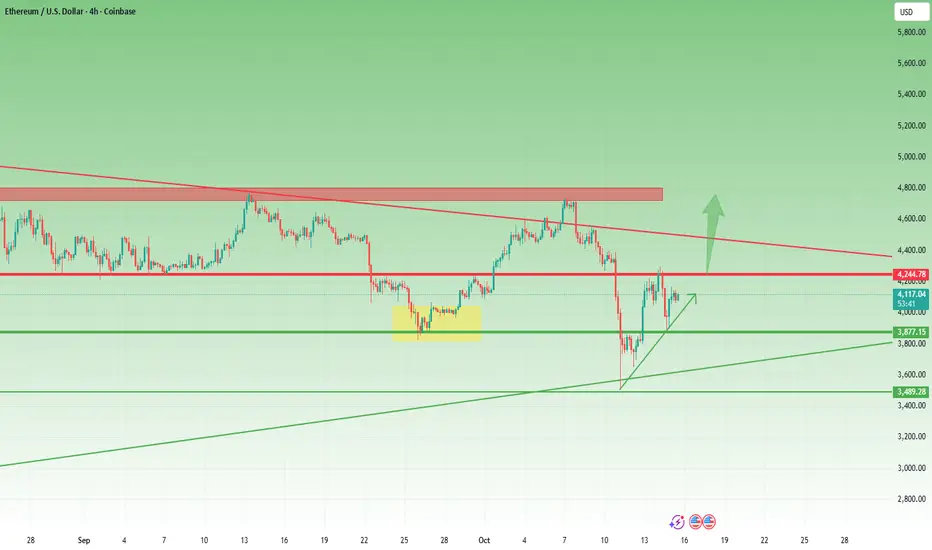
ETH: Technical Precision Amid the CrashIn spite of the crypto market crash, Ethereum actually moved very technically.
The break below the $4,300 support led to a drop toward the important $3,500 zone.
Although the price also broke below $3,850, a quick reversal followed — the rebound brought the price back above the $3,850 support and up to the $4,300 resistance.
A new wave of selling came next, but this time, the price stopped around the $3,850 support zone, confirming it as an important level.
A quick rebound followed, and now ETH is back above $4,000, trading around $4,100.
Also very important — the price of ETH is forming an ascending triangle, with resistance at $4,300.
A break above $4,300 will most likely accelerate gains toward the $4,900–$5,000 area, which is both a technical resistance and the target of the triangle.
I’m looking to buy on dips, preferably below $4,000, and considering the mentioned target, such a setup offers around a 1:3 or even 1:4 risk-reward ratio.
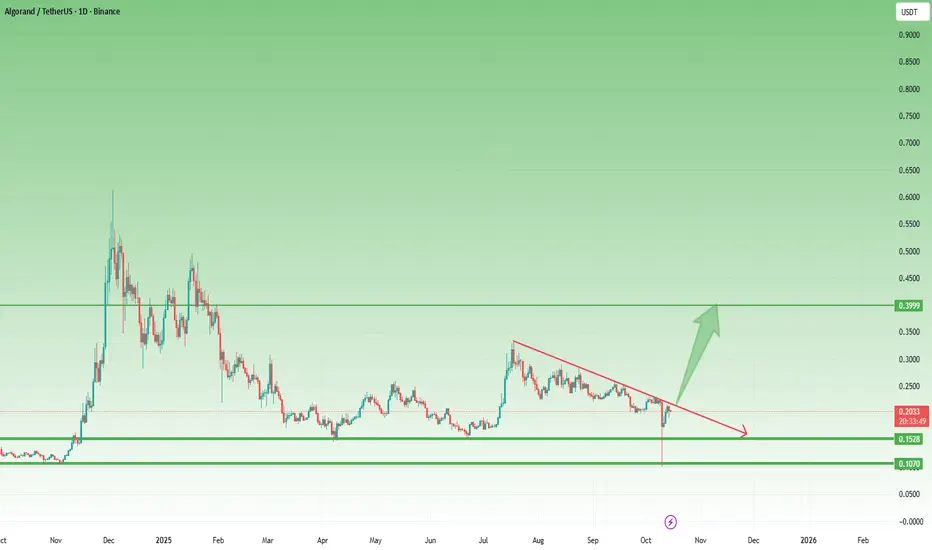
ALGO – Reversal from the Final Support ZoneLike most altcoins, Algorand also ended Friday’s crash by touching its final support zone, then strongly reversed.
After dropping to 0.10, the coin rebounded sharply and reclaimed the next key level at 0.15.
Currently trading around 0.20, ALGO is showing early signs of stabilization. If the overall crypto recovery continues, this setup could develop into a solid bullish signal.
The confirmation comes with a break above 0.2250, which would mark the end of the correction that started in December last year — opening the way toward the 0.40 zone.
Let’s see if the market confirms it. 🚀
LINK – Back Inside the Bullish FlagOn Friday night, Chainlink lost its confluence support from the 18.50 zone and dropped sharply to just under $10.
However, looking at the chart, we can clearly see the importance of this area, marked by both the 2022–2023 accumulation resistance and the 2024 lows.
From there, the coin rebounded fast, managing to reclaim the 18.50 support and re-enter the bullish flag that started forming at the end of August.
This recovery shows strong buying interest — but no clear buy signal has yet appeared.
For now, LINK remains a coin to watch closely.
A confirmed breakout above 21.50 would open the door for a new bullish leg, with 30 USD as the next technical target.

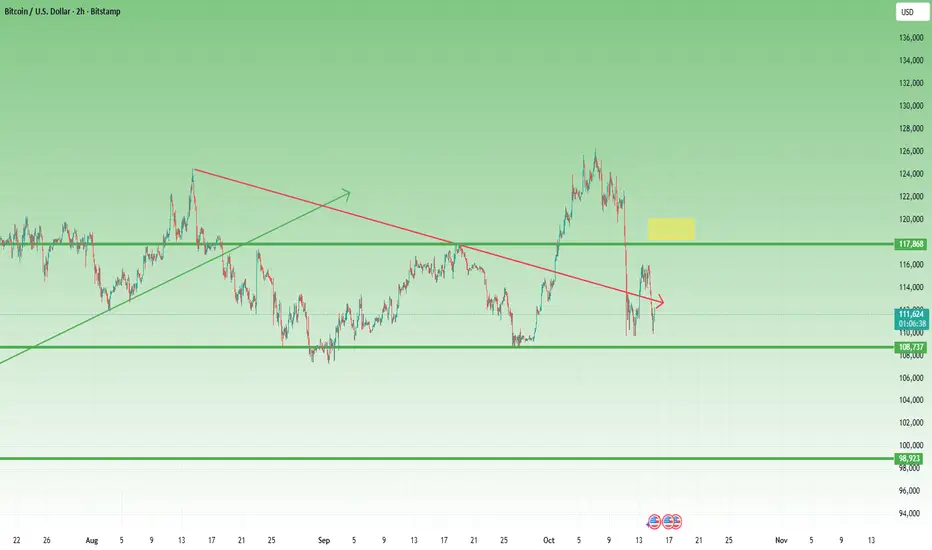
Why This BTC Price Action Doesn’t Inspire ConfidenceIn my yesterday’s analysis, I raised a rhetorical question: I s Bitcoin in a corrective rebound, or are we witnessing a genuine upside reversal?
Even in my Sunday educational post, I mentioned that the whole “ great reset, now we go up ” narrative doesn’t resonate with how I view trading.
At the time of writing, BTC is down again around 112K, after touching once more the 110K support zone — almost like a second chance for those who missed the first dip.
However, this kind of price action is far from encouraging in my opinion.
________________________________________
Technical Picture
• The price reversed before the 118K resistance, forming what can now be viewed as a lower high.
• If the 110K level breaks, the next obvious target remains 100K, both from a psychological and technical perspective.
________________________________________
Trading Plan
My plan is to sell preferably around the recent high, aiming to position with the broader structure rather than chase short-term fluctuations.
BTC still needs to prove it can sustain an uptrend — until then, rallies look like selling opportunities rather than the start of a new bull leg.
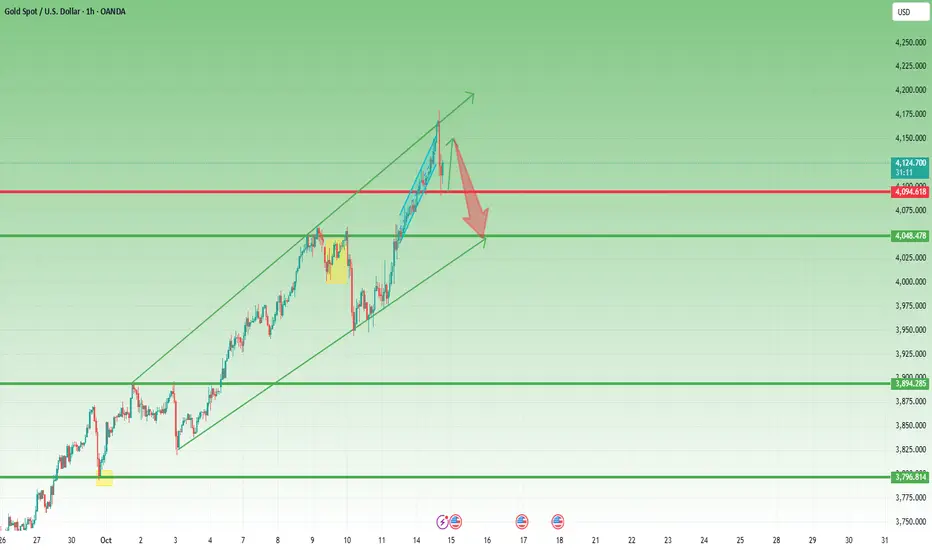
Is This the End of the Insane Rally? (read before comment!)In my Sunday video, I argued that after Friday’s close it seemed likely that 4100 could be next for Gold — and indeed, Gold didn’t just stop there, it printed a new all-time high at 4180.
Yesterday, as usual, when I woke up Asia had already done its job — we’re used to that by now — and I found the price 400 pips higher. So, I simply watched.
However, last night, considering that after a 1500+ pip rally at least a correction could follow, I decided to take a short position — a very risky one, to be fair.
Luck (and timing) were on my side, and by the time of writing this post, the price already dipped under 4100, and my trade was closed with a +600 pip take profit.
________________________________________
The Big Question:
Is Gold done with this insane rise?
In my opinion — yes, at least temporarily.
There’s no secret that the price is overstretched, and if we look carefully at the chart, the recent 4,000-pip rise is contained within an expanding triangle.
We saw a short-lived spike above the resistance of that triangle — and also above the ascending channel — followed by a strong 1,000-pip reversal in just two hours, clearly signaling heavy profit-taking.
At this moment, the price has stopped its descent around the horizontal level below 4100, and we’re seeing a technical rebound.
I plan to use this rebound as a new selling opportunity.
While my first short targeted the 4100 area, my second trade will aim for the 4050 zone, which coincides with last week’s all-time high and now acts as a key confluence support.
________________________________________
Final Thoughts
Markets often humble us — and they do it with irony.
Although I'm very bullish on Gold overall, my last five trades have all been shorts.
And the irony? The results are more than satisfying:
✅ +550 pips
❌ -200 pips
➖ Break-even
✅ +350 pips
✅ +600 pips
That’s +1,300 pips profit from trading drops in a bullish market.
The market truly has a sense of humor. 😄
Lingrid | GOLD Retracement Entry Trend Continuation SetupThe price perfectly fulfilled my previous idea . OANDA:XAUUSD remains within its strong upward channel, rebounding each time from its dynamic trendline to form higher lows. The structure displays clear bullish momentum supported by consecutive range breakouts and sustained trend continuation. A stable hold above 4,050 could trigger a renewed rally toward 4,200 and possibly 4,250 resistance. The broader market structure confirms steady accumulation, keeping buyers in control of the short-term trend.
⚠️ Risks:
A break below 4,060 could weaken bullish pressure and lead to a deeper correction.
Rising U.S. yields or hawkish Fed Chair Powell commentary may limit upside momentum.
Unexpected macro data or geopolitical developments could cause short-term volatility.
If this idea resonates with you or you have your own opinion, traders, hit the comments. I’m excited to read your thoughts!

Lingrid | AUDUSD Demand Zone Bounce OpportunityFX:AUDUSD extended its decline after a clear rejection from the resistance zone, breaking below both its upward channel and short-term support trendline. Price is now approaching the demand zone near 0.6430. A rejection and rebound above 0.6430 would confirm a short-term recovery setup as buyers attempt to regain control. Momentum currently leans corrective rather than impulsive, suggesting a possible consolidation before any larger directional move.
⚠️ Risks:
Weakness in commodities or a stronger USD could delay recovery attempts.
Failure to hold 0.6430 may expose price to deeper losses.
Upcoming U.S. macro data could increase volatility across USD pairs.
If this idea resonates with you or you have your own opinion, traders, hit the comments. I’m excited to read your thoughts!

Lingrid | DOGEUSDT Range Bound Market AnticipatedThe price perfectly fulfilled my previous idea . OKX:DOGEUSDT dropped sharply after forming a lower high near the resistance trendline, confirming a clean breakdown from its triangle formation. The market is now consolidating near the support zone. A sustained hold above 0.180 could initiate a rebound toward 0.231 as momentum stabilizes. Recent volatility seems corrective in nature, implying that price may attempt a recovery once consolidation completes.
⚠️ Risks:
Broader market weakness could extend the correction phase.
Failure to hold 0.182 support may trigger deeper retracement.
Any negative crypto sentiment or BTC pullback could delay recovery.
If this idea resonates with you or you have your own opinion, traders, hit the comments. I’m excited to read your thoughts!

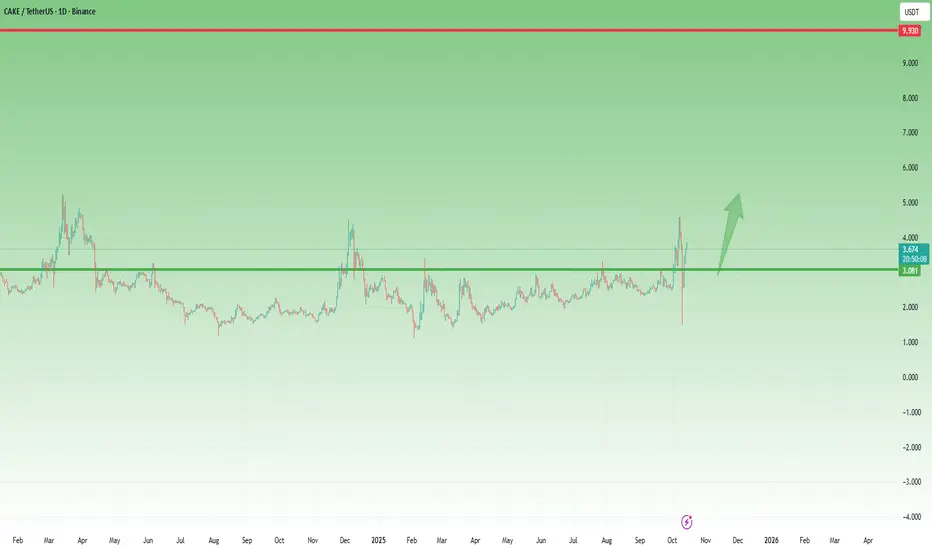
CAKE Analysis — Bulls Still in the GameIn my previous CAKE analysis, I mentioned that the coin could rise to at least 5 USD, following a breakout above the 1.5-year accumulation resistance.
That projection worked well, with CAKE reaching a high around 4.5 USD before entering what initially looked like a normal correction. However, Friday’s massive liquidation event turned that pullback into a sharp drop.
Yet, unlike many other altcoins that are still trading below their broken supports, CAKE showed an impressive recovery, quickly reclaiming the lost level. This kind of V-shaped recovery often signals strong underlying bullish pressure and confident buyers.
Technical outlook:
• Bias: Bullish again
• Key support: 3.00 USD (as long as price holds above, trend remains constructive)
• Target zone: 5.00 USD
• Strategy: Look for entry points near 3.00 USD or during healthy dips above that level
Momentum has shifted back to the bulls, and as long as 3 USD holds, the path of least resistance remains upward. 🚀
EURUSD Bears Still in Control – Rallies Are for SellingAs I explained before, my bias on EURUSD is bearish.
In yesterday’s DXY analysis, I mentioned that as long as the 98.60 zone remains intact, the U.S. Dollar Index has high chances to extend its rise toward 100.00.
That scenario is playing out perfectly so far.
Yesterday, EURUSD erased the entire Friday’s up move, falling back to its local support area. This type of reversal structure is typically seen in weak markets — when bullish attempts are quickly negated by strong selling pressure.
From a technical standpoint, this is very bearish price action. The market keeps testing the same support level without any meaningful bounce, which usually leads to a breakdown rather than a reversal.
My strategy remains unchanged:
• Bias: Bearish
• Plan: Sell rallies
• Short-term view: Pressure remains on the downside
• Medium-term target: 1.1400, with respect for the 1.1500 psychological level
As long as DXY holds above 98.60, EURUSD should remain under pressure. The pair might consolidate briefly, but the broader structure still points lower.

Everyone’s Bullish Again… But Is Bitcoin Ready?As I explained in yesterday’s post , even though I want to stay bullish — partly because I still hold a bag of altcoins — the overconfidence across the market makes me cautious.
Everyone seems convinced that “the bottom is in.” and history tells us that when sentiment becomes one-sided, it’s often premature.
________________________________________
1. Recent Price Action
Bitcoin indeed reversed from a key support zone and managed to recover part of Friday’s losses.
However, so far, this looks more like a technical rebound than a return of genuine buying power.
Momentum remains fragile, and price is still struggling.
________________________________________
2. Key Technical Levels
• Resistance: The $118K horizontal level followed by the $120K psychological barrier remain decisive.
Only a clear breakout above these zones would signal renewed bullish control.
• Support: On the downside, failure to hold above $110K would likely trigger a new leg lower, erasing the recent optimism.
________________________________________
3. Outlook
The structure is neutral-to-bearish until Bitcoin confirms strength above $118K–$120K.
Until then, this bounce should be treated as a reaction, not a reversal.
________________________________________
Bottom line:
I still want to be bullish — but I’ll follow the chart, not the crowd.
Confirmation first, conviction later. 🚀

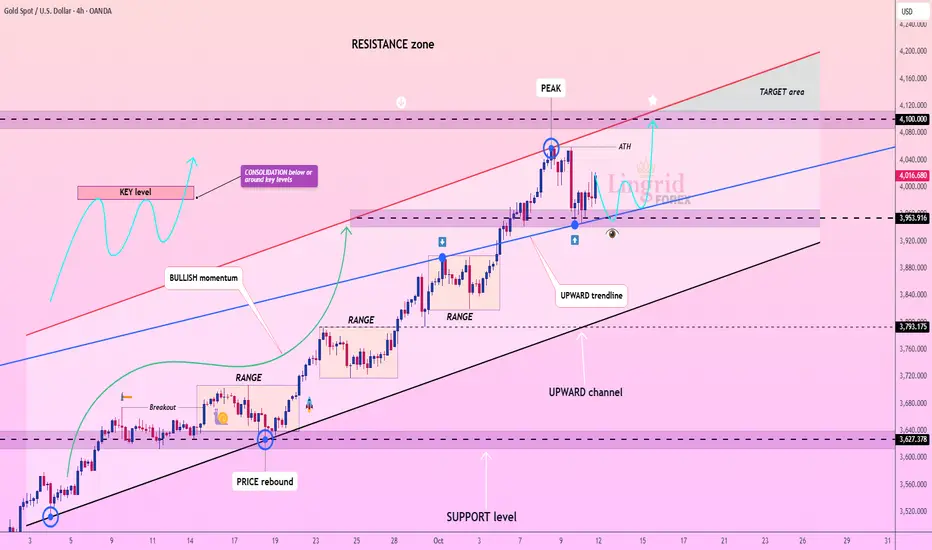
Lingrid | GOLD Weekly Outlook: Dip-Buying Dominance ContinuesThe price perfectly fulfilled my previous weekly idea . OANDA:XAUUSD market delivered another impressive performance this week, decisively pushing through the psychologically significant $4,000 threshold. While this round number naturally attracts considerable market attention, seasoned traders recognize it as simply another milestone in gold's broader trajectory rather than a definitive ceiling.
What's particularly noteworthy is the dramatic increase in market volatility. Recent weeks have demonstrated a pattern where pullbacks averaging around 2% are consistently followed by rallies exceeding 4.5%. This asymmetric price action—where advances substantially outpace corrections—reveals strong underlying bullish momentum and aggressive buying on dips. The market may easily absorb a 2.8% pullback before staging another robust recovery, reinforcing this established rhythm.
Price action shows gold trading within a well-defined upward channel, with price respecting both the lower trendline support near $3,950 and approaching the upper resistance zone around $4,100. The all-time high formation near $4,060 marked a crucial peak, and current consolidation below this level suggests the market is building energy for the next directional move.
Key support remains anchored around $3,950, while the upward channel structure indicates potential targets extending into the $4,100-$4,200 range. The combination of persistent bullish momentum, widening volatility swings, and successful defense of higher lows points to a market that's far from exhausted. We should watch for either a breakout above $4,060 toward the target area or a retest of channel support before the next advance materializes.
If this idea resonates with you or you have your own opinion, traders, hit the comments. I’m excited to read your thoughts!
Lingrid | EURUSD Resistance Rejection: Bearish ContinuationThe price perfectly fulfilled my previous idea . FX:EURUSD continues to slide after rejecting the 1.1700 resistance and failing to maintain consolidation highs. Price action shows a break below the midrange structure, confirming bearish momentum within the descending setup. The pair now tests the upward trendline, with potential to revisit the 1.1545 support if 1.1680 remains unbroken. Overall, market sentiment suggests a controlled downside correction as traders position for deeper pullback phases.
⚠️ Risks:
A break back above 1.1680 could invalidate the bearish structure.
Dollar weakness driven by macro data may fuel short-covering.
Unexpected ECB policy comments could trigger sharp volatility.
If this idea resonates with you or you have your own opinion, traders, hit the comments. I’m excited to read your thoughts!

Hellena | Oil (4H): SHORT to support area of 58.884Colleagues, it appears that the downward movement is not over and I see several reasons to continue to look short.
The higher order wave “C” is looking to complete the correction and I expect the start of the middle order wave “3” to see the low update and reach the support area at 58.884.
Fundamental context
Oil remains under pressure as supply increases and demand outlook weakens. OPEC+ decided to slightly raise output for November, while U.S. inventories keep growing. Crude lost about 8% last week, and EIA now expects lower prices by the end of the year — all of which supports the idea of a continued downside move within wave “3” toward the 58.884 support area.
Manage your capital correctly and competently! Only enter trades based on reliable patterns!

Lingrid | BTCUSDT Sharp Drop Creates Buying OpportunityThe price perfectly fulfilled my previous idea . BINANCE:BTCUSDT rebounded sharply from the 102,100 support level after a flash crash, signaling renewed demand near structural lows. Price action remains inside a wide consolidation range, with the 119,500 target acting as a key resistance level. A sustained price movement above the trendline could confirm recovery momentum toward ATH at 125,000. The flash crash likely shook out weak hands before market stabilization and potential re-accumulation.
⚠️ Risks:
Another liquidity flush below 108,000 could trigger panic selling.
Broader risk-off sentiment across crypto could delay recovery.
Failure to reclaim 119,500 may reinforce short-term bearish pressure.
If this idea resonates with you or you have your own opinion, traders, hit the comments. I’m excited to read your thoughts!

Hellena | SPX500 (4H): SHORT to support area of 6646 .Colleagues, in the last forecast I was counting on price reaching the 6550 area, but that plan turned out to be a long term plan. I see the sense in making some shorter term targets.
The closest target I see is the 6646 support area, where wave “4” ends. This is a corrective movement, so it is necessary to realize that the price may continue to fall after reaching the target.
Fundamental context
U.S. inflation remains elevated — CPI rose to about 2.9 % YoY, with core inflation around 3.1 %. At the same time, the labor market continues to cool, and corporate earnings show mixed results. Combined with the Fed’s cautious stance and ongoing fiscal uncertainty, this creates pressure on the stock market.
Manage your capital correctly and competently! Only enter trades based on reliable patterns!

DXY Analysis – Bullish Structure Still IntactIn my latest DXY analysis, I mentioned that the 100.00 level remains the next key target for the U.S. Dollar Index.
After an initial push higher to 99.55, the index faced some selling pressure and is now trading slightly below 99.00.
However, the constructive bullish structure remains intact as long as price holds above the 99.60 support zone.
________________________________________
1. Technical Context
• The recent pullback looks more like a healthy correction rather than a trend reversal.
• The higher-lows pattern remains valid, keeping the bullish momentum alive.
• The 99.60 area now acts as a key pivot zone — holding above it favors a renewed push toward 100.00.
________________________________________
2. Trading Implications
Given this setup, selling rallies in EUR/USD and GBP/USD remains the preferred strategy, as both pairs are likely to face renewed dollar strength once DXY resumes its upward leg.
________________________________________
In short:
The Dollar Index remains bullish.
As long as 99.60 holds, the path of least resistance stays upward — and 100 remains on the radar. 🚀
