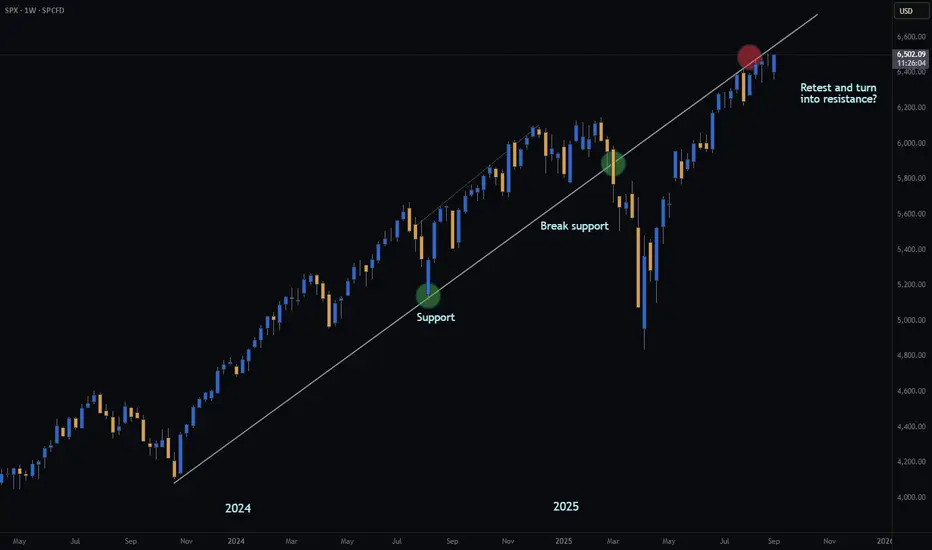
S&P | KEY RESISTANCE | GTradingMethodHello traders!
Has the S&P finally met its match?
Is this just a retest… or the beginning of a much deeper move?
- Broke diagonal support earlier this year
- Retesting previous support now
- Potential daily double top forming
If the retest holds, it’s a long way down… 📉
What are your thoughts? Keen to hear them :)
Signing off
G
Signalsprovider
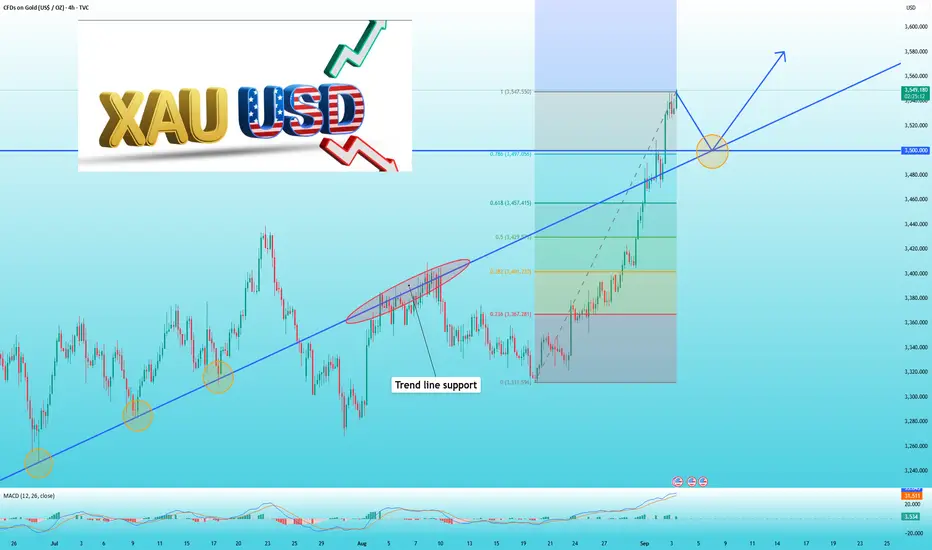
Lingrid | GOLD Employment Data Play - Long OpportunityOANDA:XAUUSD is climbing inside an upward channel, bouncing steadily from support and pushing through recent resistance with bullish momentum. The structure shows higher highs and higher lows, confirming the trend continuation bias. A clean hold above 3,500 keeps the path open for another push higher. Momentum favors retesting the resistance zone, where a breakout could unlock more upside potential.
📉 Key Levels
Buy trigger: Break above 3,505
Buy zone: 3,500–3,520 support retest
Target: 3,600–3,615 zone
Invalidation: Break below 3,460 support
💡 Risks
Stronger-than-expected NFP data today could fuel USD strength and pressure gold lower.
Failure to hold the 3,505 support may shift momentum to the downside.
Geopolitical or macro shifts driving risk-on sentiment could reduce safe-haven demand for gold.
If this idea resonates with you or you have your own opinion, traders, hit the comments. I’m excited to read your thoughts!

Lingrid | EURJPY Consolidation Zone Breakout. LongFX:EURJPY is pressing higher after breaking above the recent consolidation range and retesting the breakout level. The pair is holding inside an upward channel structure, with higher lows supporting bullish momentum. As long as price sustains above 172.50, continuation toward the 174.00 resistance looks likely. A broader bullish pattern remains intact, favoring further upside if the breakout holds.
📉 Key Levels
Buy trigger: Sustained hold above 172.50
Buy zone: 172.50 – 172.70
Target: 174.00
Invalidation: Break below 172.00
💡 Risks
A sharp reversal in yen strength due to risk-off sentiment could weigh on bullish continuation.
ECB or BoJ policy updates could trigger volatility against the technical setup.
Failure to hold above 172.50 may force a retest of deeper support near 172.00.
If this idea resonates with you or you have your own opinion, traders, hit the comments. I’m excited to read your thoughts!

Lingrid | TONUSDT Approaching Psychological Level. Potential BuyOKX:TONUSDT is trading inside a downward channel after repeated rejections at the 3.73–3.75 resistance zone. The structure shows a corrective pattern with a recent breakout attempt that failed to gain momentum. As long as price hovers near the 3.00 level, liquidity pool below and support demand may provide a potential springboard. A rebound from this area could trigger a surge back toward the 3.50 zone.
📉 Key Levels
Buy trigger: rejection 3.00 with volume confirmation
Buy zone: 2.97–3.00 support demand
Target: 3.35 resistance zone
Invalidation: Sustained drop below 3.00
💡 Risks
Breakdown of support below 3.00 could extend losses toward the 2.80–2.85 range.
Broader market weakness in Bitcoin or Ethereum may cap recovery attempts.
Macro factors, such as regulatory news or liquidity shifts, could increase volatility.
If this idea resonates with you or you have your own opinion, traders, hit the comments. I’m excited to read your thoughts!

S&P500 | Daily Double Top | GTradingMethodHello Traders.
Welcome to today's trade idea by GTradingMethod.
🧐 Market Overview:
I’ve opened a short on the cash500 (S&P 500) at 6521. All GTradingMethod variables have been met, which means this trade setup qualifies under my system.
Additional confluences suggesting weaker buying strength include:
- RSI making lower highs while price pushed higher highs.
- Volume tapering off toward the latter part of the rally.
- MACD on sell signal
The only hesitation is that money flows have not decreased in the later stages of this move — but rules are rules. My edge is probability-based, so when my variables align, I must take the trade consistently.
📊 Trade Plan:
Risk/reward = 9.2
Entry price = 6520
Stop loss price = 6544
Take profit level 1 (50%) = 6370
Take profit level 2 (50%) = 6215
💡 GTradingMethod Tip:
A high RR doesn’t make a trade safer — it simply reflects how far the market could move relative to your risk. Always focus on process and probability, not just the potential payout.
🙏 Thanks for checking out my post!
Make sure to follow me to catch the next idea and please share your thoughts - I would like to hear them.
📌 Please note:
This is not financial advice. This content is to track my trading journey and for educational purposes only.

BTC Quick Buy Trade with a whaleBTCUSDT .. by monitoring the coin, I noticed a whale entering the market and buying Bitcoin around 109,500, which is why the price is currently moving up.
We can take advantage of the whale’s entry levels for a quick profit opportunity.
Please keep following this trade, as I will update you with any changes regarding the exit.
➡️ I will enter a long position if the price retraces back to the green line at 109,745.
🎯 Targets :
TP1 = 110,600
TP2 = 111,000
Good luck and may you always be profitable!
please note : this opportunity is not financial advice — it reflects only my personal opinion.
PLEASE always do your own research before trading
A 10-year veteran in crypto. I hunt for hidden gems and deliver concise opportunities directly. Follow for high-value insights.

Gold head and shoulders top appears, beware of falling risksSeveral US data released an hour ago were all bullish for gold, including the crucial ADP and initial jobless claims figures. However, gold's price hasn't seen much of a rally.
I think this is because some investors are taking profits on the one hand, and on the other hand the data's impact on the September rate cut is decreasing.
I believe a September rate cut is inevitable, but the hype has been excessive. Gold prices have been rising for some time, and this has already been largely priced in.
In addition, the one-hour chart shows that if gold prices fall from 3550, a head and shoulders top pattern will form, with 3350 being the final shoulder.
So, I believe shorting gold is a viable option as long as it fails to hold above 3550.
📣If you have different opinions, please leave a message below to discuss

Lingrid | GOLD Price Correction and Bullish Trend ContinuationOANDA:XAUUSD has surged to test the resistance zone above 3,500 after strong bullish momentum carried price through the wedge breakout. The structure is defined by an upward channel, with the latest higher low aligning with trend continuation. As long as price holds above 3,490, the bullish bias remains intact, targeting the 3,600–3,620 zone. The broader pattern favors trend extension unless a deep pullback invalidates momentum.
📉 Key Levels
Buy trigger: Hold above 3,490 resistance
Buy zone: 3,490–3,500 support retest region
Target: 3,590–3,600 resistance
Invalidation: Breakdown below 3,490
💡 Risks
Strong rejection from resistance zone near 3,550 leading to corrective retracement.
Unexpected USD strength from macroeconomic releases weighing on gold.
Bond yield spikes undermining safe-haven demand for gold.
If this idea resonates with you or you have your own opinion, traders, hit the comments. I’m excited to read your thoughts!

Lingrid | SOLUSDT Potential Long ot Psychological Level of $200The price perfectly fulfilled my previous idea . BINANCE:SOLUSDT is pulling back after testing the resistance zone near 208–210 and remains supported by the upward channel structure. Price action has formed a range above 195, with higher lows protecting the trendline and momentum holding firm. If 195–200 holds as support, price could rebound toward the 225 level for the next leg. Sustained momentum inside the channel keeps the broader bias bullish with potential mid-term targets higher.
📉 Key Levels
Buy trigger: Rejection 200 support zone
Buy zone: 195–200 accumulation region
Target: 225
Invalidation: Break below 180
💡 Risks
Breakdown of the upward channel with daily close below 195.
Strong USD data pressuring risk assets across markets.
Loss of broader market momentum leading to deeper corrective moves.
If this idea resonates with you or you have your own opinion, traders, hit the comments. I’m excited to read your thoughts!

PAXG: Good Selling Opportunity
PAXGUSDT
The Price is testing the 3600 resistance zone with clear overbought signals and currently approaching its all-time high with overbought indicators.
BYBIT:PAXGUSDT.P
It is also close to completing a Double Top pattern if the price touches the previous high at 3,600 and closes the day below it , this signals a strong possibility of a downside move
A correction could begin from the strong resistance zone at the previous peak of 3,600.
Position Type : Sell (Short-Term Correction)
postimg.cc
Entry Zone: If the price rises again and touches the sell zone, enter at a price between 3,590 and 3,600.
Targets:
TP1: 3550
TP2: 3525
Stop Loss (SL) : 3,640 if Daily close above this level
Note:
If the price drops first and hits the second target (3525) before reaching the entry zone , this opportunity is invalid.
This opportunity is not financial advice — it reflects only my personal opinion.
PLEASE always do your own research before trading

Don't chase the rise of gold, wait for the retracement to 3500Gold retreated to 3470 yesterday before rebounding. Driven by safe-haven funds, it surged strongly, breaking through the 3500 resistance level and reaching an all-time high of 3546.
The main reason for the rise is market concerns about the UK's economic outlook. Coupled with the general rise in global bond yields, the UK's long-term borrowing costs hit their highest level since 1998 yesterday.
As for gold at this point, my view remains that it's best not to chase the rally. While the current state of gold is generally bullish, the more such times are, the greater the risks.
Especially with gold prices at their all-time high, you don't know where the top will be or where the pullback will begin. This creates the greatest uncertainty.
When it comes to trading, my philosophy has always been to avoid uncertain trades. I prefer to wait for better opportunities, as they are free.
What gold needs now is a pullback to support, which would provide momentum for further gains. However, yesterday's pullback to the crucial 3450 level wasn't reached. Currently, gold has broken through 3500, so 3500 has turned from pressure to support, so I will pay attention to 3500 next and wait to see whether it stabilizes before considering whether to enter the market.
📣If you have different opinions, please leave a message below to discuss
Gold | 15min Head and Shoulders | GTradingMethodHello Traders.
Welcome to today's trade idea by GTradingMethod.
🧐 Market Overview:
There’s a potential head and shoulders pattern forming on the 15-minute chart. Gold broke to a new high yesterday, and a healthy breakout often comes with a retest before continuing higher.
This 15-minute head and shoulders could signal that retest — or potentially lead to a deeper correction.
One of the variables I will be looking for is lower volume on the right shoulder.
📊 Trade Plan:
Risk/reward = 3.3
Entry price = 3 536.3
Stop loss price = 3 543.5
Take profit level 1 (50%) = 3 516.8
Take profit level 2 (50%) = 3 506
💡 GTradingMethod Tip:
Patterns can provide an edge, but waiting for confirmation helps you avoid false signals and emotional decisions.
🙏 Thanks for checking out my post!
Make sure to follow me to catch the next idea and please share your thoughts - I would like to hear them.
📌 Please note:
This is not financial advice. This content is to track my trading journey and for educational purposes only.

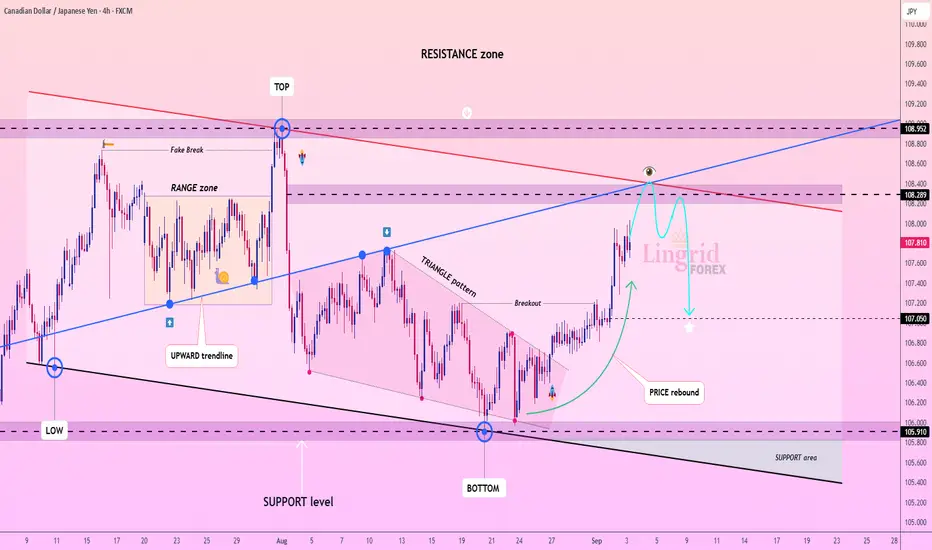
Lingrid | CADJPY Potential Short at the Confluence ZoneFX:CADJPY has recently rebounded from the support zone near 106.00 and surged back toward the resistance structure. The chart shows a breakout from a triangle pattern that shifted momentum upward, but the confluence of trendline and channel border signals a possible rejection at resistance. As long as price remains capped below 108.30–108.50, downside retracement risk increases. A rejection here could send the pair back toward the 107.00 support area, aligning with the broader consolidation phase.
📉 Key Levels:
Sell trigger: Rejection at 108.30 resistance zone
Sell zone: 108.20–108.50 region
Target: 107.05 support
Invalidation: Break and close above 108.95
💡 Risks:
Unexpected strength in CAD fundamentals could fuel a bullish breakout.
JPY weakness from BOJ policy stance could limit downside.
Broader risk-on sentiment in global markets may push price higher despite technical rejection.
If this idea resonates with you or you have your own opinion, traders, hit the comments. I’m excited to read your thoughts!
Lingrid | ETHUSDT Bullish Momentum Following Trendline BreakoutBINANCE:ETHUSDT is approaching the $4,200 support zone and forming a higher low structure. The chart shows a falling wedge pattern breaking against the downward trendline, indicating potential bullish reversal. If price holds above $4,200 and confirms breakout, continuation toward $4,600 becomes likely. Momentum is supported by prior impulse legs and structural rebounds, hinting at a bullish surge.
📉 Key Levels
Buy trigger: Breakout confirmation above the downward trendline
Buy zone: 4,200 – 4,250
Target: 4,600
Invalidation: Close below 4,000
💡 Risks
Failure to sustain above the breakout trendline could trap buyers.
Upcoming macroeconomic data from the U.S. may strengthen the dollar.
Broader crypto market correction could weaken ETH momentum.
If this idea resonates with you or you have your own opinion, traders, hit the comments. I’m excited to read your thoughts!

Gold | H1 Double Bottom | GTradingMethodHello Traders.
Welcome to today's trade idea by GTradingMethod.
🧐 Market Overview
Gold has been making higher highs while RSI has been making lower highs, which is known as negative RSI divergence. This is an indication of weakening buying strength. For further confluence, this potential double top is at the ATH level, which could provide further resistance.
📊 Trade Plan
Risk/reward = 2.9
Entry price = 3 497.6
Stop loss price = 3 515.5
Take profit level 1 (50%) = 3 456.4
Take profit level 2 (50%) = 3 431.9
💡 GTradingMethod Tip
Always predefine your risk for every trade and always accept this risk. If you accept the risk, there can be no emotional pain. If you do not get emotional, you will interpret the market's information objectively.
🙏 Thanks for checking out my post!
Make sure to follow me to catch the next idea and please share your thoughts - I would like to hear them.
📌 Please note:
This is not financial advice. This content is to track my trading journey and for educational purposes only.

Lingrid | GOLD Approaching Major Psychological LevelOANDA:XAUUSD is approaching major psychological resistance zone after a strong bullish surge from the consolidation base. The structure is determined by an upward channel with momentum directed towards the 3,500 level, but rejection signals are forming near the upper boundary, as markets do not usually break through strong levels on the first test. If price confirms rejection below 3,510, a pullback toward the 3,440 zone becomes likely. The broader pattern shows extended bullish momentum but overbought conditions raise the risk of a correction.
📉 Key Levels
Sell trigger: Rejection at 3,510 resistance
Sell zone: 3,500–3,510 range
Target: 3,440 zone
Invalidation: A close above 3,510 with continuation toward 3,560
💡 Risks
Unexpected USD weakness could extend gains beyond resistance.
Strong macroeconomic releases may fuel volatility.
Global risk sentiment shifts could sustain gold’s safe-haven demand.
If this idea resonates with you or you have your own opinion, traders, hit the comments. I’m excited to read your thoughts!

Gold waits for a pullback to support before considering buyingYesterday, as the U.S. market was closed for Labor Day, market liquidity and volatility decreased, and gold basically did not fluctuate.
Gold prices rose again at the open today, pushing the all-time high to 3508, but only barely breached it, remaining under pressure from the 3500 level.
Yesterday I said that 3500 is crucial and if it cannot break through, there will be a correction. This view is currently being verified.
In addition, I am determined not to chase high prices anymore, especially when it approaches the 3500 mark. If you want to continue buying gold, I believe you should wait until the price retraces to support around 3450 or 3430 before considering it.
📣If you have different opinions, please leave a message below to discuss

Lingrid | EURAUD Price Rebound From Major Support ZoneFX:EURAUD is rebounding from the higher low after testing both the upward channel and consolidation support. The structure highlights a breakout from the downward trendline with price consolidating around 1.7880. As long as 1.7850 holds, a bullish push toward 1.8000 looks likely. Momentum remains constructive, aligning with the broader upward channel bias.
📉 Key Levels
Buy trigger: Break and hold above 1.7850
Buy zone: 1.7850 – 1.7880 accumulation range
Target: 1.8000
Invalidation: A close below 1.7800
💡 Risks
Failure to sustain momentum above 1.7850 could trap buyers in a false breakout.
Strong AUD data could cap upside movement and reverse the setup.
Broader risk sentiment turning negative may weigh on EUR.
If this idea resonates with you or you have your own opinion, traders, hit the comments. I’m excited to read your thoughts!

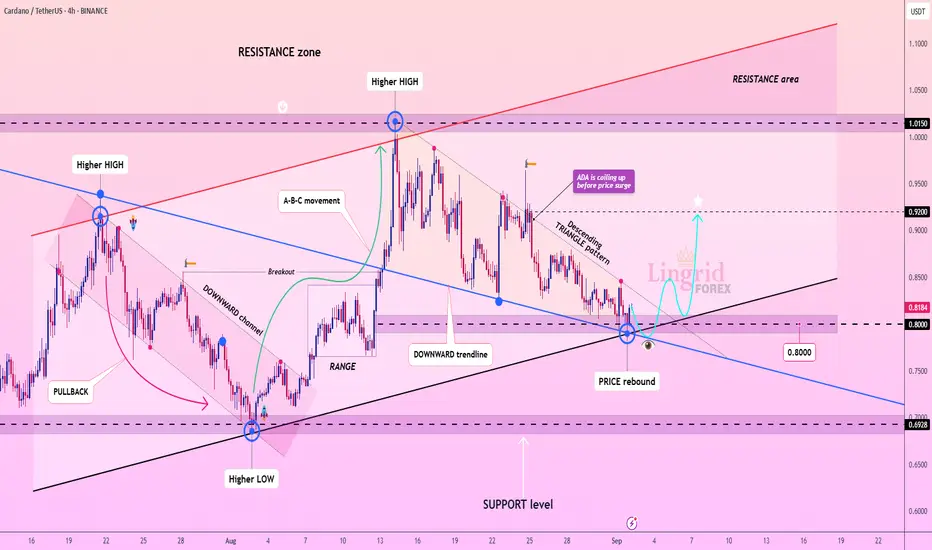
Lingrid | ADAUSDT Bullish Continuation Pattern From Key LevelBINANCE:ADAUSDT is rebounding from the $0.8000 support after retesting a descending triangle structure. The chart shows an upward projection forming after the price defended higher lows against the downward trendline. As long as $0.8000 holds, the outlook points to a continuation toward $0.9200. This setup aligns with broader bullish recovery momentum from the higher-timeframe support zone.
📉 Key Levels
Buy trigger: Break and hold above $0.8500
Buy zone: $0.8000–$0.8200
Target: $0.9200
Invalidation: Close below $0.8000
💡 Risks
Breakdown of $0.8000 support would invalidate bullish momentum.
Macro-driven weakness in risk assets could pressure ADA.
A sharp Bitcoin reversal could drag altcoins lower regardless of local setup.
If this idea resonates with you or you have your own opinion, traders, hit the comments. I’m excited to read your thoughts!
Lingrid | EURUSD Potential Bullish Trend ContinuationFX:EURUSD is climbing after rebounding strongly from the support base and pushing toward the resistance zone. The structure shows an upward trendline breakout followed by a steady extension toward 1.1770. As long as 1.1685 holds as support, price action favors further continuation to the upside. The broader context reflects a bullish channel with higher highs and higher lows forming.
📉 Key Levels
Buy trigger: Hold above 1.16850
Buy zone: 1.1685–1.1700 accumulation range
Target: 1.1770 resistance zone
Invalidation: Break below 1.1660 support
💡 Risks
A stronger-than-expected USD catalyst could reverse the setup.
Failure to sustain above the upward trendline may invite bearish pressure.
Broader macro events (ECB or Fed policy updates) could trigger volatility against the structure.
If this idea resonates with you or you have your own opinion, traders, hit the comments. I’m excited to read your thoughts!

Lingrid | BTCUSDT Buying Opportunity From Confluence ZoneBINANCE:BTCUSDT is rebounding from support after completing an ABC pullback inside the broader upward channel. The structure shows a mix of compression phases and breakout legs, now aligning near a key support zone. As long as 106,000 holds, price could extend toward 117,000, with 125,000 as the next major resistance zone. The broader momentum remains bullish, but continuation depends on buyers defending this mid-range.
📉 Key Levels
Buy trigger: Breakout above 112,000 with volume confirmation
Buy zone: 106,000–108,000 accumulation region
Target: 117,000
Invalidation: Close below 100,000
💡 Risks
Failure to hold 106,000 support may expose BTC to deeper retracement toward 97,000.
Broader macro headwinds, such as Fed rate outlook, could limit upside momentum.
If sellers step in strongly near 117,000, rejection could trap late buyers.
If this idea resonates with you or you have your own opinion, traders, hit the comments. I’m excited to read your thoughts!

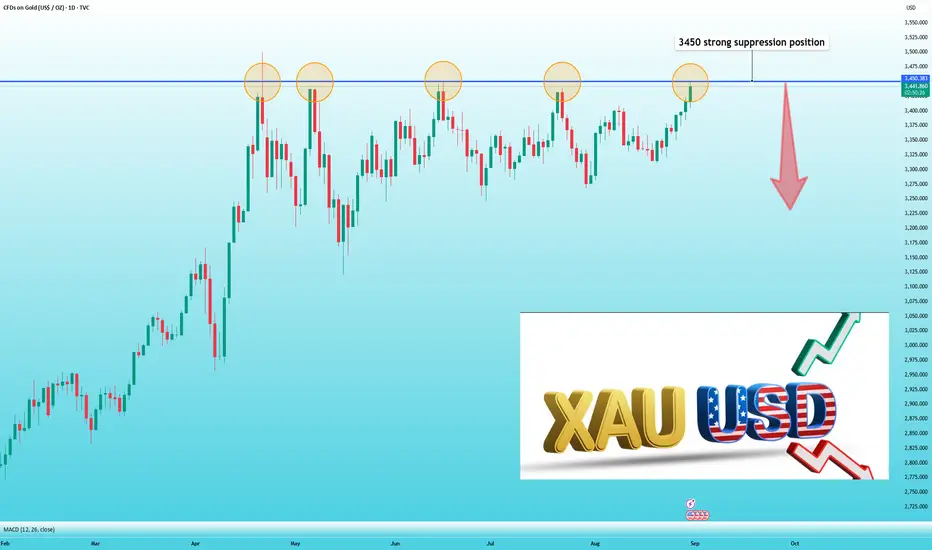
Gold encounters a strong pressure level, you can sellAs I said just now, the rise of gold has encountered resistance at 3450. From the previous trend, we can see that there is strong pressure near 3450. It has failed to break through here effectively for four consecutive times. It is hard to say that the gold price will not fall back again when it comes here again. Therefore, I think it is possible to consider shorting near 3450 and set a stop loss at 3460.
📣If you have different opinions, please leave a message below to discuss
Lingrid | GOLD Weekly Price Outlook: $3500 Target in FocusThe price perfectly fulfilled my previous weekly outlook . OANDA:XAUUSD surged to $3,447 this week, successfully breaking through critical resistance zones that had capped prices since April. The breakout above the $3,420 level represents a significant technical milestone, with the metal now eyeing the all-time high of $3,500. The TVC:DXY 2.19% weekly decline provided crucial tailwinds, despite posting its strongest monthly gain (+4.78%) since April.
Chart reveals gold has completed a classic triangle consolidation pattern and is now trading within an upward channel. The recent price action shows a decisive break above the descending resistance trendline, with strong ETF inflows supporting the rally alongside growing expectations of Federal Reserve rate cuts. The monthly timeframe confirms the long-term bullish trajectory remains intact, with the market demonstrating remarkable resilience after testing lower support levels earlier in the cycle.
The technical picture shows gold emerging from a prolonged consolidation phase, with the upward channel providing a clear roadmap for future price movement. Price action suggest institutional accumulation continues, while the break above the triangle formation indicates potential for sustained momentum. Market sentiment has shifted decidedly bullish following the resistance breakthrough.
Key support now sits at the former resistance zone around $3,400 - 3,420 zone, while the immediate target remains the psychological $3,500 level. The combination of technical breakout momentum, weakening dollar dynamics, and institutional accumulation suggests gold's uptrend has room to extend further into September.
If this idea resonates with you or you have your own opinion, traders, hit the comments. I’m excited to read your thoughts!
