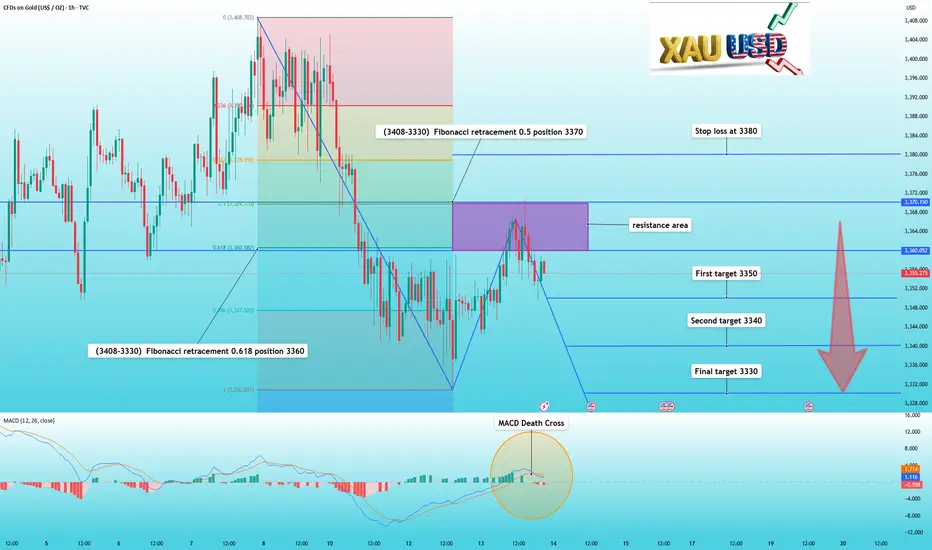
Gold pulls back as expected, you can continue to sellIn my previous trading strategy, I reiterated my view that gold prices would continue to fall if they couldn't break through 3370 in the short term.
And indeed, gold's performance behaved as expected. After hitting 3370, it fell again, reaching a low of 3350.
Technically, the current correction in gold prices hasn't concluded. The Fibonacci retracement indicator for the 3408-3330 trend shows that 3370 is at 0.5, and 3360 is at 0.618, representing resistance. Meanwhile, the MACD indicator has formed a death cross.
Therefore, we do not need to make any changes to our trading strategy. As long as 3370 is not effectively broken, we can continue to short based on the resistance range.
Trade setup is as follows:
Sell near the 3360-3370 area
First target 3350
Second target 3340
Final target 3330
Stop loss at 3380
📣If you have different opinions, please leave a message below to discuss
Signalsprovider
Lingrid | GBPCAD Shorting Opportunity Near Monthly High ZoneThe price perfectly fulfilled my previous idea . FX:GBPCAD has reached the July high and testing the resistance zone, where sellers previously stepped in. The structure shows an extended bullish impulse meeting the channel border and horizontal supply barrier. A rejection here could trigger a retracement toward 1.8551, provided momentum shifts in favor of sellers. If bearish pressure accelerates, deeper downside toward the support base could follow.
📉 Key Levels
Sell trigger: Rejection and close below 1.8650
Sell zone: 1.8757 – 1.8700
Target: 1.8551
Invalidation: 1.8757
💡 Risks
Breakout above the July high invalidating the short setup.
Continued CAD weakness from economic data or oil price drops.
Short-term bullish momentum overpowering early sell entries.
If this idea resonates with you or you have your own opinion, traders, hit the comments. I’m excited to read your thoughts!

Lingrid | SUIUSDT Expansion Trade OpportunityBINANCE:SUIUSDT is rebounding from the breakout point after holding above the 3.70 support zone. Price action is moving within an upward channel, supported by higher lows and recent breakout momentum. As long as 3.70 holds, buyers may attempt a move toward the 4.80 resistance area. Momentum remains aligned with the broader bullish structure targeting the channel’s upper boundary.
📉 Key Levels
Buy trigger: Break above 4.44
Buy zone: 3.70–3.80
Target: 4.80
Invalidation: Below 3.50
💡 Risks
Failure to sustain above 3.70 could trigger deeper retracement.
Rejection at 4.40 resistance may stall momentum.
Broader market weakness impacting altcoin sentiment.
If this idea resonates with you or you have your own opinion, traders, hit the comments. I’m excited to read your thoughts!

Lingrid | BTCUSDT Trendline Breakout - Upside Surge Potential The price perfectly fulfilled my previous idea . BINANCE:BTCUSDT is pushing higher after reclaiming the 120,000 support zone and breaking out of the corrective structure. The trend shows higher lows, maintaining the integrity of the upward channel and pointing toward the 130,000 resistance area. Holding above 120,000 strengthens bullish momentum and keeps the breakout potential alive. The next upside target aligns with the channel’s upper boundary.
📉 Key Levels
Buy trigger: Break and hold above 120,000
Buy zone: 116,000–120,000
Target: 130,000
Invalidation: Drop below 114,850
💡 Risks
Rejection at 122,000 could cause deeper pullback
Macro market weakness may reduce bullish momentum
Failure to hold 120,000 risks retesting lower channel support
If this idea resonates with you or you have your own opinion, traders, hit the comments. I’m excited to read your thoughts!

Lingrid | ADAUSDT Corrective Move Completed ? Potential LongThe price perfectly fulfilled my previous idea . BINANCE:ADAUSDT is bouncing from the higher low near 0.7545 after defending the upward trendline. Price remains within a recovery phase, aiming for the 0.8700 resistance if momentum persists. A clean break above 0.80 would confirm bullish continuation toward higher resistance zones. Losing 0.7545 support would negate the setup and invite deeper retracement.
📉 Key Levels
Buy trigger: Break above 0.8000
Buy zone: 0.7545–0.8000
Target: 0.8700
Invalidation: Close below 0.7545
💡 Risks
Failure to sustain above 0.80 may cause pullback
BTC weakness could drag ADA lower
Macro uncertainty may limit bullish follow-through
If this idea resonates with you or you have your own opinion, traders, hit the comments. I’m excited to read your thoughts!

Lingrid | EURJPY Possible Correction From Key Resistance ZoneThe price perfectly fulfilled my previous idea . FX:EURJPY is rejecting the upper resistance zone after forming a higher high near 173.000. Price structure shows an upward channel with multiple touchpoints and an A-B-C corrective movement. A breakdown toward 171.910 is likely as long as price remains under 173.200. Overall momentum suggests a short-term retracement within the broader trend.
📉 Key Levels
Sell trigger: Break below 172.700
Sell zone: 172.950 – 173.200
Target: 171.910
Invalidation: 173.300
💡 Risks
Failure to sustain breakdown could trigger a squeeze toward 173.400.
Broader uptrend may overpower short-term bearish setup.
Unexpected macro news could reverse sentiment rapidly.
If this idea resonates with you or you have your own opinion, traders, hit the comments. I’m excited to read your thoughts!

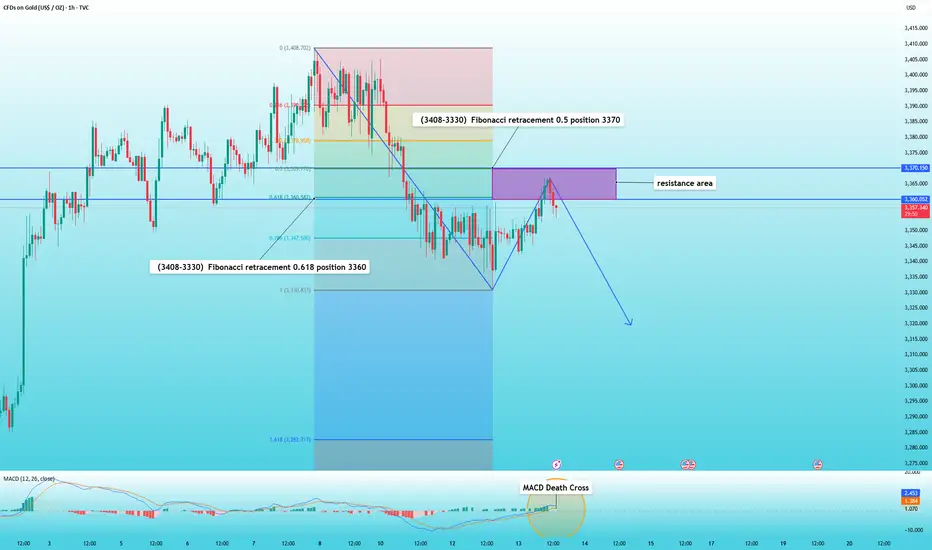
Gold rebounds and is facing resistance, waiting for a declineIn the previous article, I said that if the gold price cannot hold above 3370 in the short term, then the gold price will continue to fall.
Today's rebound in the Asian and European sessions shows mixed gains and losses on the K-line chart, indicating a weak rebound. After rebounding to 3367, gold prices turned downward again.
Meanwhile, the 1-hour MACD indicator also shows signs of forming a death cross. The Fibonacci retracement indicator from 3408 to 3330 indicates that the 0.618 level is at 3360, and the 0.5 level is at 3370. Therefore, the 3360-3370 range is currently a resistance zone.
Therefore, I still maintain my previous view that as long as it cannot hold 3370, you can short in the resistance area.
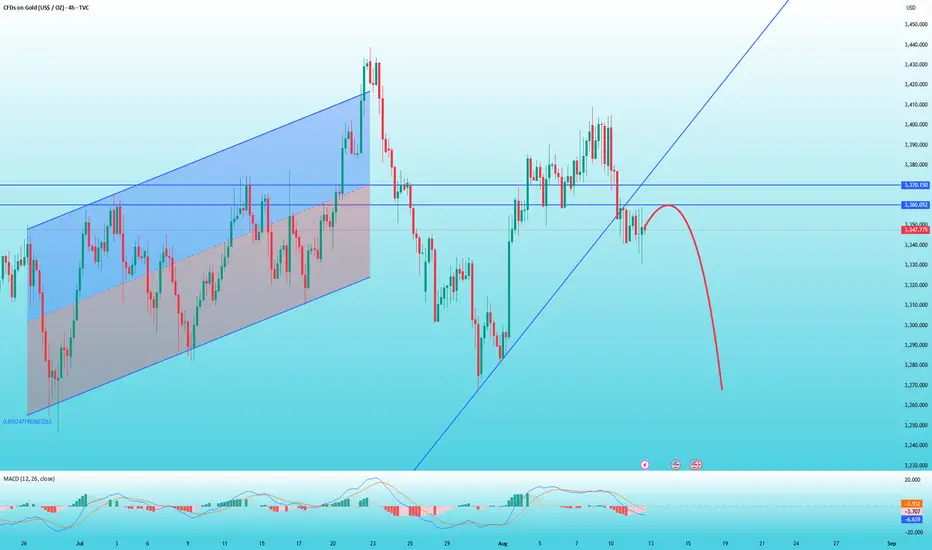
Gold rebound is weak, beware of further declineThe CPI data released this week was lower than market expectations, which is considered positive news. However, since it was the same as the previous reading, gold prices only rebounded briefly before entering another period of volatile consolidation.
From the 4-hour chart, gold prices have already broken through support levels. If they fail to break back above 3370 in the short term, they may continue to test the bottom.
Gold's rebound is weak in the short term, and it's trending downward. The K-line indicator is showing a bearish pattern, and the MACD indicator has formed a death cross.
Therefore, if you want to trade short, wait for a rebound around 3360. Set a stop-loss at 3370, with a target of 3340 and then 3330.
Lingrid | GOLD Anticipating a Trend Continuation Amid PullbackOANDA:XAUUSD is pulling back within the upward channel after topping near the 3,410 resistance zone. Price is currently holding above 3,330 support and aligning with the channel base, signaling potential for a bullish rebound. A push above 3,350 could open the way toward 3,385, while a drop under 3,315 risks deeper correction.
📉 Key Levels
Buy trigger: Break above 3,350
Buy zone: 3,328–3,350
Target: 3,385
Invalidation: Close below 3,320
💡 Risks
Failure to hold upward channel support
Strengthening USD pressuring gold
Sudden macroeconomic news impacting safe-haven demand
If this idea resonates with you or you have your own opinion, traders, hit the comments. I’m excited to read your thoughts!

Lingrid | TONUSDT Making Higher High and Higher LowOKX:TONUSDT is trading inside an upward channel after rebounding from the 3.30 support and holding above the mid-range level of 3.370. The structure shows a series of higher lows and a maintained bullish channel despite recent corrective moves. As long as price stays above 3.370, the path remains open toward the resistance zone at 3.740. Momentum structure and trend alignment support the probability of an upward continuation toward the target area.
📉 Key Levels
Buy trigger: Break and hold above 3.370 with momentum
Buy zone: 3.330 – 3.370
Target: 3.740
Invalidation: Break below 3.00
💡 Risks
A sharp rejection from 3.370 could trigger a deeper retracement.
Broader market weakness may cap upside potential.
Failure to maintain the ascending channel structure would weaken the bullish setup.
If this idea resonates with you or you have your own opinion, traders, hit the comments. I’m excited to read your thoughts!

EURUSD – DAILY FORECAST Q3 | W33 | D13 | Y25📊 EURUSD – DAILY FORECAST
Q3 | W33 | D13 | Y25
Daily Forecast 🔍📅
Here’s a short diagnosis of the current chart setup 🧠📈
📍EURUSD Market Update – FRGNT
Price has now entered our higher time frame order block, meaning long positions are off the table for now. ❌📈
We’re now looking for price to push deeper into the daily OB, advancing into the lower time frame order blocks nested within the HTF zone. 🔍
From here, we’re waiting for a clear break of structure to confirm intent — once we get that, we’ll look to ride price short with the trend. 📉🎯
Stay patient, stay disciplined — let the setup come to you.
Higher time frame order blocks have been identified — these are our patient points of interest 🎯🧭.
It’s crucial to wait for a confirmed break of structure 🧱✅ before forming a directional bias.
This keeps us disciplined and aligned with what price action is truly telling us.
📈 Risk Management Protocols
🔑 Core principles:
Max 1% risk per trade
Only execute at pre-identified levels
Use alerts, not emotion
Stick to your RR plan — minimum 1:2
🧠 You’re not paid for how many trades you take, you’re paid for how well you manage risk.
🧠 Weekly FRGNT Insight
"Trade what the market gives, not what your ego wants."
Stay mechanical. Stay focused. Let the probabilities work.
FX:EURUSD

GBPUSD – DAILY FORECAST Q3 | W33 | D13 | Y25📊 GBPUSD – DAILY FORECAST
Q3 | W33 | D13 | Y25
Daily Forecast 🔍📅
Here’s a short diagnosis of the current chart setup 🧠📈
📍Market Update – FRGNT Insight
Price has now entered our higher time frame daily order block, which means longs are becoming the less probable trade as we start watching for a potential rollover into shorts. 📉
However — keep in mind — there’s still room to the upside before any short setups become active. If price drops first into our long POIs, those long trades are still valid. 🎯
Stay sharp:
We’re looking for price to push higher into lower time frame OBs that sit within our higher time frame zone. That’s where confirmation will matter most. 🧠🕵️
Patience and precision — let price come to you.
Higher time frame order blocks have been identified — these are our patient points of interest 🎯🧭.
It’s crucial to wait for a confirmed break of structure 🧱✅ before forming a directional bias.
This keeps us disciplined and aligned with what price action is truly telling us.
📈 Risk Management Protocols
🔑 Core principles:
Max 1% risk per trade
Only execute at pre-identified levels
Use alerts, not emotion
Stick to your RR plan — minimum 1:2
🧠 You’re not paid for how many trades you take, you’re paid for how well you manage risk.
🧠 Weekly FRGNT Insight
"Trade what the market gives, not what your ego wants."
Stay mechanical. Stay focused. Let the probabilities work.
FX:GBPUSD

Lingrid | AUDUSD Swap Zone. Opportunity To Buy At Key ZoneFX:AUDUSD is consolidating inside a triangle pattern above 0.6485 support after rejecting from the 0.6540 resistance zone. Price is respecting the upward trendline while staying above the downward trendline break, hinting at potential upside. A push above 0.6500 could trigger a rally toward 0.6540, while a drop below 0.6485 would signal weakness.
📉 Key Levels
Buy trigger: Break above 0.6500
Buy zone: 0.6485–0.6500
Target: 0.6540
Invalidation: Close below 0.6485
💡 Risks
False breakouts from triangle consolidation
USD strength weighing on AUD
Risk sentiment shift in global markets
If this idea resonates with you or you have your own opinion, traders, hit the comments. I’m excited to read your thoughts!

Lingrid | EURUSD Possible Continuation Following CorrectionFX:EURUSD is consolidating within a triangle pattern after setting a higher high inside the upward channel. Price is holding above 1.15900, keeping bullish structure intact and eyeing the 1.17500 resistance zone. A break above the triangle’s upper boundary could trigger continuation toward this target. Failure to hold 1.15900 risks a drop back toward channel support near 1.14000.
📉 Key Levels
Buy trigger: Break above 1.1650
Buy zone: 1.15900–1.16100
Target: 1.17500
Invalidation: Close below 1.15400
💡 Risks
False breakout (FAKEY) could reverse gains quickly
USD strength from macro data could cap upside
Channel support breach may shift bias to bearish
If this idea resonates with you or you have your own opinion, traders, hit the comments. I’m excited to read your thoughts!

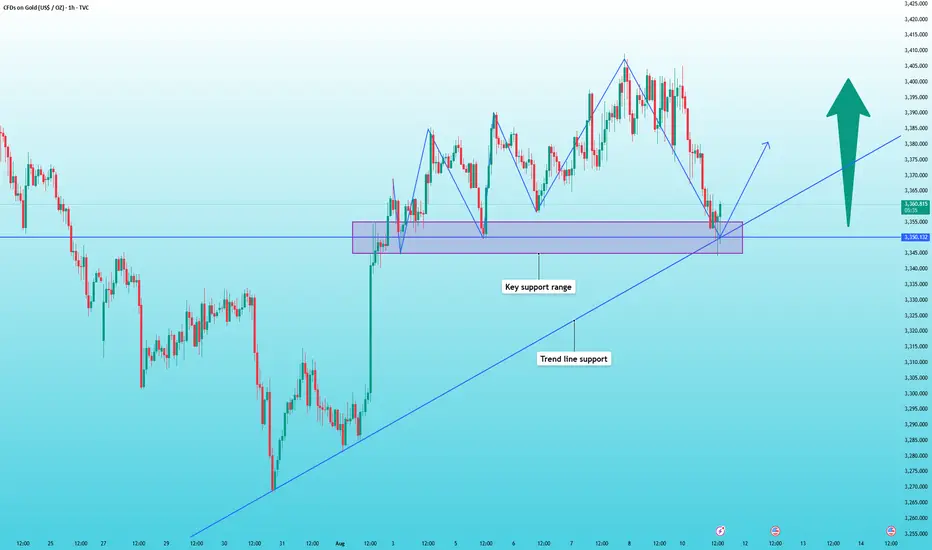
Gold support has been confirmed, buy with confidenceThe most anticipated outcome for the gold market this week is tomorrow's CPI data. After today's pullback during the Asian and European trading sessions, the current price has reached support levels. Before the CPI release, I believe volatility will be minimal, with a high probability of limited fluctuations.
The chart shows that 3350 is a key support level. After several hours of testing, 3350 has stabilized, so we can buy at this level, with the initial target being 3360, followed by 3380.
Lingrid | GOLD Weekly Price Outlook: Uptrend AccelerationOANDA:XAUUSD continues attracting significant buying interest as bulls successfully penetrated key resistance levels during the week. The market demonstrates resilience with bulls consistently stepping in during any price declines, suggesting an ongoing upward trajectory ahead.
The 4H timeframe shows gold trading within a defined channel, with price action completing an A-B-C corrective movement before breaking through the downward-sloping resistance trendline. The breach above the $3,370 level signals a potential shift in momentum, with the upward trendline now providing dynamic support. The resistance zone around $3,450-3,460 remains the next critical target.
The longer-term perspective highlights an ascending triangle pattern with multiple tests of the resistance band near $3,450. Gold price has risen approximately 40% from where they stood one year ago, reflecting extraordinary momentum. Each test of resistance has been met with renewed buying pressure, indicating strong underlying demand.
On the long-run price action suggest price could average $3,650 by Q4 2025, with potential for $4,000 by mid-2026. Central banks purchased over 400 metric tons in the first half of 2025, providing fundamental support beneath current technical developments.
The breakout above established resistance, combined with the ascending triangle formation and persistent institutional demand, suggests gold remains positioned for continued strength. We should monitor the $3,370 level as new support, with upside targets extending toward $3,500 and beyond.

EUR/USD Momentum Builds After Pennant BreakAfter reversing to retest the broken double top neckline and consolidating early last week, the probabilities shifted in favour of an upside continuation.
Following this consolidation under resistance, EUR/USD broke back above, hitting a local high at 1.17 on Tuesday. A pullback followed, forming a clean pennant pattern on the lower timeframes.
The Asian open today brought a decisive breakout above that pennant’s resistance, putting the bias once again to the upside.
Upside target : 1.18 zone
Invalidation: Only if price drops back below 1.16
Disclosure: I am part of TradeNation's Influencer program and receive a monthly fee for using their TradingView charts in my analyses and educational articles.

Lingrid | XRPUSDT Potential Upside Move From Support ZoneThe price perfectly fulfilled my previous idea . BINANCE:XRPUSDT is rebounding after a breakout from the consolidation zone and testing support around 2.897. The price is forming a bullish structure within a downward channel, aiming to reclaim the mid-level resistance. As long as it remains above 2.897, the bullish wave has room to target the descending channel’s upper boundary near 3.230. Momentum is gradually shifting toward upside continuation following the recent breakout and rebound.
📉 Key Levels
Buy trigger: Break and hold above 2.960
Buy zone: 2.850–2.960
Target: 3.230
Invalidation: Drop below 2.740
💡 Risks
Failure to hold 2.870 could invalidate the rebound
Overall channel remains bearish, posing structural resistance
Broader market sentiment may weigh on breakout momentum
If this idea resonates with you or you have your own opinion, traders, hit the comments. I’m excited to read your thoughts!

Lingrid | BNBUSDT Potential Bullish ContinuationThe price perfectly fulfilled my previous idea . BINANCE:BNBUSDT is rebounding from a higher low along the upward trendline, maintaining its position within the broader bullish channel. After the recent retracement from the peak at resistance, price has stabilized above 750, suggesting accumulation before a potential push higher. As long as it holds the trendline and the key 735–750 support zone, bulls are likely to target the 820 level next. This bullish continuation is fueled by a strong structure of higher lows and a healthy trend.
📉 Key Levels
Buy trigger: Close above 780
Buy zone: 735–750
Target: 820
Invalidation: Break below 730
💡 Risks
Failure to hold 735 support may trigger deeper pullback toward 700
Rejection at 780 could result in extended range-bound movement
Resistance near 820 may cap gains without strong momentum
If this idea resonates with you or you have your own opinion, traders, hit the comments. I’m excited to read your thoughts!

Lingrid | XRPUSDT Potential Trend ContinuationThe price perfectly fulfilled my previous idea . BINANCE:XRPUSDT is holding above the 3.1500 support zone after a clean rebound from the ascending trendline, signaling a bullish continuation setup. The structure remains intact with higher lows, and the next major objective lies in the 3.8000 resistance zone. A breakout above 3.4000 could open the way for accelerated upside movement. Trend bias remains bullish while price holds above key support.
📉 Key Levels
Buy trigger: Break above 3.4000
Buy zone: 3.1000–3.2000
Target: 3.8000
Invalidation: Drop below 3.000
💡 Risks
A breakdown under 3.0000 could shift trend to bearish
Resistance near 3.8000 may cause sharp rejection
Broader market weakness could limit upside
If this idea resonates with you or you have your own opinion, traders, hit the comments. I’m excited to read your thoughts!

Lingrid | GOLD Short-Term Correction From Psychological LevelOANDA:XAUUSD is currently retesting the broken triangle structure from below, having rebounded from the ascending support zone. The price is approaching a confluence near 3,400–3410, where prior breakdown and resistance meet. If this level holds as resistance, the setup favors a bearish continuation toward 3,340 and possibly deeper. The broader structure shows lower highs and increasing rejection pressure below the resistance zone.
📉 Key Levels
Sell trigger: 3,400 rejection
Sell zone: 3,398.660–3,410
Target: 3,340
Invalidation: Break and hold above 3,410
💡 Risks
Momentum from recent rebound could challenge resistance
A higher low formation could tilt sentiment bullish
External factors (Fed, inflation data) may inject volatility beyond the range
If this idea resonates with you or you have your own opinion, traders, hit the comments. I’m excited to read your thoughts!

Lingrid | EURJPY Trendline Breakout. Long From SupportThe price perfectly fulfilled my previous idea . FX:EURJPY is consolidating inside a tight range between 171.411 support and the downward trendline after rebounding from a higher low. Price is testing the upper boundary of this range, and a breakout could signal continuation toward the 172.800 resistance zone. Holding above 171.411 keeps the bullish bias intact, while rejection from the trendline could bring another retest of support. Momentum favors buyers if the breakout comes with strong volume.
📉 Key Levels
Buy trigger: Break and hold above 171.775
Buy zone: 171.411–171.775
Target: 172.800
Invalidation: Drop below 171.411
💡 Risks
Failure to break the downward trendline could spark a deeper pullback
Rejection at 172.800 could trigger range-bound movement
Weak euro sentiment from macroeconomic data may weigh on upside potential
If this idea resonates with you or you have your own opinion, traders, hit the comments. I’m excited to read your thoughts!

Lingrid | TONUSDT Continues to Move SidewaysThe price perfectly fulfilled my previous idea . OKX:TONUSDT is trading above the 3.20 support after a breakout from the range structure, with momentum building for a retest of the 3.850 resistance zone. The higher low formation supports a bullish continuation setup, and the recent rejection of the downward trendline reinforces buying interest. As long as price holds above 3.193, the market favors an upward move targeting the next resistance. A confirmed break above 3.850 would open the door for further gains toward the 4.00 zone.
📉 Key Levels
Buy trigger: Break and hold above 3.39
Buy zone: 3.20 –3.377
Target: 3.850
Invalidation: Drop below 3.00
💡 Risks
Failure to break above the downward trendline may trigger a pullback
A strong rejection at 3.850 could lead to a deeper correction
Market sentiment shift from BTC weakness could limit upside
If this idea resonates with you or you have your own opinion, traders, hit the comments. I’m excited to read your thoughts!
