XAG/USDSilver Short trade. A very risky trade, but i guess two gaps in comex silver is not normal. Hence we look for a short trade in silver with strict sl of 95 to 95.1$.
Entry- 93-93.5
SL- 95.1 STRICT.
Target- Todays low that is the gap, 2nd target is for 88 dollars.
Disclaimer- This is just for educational purpose.
JAI SHREE RAM.
Silver

Coeur Mining (CDE) Elliott Wave Outlook - Count 1 Alt1 (4H)This is an alternate outlook which sees that NYSE:CDE is already in the red wave 3 which again is approaching a typical wave 3 target at the 1.618 extension. I prefer the red wave 2 as a running flat on this outlook compared to the expanding leading diagonal count previously used, and with silver approaching $100, this outlook allows for the completion of this 5 wave sequence quicker than the previously posted 4H outlook.
That last comment suggest I have one eye on a reaction at $100 silver (I suppose I can’t rule it out also Gold approaching $5K), and that I’m preparing for a larger pull back. Well once I anchor red wave 5, yellow (5), and cyan 3 or C this does suggest a larger pullback. I am going to review this count based on my higher timeframe outlook on silver, but looking at CDE in isolation, I think this leg potentially completes a 5 wave sequence higher and the potential for pull back still exists. A pull back that I may not want to hold all of my current holding through, so may trim a little more from CDE and other miners based on correlation as this wave progresses.
The situation is of course fluid, and something could happen tomorrow that changes that sentiment.

SILVER and the ETF'sI reckon it's now time for Silver to relax. It has been on amazing run but fibonacci levels have always been the ring master. The ring master is now likely saying enough is enough.

APGO - Following Silver’s Footsteps?Markets don’t move in isolation.
They rhyme… especially when capital rotates from the metal to the miners .
Over the past few months, Silver quietly broke out of a long-term accumulation range…
And once it did, price exploded higher with speed and conviction.🚀
Now zoom out on Apollo Silver TSXV:APGO and the structure looks uncomfortably familiar 👀
📊 Technical Analysis
After a brutal markdown phase that lasted more than a decade, APGO spent years building a clear accumulation base , following Silver’s broader long-term path.
That base is now being tested:
• The upper accumulation zone around $5.7 is acting as a key decision level
• Price is transitioning from accumulation into early markup behavior
• The structure mirrors Silver’s breakout phase almost step by step
Just like Silver:
– Long accumulation
– Clean breakout
– Brief consolidation
– Then acceleration
If APGO confirms breakout above the accumulation phase, the technical roadmap opens toward a full markup phase , with much higher levels coming into play.
This is no longer about catching bottoms; it’s about recognizing phase shifts.📉📈
🌍 Bigger Picture - Why Silver, Why Apollo?
Silver isn’t just a precious metal anymore; it’s a strategic industrial input.
Apollo Silver controls one of the largest undeveloped silver resources in the U.S., with over 125M ounces measured & indicated and 57M ounces inferred at the Calico project. 🗻
🥈Silver demand is accelerating across:
AI data centers, solar energy, 5G infrastructure, and defense systems, all while supply remains constrained.
On top of that, Apollo’s exposure to barite and zinc , both classified as critical minerals, adds optionality that most silver juniors simply don’t have.
In a world pushing for U.S. mineral independence, domestic silver assets are no longer optional… they’re strategic.🔎
📌 Bottom Line
Silver already made its move.
APGO looks like it’s next in line.
Structure is shifting.
Accumulation is behind us.
And if history rhymes, this could be the early stages of a much larger markup cycle.
⚠️ Always do your own research and speak with your financial advisor before investing.
Disclaimer: I have been paid $900 by CDMG, funded by Apollo Silver Corp., to disseminate this message.
📚 Stick to your trading plan, entry, risk management, and execution.
All strategies are good; if managed properly.
~ Richard Nasr

Silver M30 HTF Liquidity Sweep and Bullish Continuation Setup📝 Description
TVC:SILVER on the M30 timeframe remains within a broader bullish structure after completing a corrective pullback into a higher-timeframe demand area. Price has respected the H1 order block and is now consolidating above value, suggesting preparation for another expansion leg to the upside.
________________________________________
📈 Signal / Analysis
Primary Bias: Bullish while price holds above the H1 order block and recent higher low
Preferred Setup:
• Entry: 94.246
• Stop Loss: Below 93.606
• TP1: 95.240
• TP2: 95.871
• TP3: 96.858 (HTF liquidity / trend continuation target)
________________________________________
🎯 ICT & SMC Notes
• Market is holding above a valid H1 order block
• Recent sell-side liquidity has already been swept
• Upside targets align with buy-side liquidity and trendline expansion
________________________________________
🧩 Summary
As long as price holds above the H1 demand zone, Silver is expected to continue its bullish rotation toward higher buy-side liquidity levels. Pullbacks into value are considered continuation opportunities rather than reversals.
________________________________________
🌍 Fundamental Notes / Sentiment
Precious metals remain supported under mixed risk sentiment and hedging flows. Any renewed weakness in the US dollar or increase in macro uncertainty may further accelerate upside momentum in Silver.
________________________________________
⚠️ Risk Disclosure
Trading involves substantial risk and may result in capital loss. This analysis is for educational purposes only and does not constitute financial advice. Always apply proper risk management, predefined stop-loss levels, and disciplined position sizing aligned with your trading plan.

Gold near $5,000 — this is where bull markets turn parabolic🚨 As we are closing in 5,000 USD in gold prices, the bull market is entering its parabolic stage. Let’s review the current bull market stats + historic bull markets in more detail. Let’s go.
________________________________________
✅ Executive Summary — Top 10 Key Takeaways
1.🟡 Gold just printed a new ATH: $4,887.82/oz (Jan 21, 2026) and is hovering around $4,885.
2.🧠 From the 2016 low (~$1,080) to today: ~+352% (≈ 4.5×).
3.🎯 $5,000 is the magnet level: Reuters notes traders are watching/holding for the $5,000 psychological threshold.
4.🏦 This cycle’s signature: central banks remain the anchor buyer — 1,045t added in 2024 (3rd straight 1,000t+ year).
5.💧 ETFs are back: physically backed gold ETFs saw record-setting demand bursts
6.🧨 The 2026 catalyst (right now): fresh safe-haven demand tied to elevated geopolitical/trade stress.
7.🧱 Structure matters: the multi-year base/breakout thesis (2024) has evolved into an “ATH staircase” into 2026.
8.🥈 Silver is also in a historic move: it hit an all-time high around $95.87
9.📊 Relative performance: S&P 500 finished 2025 up ~16.39%, while gold’s 2025 run was widely described as exceptional
10.🔥 Upside framing is now mainstream: some strategists explicitly model paths to $7,500/oz in 2026
________________________________________
🔥 What’s Different About This Bull Market 2026
•🏦 Central-bank dominance is the backbone
•💸 ETF flows returned in size, adding a powerful Western liquidity bid.
•📉 Rates/real-yield expectations still matter, but now gold also trades as a trust/sovereign-risk hedge during political and trade shocks.
________________________________________
🏆 Historic Gold Bull Markets — Timeline & Stats
1) 1968–1980 “Super Bull”
•Start/End: ~$35 → $850
•Gain: ~2,330%
•Drivers: End of Bretton Woods, oil shocks, double-digit inflation, geopolitics
•Drawdown: ~–45% before the final blow-off run
2) 1999–2011/12
•Start/Peak: ~$252 → ~$1,920
•Gain: ~650%
•Drivers: Commodities supercycle, EM demand, USD weakness, GFC safe-haven bid
3) 2016/2018–Present The “CB-Led” Cycle
•Cycle low (key anchor): ~$1,080 (2016)
•Latest / ATH: ~$4,885 spot; ATH $4,887.82 (Jan 21, 2026)
•Gain since 2016 low: ~+352%
•Primary drivers:
o🏦 Central banks: 1,045t added in 2024 (3rd straight 1,000t+ year)
o💧 ETF inflows: major re-acceleration, including record Q3 2025
o🌍 Geopolitics/trade shocks: renewed safe-haven urgency into Jan 2026
________________________________________
📊 At-A-Glance Comparison
Metric 1968–80 Super Bull 1999–2012 2016–2026 Current
🚀 Total Gain ~2,330% ~650% ~+352% (from ~$1,080)
⏲️ Duration 12 yrs 13 yrs ~10 yrs (ongoing)
💔 Max Drawdown ~–45% ~–30% ~–20%ish (not a deep secular washout so far)
🏦 Main Buyer Retail/Europe Funds/EM Central banks + ETFs/investors
🏛️ Pattern Secular parabolic Cyclical ramps Breakout → staircase ATHs → $5k magnet
________________________________________
📈 Top 10 Stats of the Current Bull Jan 2026 Edition
1.🟡 Price / ATH: $4,885 spot; ATH $4,887.82
2.🧮 Bull-cycle gain (2016 low): ~+352% from ~$1,080
3.🧲 Next magnet: $5,000 psychological level
4.🏦 Central banks: +1,045t in 2024 (3rd straight 1,000t+ year)
5.💧 ETF surge: Q3 2025 logged the strongest quarter on record (WGC)
6.🌍 2026 impulse: safe-haven bid tied to geopolitical/trade escalation
7.🥈 Silver confirmation: record ~$95.87 (Jan 20, 2026)
8.🧱 Demand pulse: WGC-linked commentary highlighted record-strong quarterly demand in 2025 (investment + CBs)
9.📊 Equity comparison anchor: S&P 500 2025: +16.39% (gold’s run continued to new records in Jan 2026)
10.🎯 Street framing: credible scenario work explicitly targets $5,000/oz as a 2026 outcome case
________________________________________
🎯 Strategy Ideas 2026+
Core simple + durable
•🧱 Hold/add on pullbacks via allocated physical, high-liquidity ETFs, and quality royalty/producer names.
•⚖️ Size it like insurance: you want enough to matter, not enough to force emotional selling.
Satellite torque, optional
•🥈 Silver (higher beta) + select miners only if you accept volatility (silver just proved it can go vertical).
Risk management
•🧯 Define your trim rules before the chart goes vertical:
otrim a slice into euphoric spikes, keep the core
oavoid leverage if you can’t stomach violent swings
________________________________________
🧪 Reality Check — What Could Cool This Bull?
•💵 Sustained USD strength + higher real yields
•🏦 Meaningful slowdown in official-sector buying
•📉 Big reversal in safe-haven demand if geopolitical/trade risk de-escalates fast
________________________________________
🔚 Updated Key Takeaways
•🏦 Central banks + ETFs are the twin pillars of this cycle.
•🟡 Gold is printing fresh records into Jan 2026 and $5,000 is the next psychological battleground.
•🧠 From $1,080 (2016) to ~$4,885, we’re up ~+352% — and the tape is behaving like a late-stage trend.

OIL consolidating. OIL is moving in the range. Will wait patiently to either SELL at RESISTANCE or BUY at SUPPORT.

Fundamental Note: SILVER 19 Jan 2026Silver is back near record territory as geopolitics re-priced sharply on the Greenland standoff and the rising risk of a US–EU trade conflict. Over the weekend, President Trump threatened fresh tariffs on multiple European countries unless the US is allowed to buy Greenland—reviving “trade-war” fears and pushing markets into a risk-off tone. The key short-term transmission to XAG is two-sided: safe-haven flows support precious metals, but tariff escalation also raises growth-risk for Europe and global trade, which can later pressure silver’s industrial leg. For now, the immediate impulse is bullish because the dollar weakened and volatility jumped as investors priced higher political-risk premia around the US and transatlantic relations. Headlines suggest Europe is preparing countermeasures, making the “retaliation loop” a live risk into February and beyond. The tariff shock is directly feeding safe-haven demand, keeping XAG supported above ~$92.50, while industrial demand narratives (solar/EV/AI buildout) remain a longer-term tailwind. With US cash markets closed for MLK Day, liquidity is thinner—so price can overshoot quickly on any escalation or de-escalation headline.
Bottom line: geopolitics (Greenland + trade-war risk) is the dominant driver today; silver stays bid while the tariff story intensifies, but whipsaw risk remains high given silver’s volatility.
🟢 Bullish factors:
1. Greenland tensions + tariff threats revive safe-haven demand for metals.
2. USD weakness on rising US political-risk premium supports USD-priced commodities.
3. Industrial-demand backdrop (solar/EV/AI) still supports the medium-term story.
4. Momentum/record-high narrative keeps speculative interest elevated.
🔴 Bearish factors:
1. A full US–EU trade conflict can hit growth expectations and later weigh on industrial metals demand.
2. Any calming headline (deal-talks / tariff walk-back) can unwind the risk-premium fast.
3. Rebound in US yields / firmer USD would be a headwind for XAG.
🎯 Expected targets: Bullish bias while holding 92.00–91.00, with upside toward 94.00–96.00 on continued Greenland/trade escalation. A clean break above 96.00 opens 98.00–100.00 next. If headlines de-escalate and risk appetite rebounds, a pullback toward 90.00–88.50 becomes likely.

Stop!Loss|Market View: NZDUSD🙌 Stop!Loss team welcomes you❗️
In this post, we're going to talk about the near-term outlook for the NZDUSD currency pair☝️
Potential trade setup:
🔔Entry level: 0.58563
💰TP: 0.59196
⛔️SL: 0.58157
"Market View" - a brief analysis of trading instruments, covering the most important aspects of the FOREX market.
👇 In the comments 👇 you can type the trading instrument you'd like to analyze, and we'll talk about it in our next posts.
💬 Description: The price has aggressively approached the resistance area near 0.58500, suggesting a rebound, as it did last time. However, if buyers continue to hold the price near this resistance, we can expect further growth towards 0.59000 - 0.59500. If this doesn't happen, we'll likely see a downward movement towards the support area at 0.57440 in the near future.
Thanks for your support 🚀
Profits for all ✅

SILVER FREE SIGNAL|LONG|
✅SILVER holds above a refined demand block after bullish displacement, showing strong acceptance. Expect continuation higher as buy-side liquidity builds toward the premium target.
—————————
Entry: 94.11$
Stop Loss: 92.33$
Take Profit: 96.65$
Time Frame: 2H
—————————
LONG🚀
✅Like and subscribe to never miss a new idea!✅

Sell the US?The “sell America” trade is back with investors cutting exposure to US assets and pricing in a higher risk premium on American investments.
US bonds sold off hard. In FX, the euro surged against the US dollar. Safe havens were the main beneficiaries. Gold and silver pushed to fresh highs, and the former was on track for its biggest one day gain since October.
The move followed President Donald Trump’s threat to impose 10% tariffs on eight European countries, tied to his push to take over Greenland. In response, European officials are considering counter tariffs. Additionally, The Goble And Mail is reporting that the Canadian Armed Forces have modelled a US invasion.

Silver Forming an Ascending TriangleIn my previous analysis I thought Silver could possibly be forming a bull flag, but since the passage of time progressed I think it is forming an ascending triangle instead. Which is still bullish. Target price is approximately $95. Not financial advice, just a pattern I see potentially forming

Silver After multi year Breakout Now Silver Trading at Resistance zone
99$ /112$ seen big hurdle
If not closing above we seen Some profit booking or consolidation on this zone.
If not wc above this level then Down side 88/82/75$+ possible


Silver = to the moon??? September 03, 2025Who’s Loading Up:
A top dog at Pan American Silver Corp., a heavyweight in North American silver digs, just scooped up a hefty chunk of shares.
Deal Size: This exec grabbed 50,000 shares at $22.50 a pop on August 28, 2025, dropping $1.125 million—talk about putting skin in the game!
Company Lowdown
Pan American Silver Corp. runs 10 mines across the Americas, packing 468 million ounces of silver and 6.7 million ounces of gold. Based out of Vancouver, they’ve got cash flowing like a river, fueling big bets like La Colorada Skarn and Escobal.
Sector Vibes:
• The Silver Institute’s calling for a fifth straight supply crunch in 2025, with photovoltaics and AI tech demand hitting all-time highs.
• Tariff threats, green energy boom, and a possible Fed rate cut in September 2025 could send silver soaring.
Big Funds Jumping In
Last quarter (June–August 2025), heavy hitters like Sprott Asset Management (+8% in Pan American), BlackRock Inc. (+5% in iShares Silver Trust), and Invesco Ltd. (+6% in VanEck Silver Miners ETF) piled into silver.
Buzz on X says Saudi Central Bank’s dipping its toes into silver via iShares Silver Trust (SLV), ditching its gold-only playbook.
London Vaults Drying Up
The LBMA’s silver stash is under siege from a supply deficit. With 150 million ounces short in 2024, the Silver Institute hints reserves might shrink 5–10% yearly if demand keeps raging, setting the stage for a price explosion.
1979 Boom & 2025–2026 Wild Cards
1979 Flashback: The Hunt Brothers’ silver grab, plus inflation and oil chaos, rocketed silver from $6 to $50/oz (+700%). Gold jumped from $300 to $850/oz on similar vibes.
2025–2026 Triggers:
Inflation’s sticky above 3%, the USD’s wobbling from tariffs, and a Fed cut looms in September 2025. Watch for U.S.-China trade wars, Middle East flare-ups, or a BRICS metals exchange—any could ignite a 1979-style silver rocket if deficits worsen.
Price Targets:
Short-Term (3 months): $60.00 (+46.9%)
Mid-Term (6–12 months): $120.00 (+193.7%)
Long-Term (18–24 months): $240.00 (+487.5%)
🤔🤔🤔🤔🤔🤔🤔🤔

SILVER (XAGUSD): Bullish Continuation
Silver will likely rise more, following
a confirmed bullish break of structure on a 4H time frame.
The next strong resistance is 97.0
❤️Please, support my work with like, thank you!❤️
I am part of Trade Nation's Influencer program and receive a monthly fee for using their TradingView charts in my analysis.

GOLD Weekly Levels: Buy/Hold 4270/4300 Target 4500/4633 🔱 GOLD WEEKLY SNAPSHOT — EXECUTIVE SUMMARY
✨ Gold in wave-4 accumulation after extended impulse
🟡 Primary impulse complete: 3910 → 4500 (H2/H4)
🔄 Current pullback: 4500 → 4268 = corrective, not reversal
🧱 Accumulation zone: 4300–4268 (buy dips only)
📈 Trend remains bullish while above 4210
🚀 Wave-5 target: 4630–4650 price discovery zone
⏳ Expect consolidation before expansion
⚠️ Invalidation: acceptance below 4210
🎯 Strategy: buy & hold dips, don’t chase highs
🏦 Final leg likely followed by larger consolidation
🗳️ Gold Weekly Scenarios — What’s Your Play?
Which path do you have for XAUUSD next week?
🅰️ Hold 4,27x–4,30x → continuation toward 4,500+ / wave-5 extension
🅱️ Dip into 4,25x–4,26x, then rotate higher (accumulation before breakout)
🅲 Acceptance > 4,380 → squeeze confirms upside continuation
🅳 Your level: drop one price you’re watching most next week
🔥 GOLD WEEKLY SNAPSHOT — BY PROJECTSYNDICATE
🏆 Swing High / Swing Low
$4,500 → $4,268 — controlled pullback from the wave-3 peak following an extended impulse. The decline into the $4,26x area shows overlap, compression, and reduced momentum, consistent with a wave-4 corrective phase rather than trend reversal. Weekly structure remains constructive while price holds above key invalidation.
📈 Trend
Higher-timeframe:
Primary trend remains bullish following a completed 5-wave impulse on H2/H4, with wave-3 extension from $4,000 → $4,500 confirming strong trend participation.
Tactical:
Current price action fits a wave-4 accumulation / consolidation phase:
Shallow pullback relative to wave-3
Overlapping ranges
Compression above prior breakout structure
As long as price holds above $4,210, the tape favors continuation into wave-5 rather than deeper correction.
🛡 Supports – Accumulation / Buy-Side Zones
$4,300–$4,270 🟢 Accumulation zone
Primary wave-4 basing area. This zone represents:
Prior minor breakout structure
Overlapping corrective price action
Area of strongest dip-buying interest
Preferred zone for buy-the-dip positioning, not aggressive chasing.
$4,250–$4,230:
Secondary support shelf and intraday defense zone. Acceptance below this area would increase corrective risk but does not yet invalidate the bullish structure.
$4,210 🔑 Structural invalidation
Loss and acceptance below $4,210 invalidates the wave-5 continuation thesis and signals a deeper corrective phase instead of immediate trend extension.
🚧 Resistances – Upside Objectives / Expansion Targets
$4,380–$4,400:
First upside resistance and near-term liquidity magnet. A clean reclaim and hold above this zone would confirm wave-4 completion.
$4,500:
Prior high and breakout trigger. Acceptance above $4,500 opens the door for wave-5 price discovery.
$4,630–$4,650 🎯 Wave-5 target zone
Projected wave-5 expansion objective based on prior impulse proportions. This zone represents the final upside leg of the current impulse sequence before a larger-degree consolidation becomes likely.
🧭 Bias Next Week
Primary bias: buy dips within the accumulation zone, do not chase highs.
The market structure favors:
Continued consolidation early week
Holding above $4,250–$4,210
Breakout attempt toward prior highs later in the week
As long as price remains above $4,210, upside continuation remains the dominant scenario.
⚖️ Base Case Scenario
Early week:
Price continues to range within $4,270–$4,330, maintaining compression and absorbing supply from late longs.
Mid-week:
Sustained holding above the accumulation zone invites renewed upside momentum toward $4,380–$4,400.
Expansion phase:
Acceptance above $4,500 triggers wave-5 continuation toward $4,630+, with momentum-driven price discovery.
🚀 Breakout / Invalidation Triggers
Bullish confirmation:
Daily acceptance above $4,500 confirms wave-5 in progress and shifts focus to higher expansion targets.
Bullish invalidation:
A clean break and acceptance below $4,210 invalidates the wave-5 thesis and signals a deeper corrective structure instead of continuation.
🔓 Bull / Bear Structural Lines
Bull structure line:
Above $4,210 — impulse structure intact, dips are corrective and buyable.
Bear expansion line:
Below $4,210 — bullish continuation delayed; opens scope for a deeper retracement toward lower demand zones before any renewed upside.
🧭 Recommended Strategy — Buy & Hold Dips (Accumulation Phase)
⚠️ Illustrative framework, not financial advice. Manage risk according to your own rules.
1️⃣ Primary Strategy — Accumulate Pullbacks
Focus on $4,300–$4,270 for staged long exposure
Avoid chasing strength near highs
Use acceptance and structure confirmation for entries
Risk management / invalidation:
Tactical invalidation: sustained acceptance below $4,210
Upside objectives:
First objective: $4,380–$4,400
Breakout objective: $4,500
Expansion target: $4,630–$4,650 (wave-5 projection)

Gold Weekly Levels: Break above 4630 → 4720/4725🔱 GOLD WEEKLY SNAPSHOT — EXECUTIVE SUMMARY (NEW WEEK | JAN 2026)
✨ Bullish bias stays active for the week — but the upside is capped
🧲 Fresh overhead sell-side liquidity: 4630–4635 = first magnet
🟣 Max overbought + January ceiling: 4720–4725
📌 Expectation: limited upside from Point C in January
🧲 Fresh buy-side liquidity : 4500–4510 = preferred reload area
🛡 Bull structure invalidation: 4450 — break below invalidates outlook
🎯 Bull targets: first 4630–4635 → on valid breakout, ext 4720–4725
🏦 Core play: accumulate dips 4500–4510 reduce risk into 4630–4635
________________________________________
🗳️ Gold Weekly Scenarios — What’s Your Play?
Which path do you have for XAUUSD next week?
🅰️ Hold 4500–4510 → accumulate zone performs → rotation into 4630–4635
🅱️ Early sweep below 4510 → reclaim 4500–4510 → squeeze into 4630–4635
🅲 Direct drive into 4630–4635 → reaction/rejection → dip back toward 4500–4510 for reload
🅳 Break below 4450 → bullish outlook invalidated → downside opens further (risk-off shift)
Your key levels: 4500–4510 (buy-side) / 4450 (invalidation) / 4630–4635 (sell-side) / 4720–4725 (max-out)
________________________________________
🔥 GOLD WEEKLY SNAPSHOT — BY PROJECTSYNDICATE
🏆 Swing Structure
Gold remains in a bull-controlled tape for the new week, with the plan centered around dip accumulation + controlled upside targets:
• 4500–4510 is the fresh buy-side liquidity zone and the preferred area to build/scale long exposure.
• Bulls’ first major objective is 4630–4635, which is fresh sell-side liquidity — expect profit-taking, supply, and reaction risk there.
• If price breaks and holds above 4630–4635 (valid breakout), the market can extend into 4720–4725, defined as:
o max overbought zone
o AB swing 1.62 extension
o January 2026 max-out ceiling (expectation: limited upside beyond this in January)
• 4450 is the line in the sand: a break below invalidates the bullish outlook and exposes broader downside risk.
________________________________________
📈 Trend
Higher-timeframe bias: Bullish (new week)
Tactical: Two-phase week
Phase 1: Dip Accumulation & Rotation Higher
• Bulls ideally defend the 4500–4510 zone
• Accumulation/reloading happens on dips
• Rotation targets the overhead liquidity magnet 4630–4635
Phase 2: Breakout Decision at Supply
• 4630–4635 becomes the decision zone
• If rejected: expect rotation lower / reload behavior (watch 4500–4510 again)
• If valid breakout: extension unlocks toward 4720–4725 (January max-out zone)
________________________________________
🛡 Supports — Demand / Buy-Side Liquidity Zones
✅ 4500–4510 (Fresh buy-side liquidity)
• Primary dip-buy / accumulation zone this week
• Expect strongest bid response / “reload” behavior here
⚠️ 4450 (Bullish invalidation level)
• Break below = bullish thesis invalidated
• Opens risk for further downside continuation (structure shifts)
________________________________________
🚧 Resistances — Upside Objectives / Liquidity Zones
🎯 4630–4635 (Fresh sell-side liquidity)
• Primary bull target for the week
• High probability reaction zone (scale out / reduce risk)
🚀 4720–4725 (Max overbought + AB 1.62 extension | Jan 2026 max-out)
• Only in play after a valid breakout beyond 4630–4635
• Treated as January’s ceiling — upside expected to be limited from Point C this month
• High-risk zone for chasing longs; prioritize execution + protection
________________________________________
🧭 Bias Next Week
Primary bias: Bullish
What you’re trading this week:
• Bulls: accumulate dips 4500–4510 → target 4630–4635 → breakout continuation toward 4720–4725
• Bears: look for rejection signals at 4630–4635 and especially 4720–4725 (January max-out)
________________________________________
⚖️ Base Case Scenario (Most likely path)
Early week: dips are bought / accumulation near 4500–4510
Mid-week: rotation higher toward 4630–4635
Late week: decision at 4630–4635
• If acceptance occurs → extension attempt toward 4720–4725
• If rejection occurs → pullback for reload toward 4500–4510
________________________________________
🚀 Breakout / Invalidation Triggers
✅ Bullish continuation trigger
• Strong push into 4630–4635 and clean breakout/acceptance above it
• Opens the path to 4720–4725
⚠️ Supply reaction trigger
• Tap/sweep into 4630–4635 + rejection behavior (stall/wicks/displacement down)
• Signals pullback risk back toward 4500–4510
🛑 Bullish invalidation trigger
• Break below 4450
• Bullish outlook invalidated; downside opens further
________________________________________
🔓 Bull / Bear Structural Lines (Updated)
🟢 Bull control zone: Above 4500–4510 (dip-buy regime intact)
🟡 Transition / decision zone: 4630–4635
🟣 January max-out zone: 4720–4725
🔴 Invalidation line: Below 4450
________________________________________
🧭 Recommended Strategy Framework (Updated)
1️⃣ Primary Play — Accumulate the dips (with structure)
Idea: bullish week → build exposure where liquidity is fresh
• Scale longs near 4500–4510
• Prefer confirmation via stabilization/reclaim behavior
• Keep risk defined with 4450 as the structural line
2️⃣ Profit-taking Plan — Sell into the first magnet
• Scale out into 4630–4635 (fresh sell-side liquidity)
• Tighten risk aggressively as price enters the zone
• Assume reaction risk increases near 4635
3️⃣ Breakout Play — Only if price proves acceptance
• If 4630–4635 breaks and holds → target 4720–4725
• Treat 4720–4725 as January max-out: reduce risk quickly, don’t overstay
________________________________________
✅ Weekly Levels
• 4720–4725: January max-out / max overbought / AB 1.62 extension
• 4630–4635: fresh sell-side liquidity (primary bull target / reaction zone)
• 4500–4510: fresh buy-side liquidity (dip accumulation zone)
• 4450: bullish invalidation (break below flips the outlook)

Stop!Loss|Market View: GOLD🙌 Stop!Loss team welcomes you❗️
In this post, we're going to talk about the near-term outlook for GOLD ☝️
Potential trade setup:
🔔Entry level: 4623.726
💰TP: 4527.035
⛔️SL: 4712.744
"Market View" - a brief analysis of trading instruments, covering the most important aspects of the FOREX market.
👇 In the comments 👇 you can type the trading instrument you'd like to analyze, and we'll talk about it in our next posts.
💬 Description: Short-term additional strengthening of metals is expected until mid-week, with a likely correction expected closer to the end of today, but only if the price approaches the last open gap. Only in this situation should selling be considered, with a target of 4500. However, 4400 and 4200 are also considered as additional targets.
Thanks for your support 🚀
Profits for all ✅

Gold, Silver, Copper Futures Positionings ComparedUsing the latest weekly Commitment of Traders (COT) data, I look at how futures traders are positioned in gold, silver and copper. Together, they tell three very different stories — one that looks undervalued, another that appears overextended, and a third that makes me nervous.
MS.

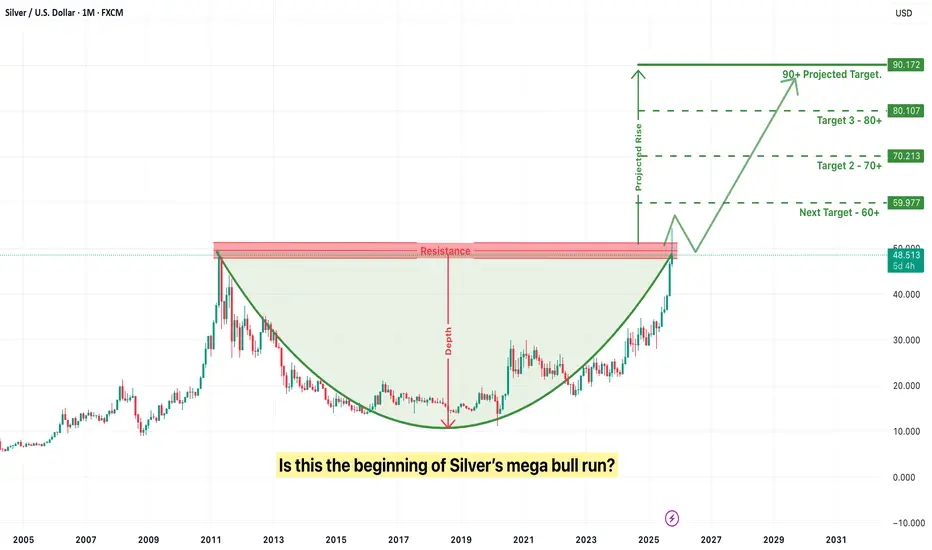
Is this the beginning of Silver’s mega bull run?For years silver has been seen as gold’s lesser companion — always important, but never truly leading. However, the world is now entering a new economic and technological era where silver is quietly transitioning from a secondary asset into a strategic metal of the future. What makes silver unique is that it is both an industrial metal and a monetary asset at the same time. Gold is used primarily for wealth protection, but silver has dual demand — it rises when technology adoption accelerates and it rises again when currencies weaken and investors seek a safe store of value. This rare combination places silver in a category of its own.
The most powerful driver behind silver’s future potential is the global energy and technology transformation. The world is rapidly shifting toward electric mobility, renewable power, high-speed communication networks and AI-scale computing. Every one of these megatrends directly increases silver consumption. Electric vehicles require significantly more silver than traditional cars because of their circuitry and conductivity needs. Solar panels have already become the single-largest industrial consumer of silver worldwide, and demand is projected to rise sharply due to green energy mandates and government policies. In the coming decade, silver will also be crucial to 5G infrastructure, robotics, space technology and medical-grade electronics. Simply put, modern technology cannot scale without silver.
While demand is rising rapidly, supply is structurally constrained. Most silver does not come from dedicated silver mines but as a by-product of mining other metals such as zinc, lead and copper. This means supply cannot simply increase when silver prices rise. If industrial base-metals mining slows, silver production automatically contracts. At the same time investment demand is rising, which creates a long-term deficit. This mismatch between rising demand and limited supply is exactly what leads to a major asset re-rating over time.
Another major factor supporting silver is the global macroeconomic cycle. Currencies across the world are losing value due to continuous money printing, rising debt and inflationary pressure. Investors are increasingly looking for hard assets that preserve purchasing power. Gold is traditionally the first choice, but it is already well accumulated and priced. Silver, being more affordable and under-owned, becomes the “accessible hedge” for the masses. Each time inflationary fears rise or fiat confidence falls, silver sees renewed investment flow.
Technically as well, silver is at a critical long-term juncture. The price structure is completing a multi-decade cup-and-handle pattern, which is one of the strongest bullish technical formations in commodity markets. Such large time-frame technical setups rarely appear, and when they do, their breakouts typically fuel multi-year trends rather than short rallies. A sustained breakout in silver has the potential to trigger a supercycle where price appreciation becomes exponential rather than linear.
However, while the long-term potential is extremely strong, investors should be aware of certain risks. Silver is far more volatile than gold and is known for sharp price swings in short timeframes. Breakouts can also produce temporary fake moves, trapping impatient investors who enter at the top and exit at the first correction. Because silver is tied to industrial demand, a short-term slowdown in the global economy can temporarily affect prices even when the long-term thesis remains intact. Another caution is the difference between physical silver and paper silver. Physical markets reflect real-world scarcity, while paper silver markets (ETFs, futures) can sometimes be suppressed by large institutional trading, creating short-term price distortions that do not reflect underlying fundamentals.
The key to winning with silver is adopting a patient, long-term perspective instead of a speculative trading mindset. Accumulation through systematic or staggered buying reduces timing risk and prevents emotional decision-making. A blend of physical holding for long-term security and digital exposure for liquidity creates the most efficient structure. Silver has historically rewarded patience and conviction while punishing emotional exits.
In conclusion, silver stands at the intersection of three powerful global shifts — technological transformation, monetary instability and resource scarcity. It is no longer just a precious metal; it is becoming a strategic asset for the coming decade. Gold protects capital, but silver has the potential to multiply it. This is why many economists, historians and market analysts believe silver is poised to become one of the most powerful wealth-building assets of the future.
Silvers easy route to $100.Silver is currently positioned with a clear and relatively uncomplicated path toward the $100/oz level, largely due to a visible price vacuum above current levels. From a market structure perspective, there are only a few major zones of resistance overhead, meaning price does not need to fight through dense supply to continue higher. If recent support fails to hold, the most probable scenario is a reversal off the recent swing low and low-volume node (LVN), where prior acceptance was minimal and momentum can reaccelerate quickly. That area acts as a natural launch point, and if buyers step in as expected, silver has a high-probability move straight through the remaining zones toward the $100 target.

The Silver Bullet
Silver is back on the rise and showing increasingly strong bullish momentum despite the numerous large accounts on social media trying to pin the top and boast short entries that are currently suffering severely.
On 10/29/24 I described a breakout move occurring where price would see an initial rejection of the $53-$57 range before exploding to a target range of $79 and $132. I don't care to explain where these levels are derived from in great detail in order to preserve a part of my edge through a unique application of Fibonacci.
Aside from the 2.618 @ $132.01 being primary target at this stage in the parabola:
Special interest to the $108-$110 range just ahead here upon break of $96.72. Method implies the next intermediary rejection and reconsolidation begins there, with true support laying at $79.81 in the event of a rejection.
Good luck!
