Silver Pulls Back After Double Top TestSilver futures bounced off resistance at $82.67 on Tuesday. According to our primary scenario, the next key move will be for price to break through this level, which would open the way toward the red Target Zone between $92.25 and $111.28. In that area, we expect the prominent top of the green-labeled wave to form, followed by a larger corrective move. Based on this outlook, traders could consider entering short positions within the $92.25 to $111.28 range, using a stop set 1% above the upper boundary of the zone. Alternatively, it’s possible that the green wave alt. already peaked at $82.67 and price is now correcting directly below support at $69.26. If this scenario plays out—which we assign a 35% probability—a direct pullback into the alternative green long Target Zone between $53.26 and $47.16 would be expected.
Silver

Silver bullish sideways consolidation supported at 7230The Silver remains in a bullish trend, with recent price action showing signs of a corrective pullback within the broader uptrend.
Support Zone: 7230 – a key level from previous consolidation. Price is currently testing or approaching this level.
A bullish rebound from 7230 would confirm ongoing upside momentum, with potential targets at:
7926 – initial resistance
7154 – psychological and structural level
7397 – extended resistance on the longer-term chart
Bearish Scenario:
A confirmed break and daily close below 7230 would weaken the bullish outlook and suggest deeper downside risk toward:
7126 – minor support
6984 – stronger support and potential demand zone
Outlook:
Bullish bias remains intact while the Silver holds above 7230. A sustained break below this level could shift momentum to the downside in the short term.
This communication is for informational purposes only and should not be viewed as any form of recommendation as to a particular course of action or as investment advice. It is not intended as an offer or solicitation for the purchase or sale of any financial instrument or as an official confirmation of any transaction. Opinions, estimates and assumptions expressed herein are made as of the date of this communication and are subject to change without notice. This communication has been prepared based upon information, including market prices, data and other information, believed to be reliable; however, Trade Nation does not warrant its completeness or accuracy. All market prices and market data contained in or attached to this communication are indicative and subject to change without notice.

From Silver Shine to Zinc Strength: Hindustan Zinc’s Rally AheadBreakout: Stock has broken out of a descending triangle (bullish signal).
Current Price: ₹498.10
Target Zone: ₹572.10 (upside potential)
Stop-Loss: ₹444.95 (risk level)
Volume: Strong at 36.55M, confirming momentum.
Market Drivers
Silver Rally: Recent gains supported by rising silver prices.
Sector Strength: Outperformed metals sector and Sensex in early December.
Fundamentals
India’s only integrated zinc producer.
Strong reserves with >25 years mine life.
⚠️ Disclaimer
This is educational analysis only, not investment advice. Please consult a SEBI-registered advisor before trading.

XAGUSD (Past) - Too Quicksilver! :(~+ Fed is to change the chairman soon, the new one is expected to be dovish
+ Soft US Data (ISM, Retail Miss; Unemployment Beat)

SILVER Will Keep Growing! Buy!
Hello,Traders!
SILVER reacts from a well-defined horizontal demand zone after a corrective sell-off. Sell-side liquidity has been swept and smart money mitigation is visible, suggesting a bullish reaction toward higher internal liquidity and upside targets. Time Frame 2H.
Buy!
Comment and subscribe to help us grow!
Check out other forecasts below too!
Disclosure: I am part of Trade Nation's Influencer program and receive a monthly fee for using their TradingView charts in my analysis.

XAGUSD Double-Top Breakdown?Silver (XAGUSD) is still structurally bullish on the bigger picture, but the tape has shifted in the short term. After a powerful 2025 uptrend, price topped out near 83.00 and has since sold off aggressively, with expanding daily volatility (ATR rising). That kind of impulse pullback often signals exhaustion, especially when momentum flips.
Technically, a Double Top is forming at the peak, and momentum confirms the pressure: MACD has crossed bearish and the histogram is widening to the downside. The key level to watch is the neckline around 72.00—this is the line that turns a pullback into a true reversal attempt. As long as price is chopping above it, the base case is consolidation and stabilization.
If we get a sustained daily close below 72.00, that would validate the breakdown path, opening room toward 66.00 as the next meaningful support objective. Invalidation is clean: a push back above 75.00 would argue for a failed breakdown and a return to the broader bull structure. Keep 69.50 (SuperTrend support) on the radar—losing it would likely accelerate downside momentum. This is a study, not financial advice. Manage risk and invalidations.
Thought of the Day 💡
The best trades often come from clarity: know your trigger, and respect your invalidation.
-------------------------
Thanks for your support!
If you found this idea helpful or learned something new, drop a like 👍 and leave a comment, I’d love to hear your thoughts!

Silver Bounce Around $50The 0.5 is a possible Bounce. I will be watching for a bounce at the top, or a break below. Good place to layer in LONGS knowing might be in the red until 0.618, for long time plays.
The 0.618 Golden Pocket is my favorite target.
I think between these two levels a LONG or SHORT bias will become clear.

Silver Breakdown Incoming? Targeting $65 from Current Highs!(XAG/USD)Sell Opportunity Entry: Short around $74.80 - $75.00 (current levels after recent pullback)
Target: $65.00 - $66.00 zone (lower support/range low)
Stop Loss: Above $78.00 (recent highs/resistance)
Timeframe: 4H/Daily – Swing trade
Rationale: Price showing signs of exhaustion after strong rally, forming potential distribution/range around higher levels with recent downside momentum. Looking for retracement toward previous consolidation/support near $65.
Not financial advice – Trade at your own risk. Always use proper risk management. DYOR.#Silver #XAGUSD #SellSignal #Commodities #Trading #PreciousMetals #TechnicalAnalysis #NotFinancialAdvice

Silver fail to break the record highSilver prices recently surged as escalating geopolitical risks between the US and Venezuela prompted a flight to safe-haven assets. Concurrently, a persistent supply deficit remains a primary concern while industrial demand from the solar PV, EV, and physical investment sectors has accelerated amid structural supply constraints. Expectations that the Fed may implement additional rate cuts in 2026 provide further upside momentum for silver prices.
We now see that XAGUSD has a high correlation with XAUUSD within a 6-month period, at 0.98, but with higher volatility, indicating a higher risk and return. Besides, the incoming NFP tomorrow could heighten volatility due to the surprise of new employment hires, which are expected to increase by 65k in Dec 2025.
Technically, the XAGUSD broke below the EMA21 and traded between both EMAs, signaling consolidation, but remained in the uptrend.
If the price breaks above the EMA21 at 77.5, it could encounter resistance around the last swing high at 81.5. This scenario could be triggered by the weak NFP or an increase in the unemployment rate.
Inversely, price could break below the 75.00 to find support at the 70.57 level.
By Van Ha Trinh - Financial Market Strategist at Exness

Stop!Loss|Market View: USDCHF🙌 Stop!Loss team welcomes you❗️
In this post, we're going to talk about the near-term outlook for the USDCHF currency pair☝️
Potential trade setup:
🔔Entry level: 0.79758
💰TP: 0.78838
⛔️SL: 0.80276
"Market View" - a brief analysis of trading instruments, covering the most important aspects of the FOREX market.
👇 In the comments 👇 you can type the trading instrument you'd like to analyze, and we'll talk about it in our next posts.
💬 Description: At the end of this week, at least until tomorrow's non-farm data release, we should expect further strengthening of the USD across all major currencies. However, the technical situation for USDCHF is different from the others, growth is also expected there, but the area around 0.79 will likely be tested before a more global strengthening of the USD. Targets around 0.78 are also being considered. The most reliable entry point for this could be a false breakout near the 0.8 resistance level.
Thanks for your support 🚀
Profits for all ✅

Bull Flag possibly forming on SilverDespite silver in over-bought territory, this pattern shows a potential bull flag forming on silver and the target price is just above $100/oz. Not financial advice but this is a pattern I see possibly playing out.

Extreme silver volatility likely to continueGoldman Sachs says silver is likely to stay highly volatile because inventories in London are unusually low.
With less metal available, prices can move sharply on relatively small shifts in demand or positioning. This also increases the risk of squeeze like moves, which can helps explain the oversized swings above $70 the market has seen recently.
Goldman adds that the volatility can work in either direction. Until inventories rebuild and trading conditions normalise, silver is likely to remain very reactive to new headlines and flows.

SILVER Free Signal! Buy!
Hello,Traders!
SILVER price has tapped into a well-defined horizontal demand zone after a corrective pullback. Smart money mitigation is evident, with sell-side liquidity swept and bullish displacement forming, suggesting a continuation toward higher liquidity pools.
Stop Loss: 76.34$
Take Profit: 81.08$
Entry: 78.23$
Time Frame: 2H
--------------------
Buy!
Comment and subscribe to help us grow!
Check out other forecasts below too!
Disclosure: I am part of Trade Nation's Influencer program and receive a monthly fee for using their TradingView charts in my analysis.

xagusd to $70?is xagusd going to find support here on the 6 month chart?
- mid bollinger band
- corrective poc from ATH to 2020 low
- golden pocket retrace of the move up
- candle apporaching fibo circle
- diagonal breakout retest

Gold and silver at record highs look “beautiful” from the outsidA shiny chart. A clean narrative.
Haven. Protection. Stability.
But if you look at the world map instead of the price chart, you see the real message:
This is not a celebration, it’s an alarm.
When sanctions multiply, capital doesn’t vanish. It relocates.
It goes where enforcement is harder, where rules are weaker, where control is physical:
commodities. energy. metals. food. land.
So yes, what we’re seeing is a kind of commodity premium / mini-bubble, not driven by optimism, but by a global system that is quietly screaming:
“We don’t trust each other anymore.”
And in 2026, that distrust is everywhere across continents, across alliances, across supply chains. Let me show you the situation in a better view.
Why China can’t “let go” of Taiwan (Asia)
People talk about Taiwan like it’s just a small island with a big flag problem.
For Beijing, Taiwan is three things at once:
1. Legitimacy
The Chinese Communist Party has built a long-term national story around “reunification” and the One China principle. If Taiwan formally separates, it’s not just geopolitics it’s a political wound inside the narrative of Chinese power.
2. Strategy & geography
Taiwan sits in the middle of the “first island chain,” a strategic barrier that shapes naval access from China’s coast into the wider Pacific. It’s not romantic, it’s geometry
3. Semiconductors
This is the part markets understand: Taiwan is a critical node for advanced chips, and chips are the oil of the digital economy. If you control the chips, you influence everything: AI, defense, cars, telecom, industry.
So when tensions rise around Taiwan, commodities react because everyone starts thinking about blockades, shipping routes, inventories, and “just in case” reserves.
Why Russia is obsessed with Ukraine (Europe)
Most headlines simplify it: “Russia attacked Ukraine.”
True, and the human cost is real. But the strategic logic behind Moscow’s obsession is older than 2022.
From Russia’s viewpoint, Ukraine is:
• A buffer between Russia’s core and Western military infrastructure
• A key piece in the idea of spheres of influence (the old imperial instinct, updated for modern politics)
• A credibility issue: Russia wants to prove it can redraw borders by force and still be treated as a great power
You’ll also hear the NATO argument: that Russia’s leadership frames NATO enlargement and Western alignment of Ukraine as a security threat near its border. Some analysts emphasize that narrative heavily.
Others argue NATO is not the real cause, and the deeper reason is Russia’s broader imperial ambition and the West’s post-Cold War security architecture failing to deter it.
Either way, markets don’t trade morality. Markets trade risk.
And war risk equals: energy risk, fertilizer risk, wheat risk, metals risk. Simple to solve Ukraine is Europe without NATO, and the agreement is done! But continue to listen, Selenski, for not accepting this deal.
Venezuela is not “Latin America news,” it’s a global chessboard (Americas)
In the first week of January 2026, the world watched something that would have sounded like a movie script:
U.S. forces captured Venezuelan President Nicolás Maduro, and Delcy Rodríguez was installed as interim leader in Caracas.
This isn’t just regime change drama. It’s a collision of three power logics:
1) The United States (Donald Trump)
Washington sees Venezuela as:
• oil supply potential / Hello, commodities.
• a hostile regime in the Western Hemisphere
• and, frankly, a signal to rivals: “we can still act hard.”
2) China (Xi Jinping)
China’s interest is not romance, it’s resources and influence:
• years of loans, oil-for-debt structures, and strategic leverage
• presence in America’s “backyard,” which matters symbolically as much as economically
3) Russia (Vladimir Putin)
Russia gains by:
• backing anti-U.S. positions globally
• keeping the West busy in multiple theaters
• and reinforcing the “sphere of influence” idea (if the U.S. has one, Russia claims it does too)
So yes: Venezuela connects Asia, Europe, and the Americas in one chain reaction.
And chains like this don’t end in equities.
They end in hard assets.
The Arctic is becoming the new “Middle East” (North America / Europe)
While everyone is distracted by war headlines, the map is shifting north.
Trump is again openly exploring ways to acquire Greenland, and the White House message is basically: national security first.
Why does Greenland matter?
• Arctic positioning (shipping lanes, military logistics, early-warning systems)
• critical minerals (the boring stuff that powers everything you and your army use) Reuters
This is not a meme. It’s geopolitics moving into the Arctic.
More uncertainty → more commodity premium!!!
Middle East: tension doesn’t need headlines to stay dangerous (Middle East)
Iran–Israel remains a high-voltage line.
• Israel under Benjamin Netanyahu still operates under intense security pressure domestically and regionally.
• Iran under Masoud Pezeshkian sits inside a system where the Supreme Leader and security structures still drive the “red lines,” especially around deterrence.
And Gaza… the scariest part is exactly what you said: silence.
When suffering continues but attention drops, risks don’t disappear; they become unmanaged.
Unmanaged risk is what markets fear most.
Europe: not “collapse,” but a slow squeeze
I’ll be honest: the “84% of European countries are near the recession” line is too absolute.
What we can say with data is simpler and maybe worse:
Europe is facing weak growth and stagnation pressure, not a healthy expansion. The EU outlook is modest, and the divergence between countries is real.
That matters because:
• weak growth + higher rates + reduced incentives
• means SMEs suffer
• and political stress rises
• and social patience falls
Again: instability premium → commodities.
And then the cherry on top: everyone is buying weapons
This is the part where my irony becomes almost tragic.
World military spending hit a record (SIPRI shows $2.718 trillion in 2024, with sharp rises in Europe and the Middle East).
So yes:
• China invests
• Russia invests
• the U.S. invests
• Europe invests
Everybody “defends democracy,” “defends sovereignty,” “defends security.”
Meanwhile, the population defends itself by paying:
• higher taxes
• higher energy
• higher food
• higher everything
And the decision-makers in many countries are… 80+ years old and will die soon from aging.
We’re basically funding the endgame of people who won’t even be here to see the consequences.
Nice catch for us!
So what does this mean for markets?
It means this is not a normal cycle.
In a world where:
• One bad deal can move oil
• One missile can move wheat
• One sanctions package can move metals
• One arrest in Caracas can shake Beijing
Trading purely on “fundamentals and technicals” like it’s 2017 is… brave or stupid.
At this point, if you want pure thrills, go to the casino, at least the rules are written on the wall.
For everyone else:
Be conservative. Size small. Protect capital. Obsess over risk management.
Because the market is no longer just a market.
It’s a global nervous system reacting to geopolitics in real time.

SilverSilver prices found support around $75, and if they rebound from there, they could potentially reach new highs.
However, they will also encounter resistance around $78 and $81.
If the support level is broken, prices will fall back to between $72 and $69.

Venezuela: The "Blue Gold" Heist (It’s Not Just Oil)If you rode the Western Digital ( NASDAQ:WDC ) trade with me, you saw what happens when the market realizes AI needs Space. We caught the bottom on WDC because the infrastructure trade was obvious. (See related idea: The Vault of the AI Era)
But the "Supercycle" doesn't stop at Storage. It goes deeper. From Bytes (Software) ➡️ to Atoms (Raw Materials).
1. The "Blue Gold" Thesis 🇺🇸🇻🇪 Everyone is debating the oil politics of the US & Venezuela. They are missing the Tech Angle. Venezuela sits on the Orinoco Mining Arc, home to massive reserves of Coltan ("Blue Gold") and Rare Earths.
The Reality Check: You cannot build an NVDA GPU, a WDC hard drive, or a TSLA robot without these minerals. Coltan is the "blood" of the electronics industry.
The Pivot: The US "Reconstruction" effort isn't just charity. It is a strategic move to secure the physical supply chain of the AI era. They are breaking the monopoly on critical tech inputs.
2. The "Hard Asset" Rotation 🔄 Smart Money is rotating from "Overvalued Tech" to "Undervalued Resources."
Silver ( NASDAQ:XAG ): The ultimate "Hybrid." It wins twice—once on inflation (Venezuela spending), and again on the massive industrial demand for the AI grid. (See my "Curse Broken" analysis)
Gold ( TVC:XAU ): The Liquidity Sponge. If they print money to rebuild, Gold goes up. Simple math.
3. The Chart: The REMX Breakout 📉 I marked up the Weekly Chart of the Rare Earth ETF ( AMEX:REMX ) because the geometry is too clean to ignore.
The Wedge: We just broke out of a multi-year Falling Wedge (Blue Channel). In my experience, this is the "Terminator" of bear markets.
The Floor: We are bouncing perfectly off the Green Support Zone ($50-$60). The "Peak Fear" is in.
The Trade: While Tech is at All-Time Highs, the inputs for Tech are at multi-year lows. That is the opportunity.
REMX 1D:
👇 The "Physical AI" Watchlist: We are playing the Supply Chain, not the noise.
The Brains: NASDAQ:NVDA (Compute)
The Vault: NASDAQ:WDC (Storage Infrastructure)
The Atoms: AMEX:REMX , NYSE:MP (Rare Earths)
The Hedge: TVC:SILVER , TVC:GOLD , $
The Question: We all own the Chips ( NASDAQ:NVDA ). But be honest—do you own a single ounce of what the chips are actually made of?
Disclaimer: Just sharing my read on the macro supply chain. Not financial advice.

Stop!Loss|Market View: EURUSD🙌 Stop!Loss team welcomes you❗️
In this post, we're going to talk about the near-term outlook for the EURUSD currency pair☝️
Potential trade setup:
🔔Entry level: 1.16397
💰TP: 1.18024
⛔️SL: 1.15710
"Market View" - a brief analysis of trading instruments, covering the most important aspects of the FOREX market.
👇 In the comments 👇 you can type the trading instrument you'd like to analyze, and we'll talk about it in our next posts.
💬 Description: The US dollar found support midweek, but mood among the major currency pairs is mixed. The euro is expected to break recent lows, leading to a downward movement toward the 1.16000 - 1.16500 range. Potential buying setups can be expected in this area, given the liquidity of this price zone.
Thanks for your support 🚀
Profits for all ✅

SILVER SHORTING DOUBLE TOPSilver shorting chance.
Top formation (Double top pattern)
Current price : 78.50 USD
Short at : 78 USD
Expected fall : 30%
Use Trailing SL to protect capital and minimize loss.
Rest Idea mentioned on the chart

SILVER - 4h- Buy on Dip On 4h tf, Trend line has been drawn (black).
Price is dipping for retracement and Fib 50~60% zone is likely contender to get into the trade. However, I would better be eying deep retracement of 78% which coincides with 4h trend line as well to give me confluence.
It is very volatile and better to avoid unnecessary risk.
On the other hand, if price crosses $85 then I'll definitely take a LONG Trade. However, at the moment I'll wait and see for following trade to trigger.
Trade Value:
Buy : 68.270
SL: 63.9021
RRR: 1:3
TP: 79.0960

Silver Analysis
4h analysis shows the reaction on resistance area and price could hold itself above it. which is %70 of the bearish move. So bullish signal (blue box)
Daily candle closed above all other days. another bullish signal. (yellow line)
According to ichimoku and fibo this area is important so signal of bullish.
we are close to the top of first channel, will publish update later.
Stay tuned for our next updates.

Silver vs SPX: A Case for Multi Year OutperformanceThesis
Silver has a credible probability of outperforming the S&P 500 over a multi year horizon, potentially five to ten years, driven by persistent macroeconomic constraints, negative real rate bias, and a structurally tight supply demand balance. This outcome does not require systemic collapse or hyperinflation, only continued policy and fiscal pressure.
Macro framework
The US debt burden materially limits monetary policy flexibility. Aggressive rate hikes risk destabilizing an economy that remains highly dependent on credit expansion, while sustained easing increases the likelihood of above target inflation. This creates a long term bias toward financial repression, where nominal growth is supported at the expense of real purchasing power.
In such environments, real assets historically outperform financial assets on a relative basis. Even moderate but persistent inflation combined with capped or declining real rates is sufficient to favor precious metals versus equities.
Relative performance rather than absolute collapse
This thesis is not predicated on hyperinflation or fiat currency failure. Equities may continue to rise nominally, but silver does not need stocks to fall outright to outperform. A period of stagnant or modest equity returns alongside rising commodity prices is enough to generate meaningful relative outperformance.
Supply and demand dynamics
Silver supply is structurally constrained. A large portion of global production is a byproduct of base metal mining, limiting the ability of supply to respond quickly to higher prices. At the same time, industrial demand continues to grow, particularly in energy transition, electronics, and defense related applications.
Above ground inventories remain limited relative to potential demand surges. While demand is not infinite and substitution can occur at sufficiently high prices, the adjustment process is slow and often price disruptive, creating conditions for volatility and upside asymmetry.
Strategic behavior as a signal
Corporate and governmental behavior increasingly reflects concern over future availability of critical materials. Prepayment agreements, long term offtake contracts, and supply chain security initiatives suggest that some participants are prioritizing certainty of access over spot pricing. These behaviors tend to emerge when markets underestimate future scarcity.
As resource security becomes a higher priority, capital allocation decisions may shift in ways that favor commodity producers and real assets over long duration growth equities.
Pathways to silver outperformance
Silver is likely to outperform the S&P 500 under several realistic scenarios, including
Persistent inflation that keeps real rates near zero or negative
Continued fiscal expansion and debt growth without meaningful consolidation
Rising industrial demand without a commensurate increase in supply
Increased strategic stockpiling by governments or corporations
Periods of equity market stagnation or valuation compression rather than outright crashes
None of these conditions require extreme outcomes, and several can occur simultaneously.
Risks to the thesis
This thesis would be weakened if real interest rates remain meaningfully positive for an extended period, if fiscal discipline materially improves, or if technological substitution and recycling significantly reduce silver demand. A sustained expansion in silver supply would also challenge the upside case. Though arguably unlikely, these risks are still possible.
Conclusion
Silver outperformance is not inevitable, but the risk reward profile appears asymmetric. The combination of policy constraints, structural supply limits, and demand sensitivity creates a setup where silver has multiple viable paths to exceed equity returns over a multi year period. The primary risk lies not in short term volatility, but in the possibility that macro conditions resolve more favorably than currently expected.

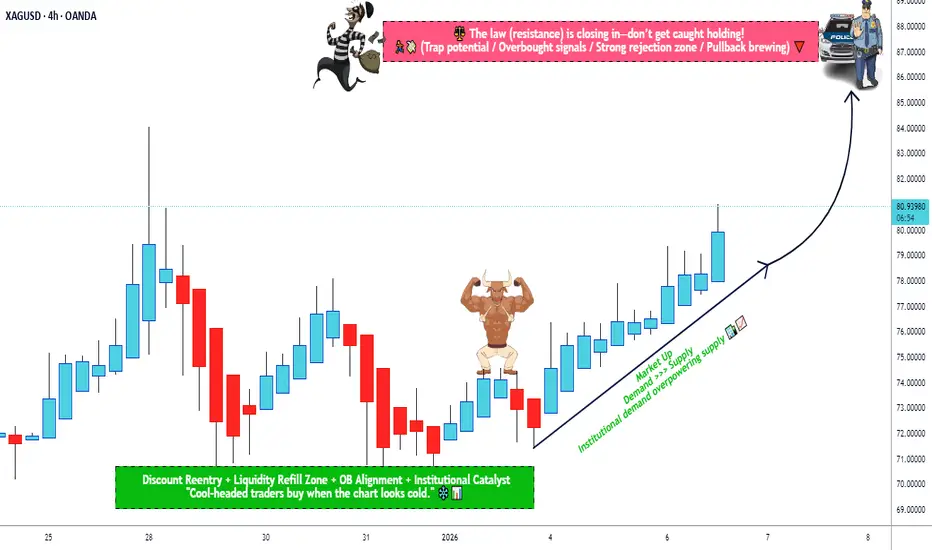
XAG/USD › Bullish Price Structure & Trade Planning📈 TITLE — SILVER SWING BREAKOUT 📊 XAG/USD “SILVER vs USD” 🥈
Market Blueprint | Bullish Thief Strategy | Layered Entries + Macro Signals
📝 DESCRIPTION
🔔 Asset: XAG/USD – Silver vs U.S. Dollar (Metals)
💡 Trade Bias: Bullish (Day / Swing)
🚀 Plan Summary:
Silver remains in a structural uptrend and is trading at elevated levels with strong industrial and safe-haven demand. Macro drivers include dovish Fed expectations, persistent supply deficits, and robust demand from solar, EV & tech sectors — all bullish fundamentals supporting higher prices.
📌 Entry Strategy (Thief Layering)
Thief layering strategy — place multiple buy limits to scale into strength with risk control:
🎯 Layer Buy Zones (example):
• 🟩 76.000
• 🟩 78.000
• 🟩 80.000
(You can increase/add layers based on volatility & personal risk tolerance.)
📌 Why layering?
This technique helps build position as price retests structural supports while capturing volatility swings.
🔥 Stop-Loss (Risk Control)
🛑 Thief Stop-Loss @ 74.000
👉 Adjust SL based on your risk profile — trade safe, manage risk first.
🎯 Target / Profit Zones
🏁 Target Area: ~87.000
Key resistance zone near overbought levels & potential reversal/top trap region — take partial profits. Let price action confirm continuation.
Targets are guidelines — manage according to your risk/reward.
📊 Correlated Pairs to Watch
Watch correlations with:
• XAU/USD (Gold) — safe-haven behavior often aligns with silver trends.
• USD Index (DXY) — stronger USD can cap metals; weaker USD fuels bullion upside.
• Copper / Base Metals — industrial demand context.
Correlation signals give context on trend strength vs macro flows.
📈 Macro & Fundamental Drivers (Latest)
Bullish Fundamentals:
🔹 Silver has seen a historic rally and recently touched near record highs, driven by supply constraints + industrial demand.
🔹 Structural supply deficits and growing tech/green energy demand support higher price floors.
🔹 Market pricing still reflects expectations of Fed rate cuts in 2026, pushing yield-less assets higher.
Risk / Volatility Factors:
⚠ Index rebalancing and technical selling could add short-term pressure.
⚠ Silver historically more volatile than gold → wider swings possible.
📅 Economic & News Catalysts
Keep an eye on these reports with London time relevance:
📌 US Federal Reserve rate decisions & press releases
📌 US CPI & employment (NFP) data
📌 ISM Manufacturing + global PMIs
📌 China industrial output & export policies
These data points shape USD direction, interest-rate expectations, and commodity flows.
💬 Risk Reminder (Thief OGs)
Dear traders, sizing SL/TP is YOUR decision — trade your plan. Profits are earned when disciplined. Live setups change — adapt.
📌 This is a guideline plan based on current structure, not financial advice.