SILVER Strong Rising Channel! Buy!
Hello,Traders!
SILVER continues to trade within a well-defined bullish channel, with price respecting dynamic support after a brief consolidation. The recent pause appears to be smart-money absorption above prior structure, suggesting continuation toward higher liquidity pools resting near channel highs. Time Frame 6H.
Buy!
Comment and subscribe to help us grow!
Check out other forecasts below too!
Disclosure: I am part of Trade Nation's Influencer program and receive a monthly fee for using their TradingView charts in my analysis.
Silver

Will Defiance join the party?Defiance Silver is one of the few development companies that has not taken advantage of this massive move in silver.
So, either there are underlying issues hurting this stock price... OR... this thing is getting ready for a massive pop to the upside.

Chandi Hi Chandi!Chandi is trying to reach till Chand!
Today Silver Future has touched 214583 which is Life time high as of now....
Today after giving a new LTH it is showing the sign of Distribution here.
If Silver Breaks down todays low which is 209000 which is a Support in 1 Hr time Frame it can turn Bearish as also we can see Divergence of RSI is Daily Time Frame.
Once Silver Turns Bearish we can see the level of 180000 in next few weeks.
level of 180000 will be very crucial as if it breaks this level also next stop will be 140000
and if it takes Support from 180000 and shows Bullish Sign here one can invest small qty here well 140000 will be a very good level to invest in Silver.
Lets see!

Silver uptrend continuation support at 6680The Silver remains in a bullish trend, with recent price action showing signs of a corrective pullback within the broader uptrend.
Support Zone: 6680 – a key level from previous consolidation. Price is currently testing or approaching this level.
A bullish rebound from 6680 would confirm ongoing upside momentum, with potential targets at:
7000 – initial resistance
7130 – psychological and structural level
7200 – extended resistance on the longer-term chart
Bearish Scenario:
A confirmed break and daily close below 6680 would weaken the bullish outlook and suggest deeper downside risk toward:
6540 – minor support
6435 – stronger support and potential demand zone
Outlook:
Bullish bias remains intact while the Silver holds above 6680. A sustained break below this level could shift momentum to the downside in the short term.
This communication is for informational purposes only and should not be viewed as any form of recommendation as to a particular course of action or as investment advice. It is not intended as an offer or solicitation for the purchase or sale of any financial instrument or as an official confirmation of any transaction. Opinions, estimates and assumptions expressed herein are made as of the date of this communication and are subject to change without notice. This communication has been prepared based upon information, including market prices, data and other information, believed to be reliable; however, Trade Nation does not warrant its completeness or accuracy. All market prices and market data contained in or attached to this communication are indicative and subject to change without notice.

SILVER Will Go Lower! Short!
Take a look at our analysis for SILVER.
Time Frame: 1h
Current Trend: Bearish
Sentiment: Overbought (based on 7-period RSI)
Forecast: Bearish
The market is testing a major horizontal structure 6,912.5.
Taking into consideration the structure & trend analysis, I believe that the market will reach 6,768.7 level soon.
P.S
The term oversold refers to a condition where an asset has traded lower in price and has the potential for a price bounce.
Overbought refers to market scenarios where the instrument is traded considerably higher than its fair value. Overvaluation is caused by market sentiments when there is positive news.
Like and subscribe and comment my ideas if you enjoy them!

Silver Breakout Silver has broken to a new high and is looking to move further up
Right now its above the two prior peaks that create a resistance line
Weekly chart

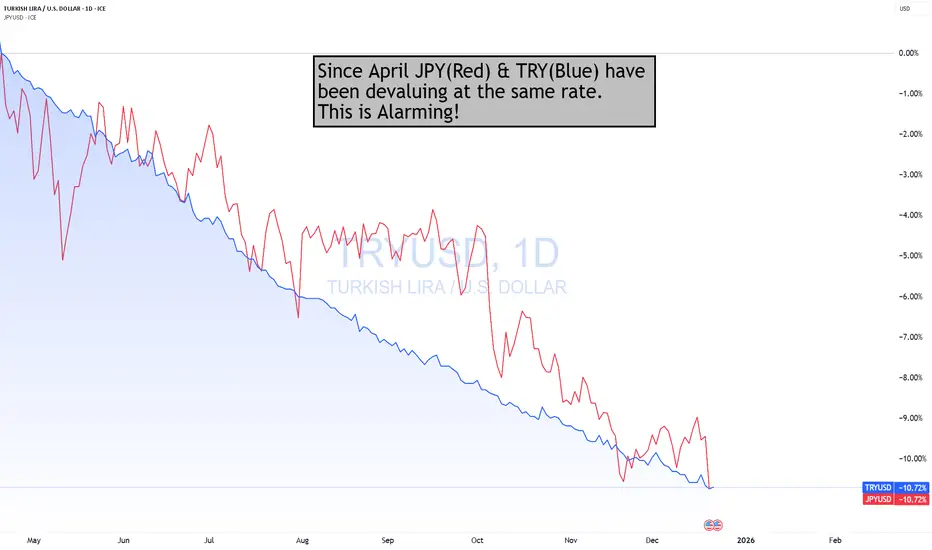
JPY Devaluing At The Same Rate As TRY Against $Since April, the JPY has been falling at the same rate as the TRY against the $. This is Alarming, should the trend continue.
This makes this even more interesting, is that the DXY since Trump took office, has dropped almost by the same amount!
What is important to also understand is that the JPY is 145 of the DXY. As such, if the JPY were to strengthen (all else being equal) the DXY would be down even more!
How would that help the "AFFORDABILITY HOAX" if the $ keeps devaluing, requiring more $s to buy the same amount of goods & services?
Now, does it make a bit more sense why Gold & Silver have soared this year?
I hate to keep harping on JPY, but it is important to all traders/investors in all asset classes, not just FX.
THANK YOU for getting me to 5,000 followers! 🙏🔥
Let’s keep climbing.
If you enjoy the work:
👉 Boost
👉 Follow
👉 Drop a solid comment
Let’s push it to 6,000 and keep building a community grounded in truth, not hype.
SILVER Bullish Bias! Buy!
Hello,Traders!
SILVER delivers a clean displacement through a key horizontal range, confirming bullish BOS and smart money continuation. The breakout holds above prior supply-turned-support, suggesting acceptance and strength, with upside liquidity resting at higher premium levels. Time Frame 2H.
Buy!
Comment and subscribe to help us grow!
Check out other forecasts below too!
Disclosure: I am part of Trade Nation's Influencer program and receive a monthly fee for using their TradingView charts in my analysis.

SILVER: Short Trading Opportunity
SILVER
- Classic bearish formation
- Our team expects pullback
SUGGESTED TRADE:
Swing Trade
Short EURUSD
Entry - 67.212
Sl - 67.647
Tp - 66.419
Our Risk - 1%
Start protection of your profits from lower levels
Disclosure: I am part of Trade Nation's Influencer program and receive a monthly fee for using their TradingView charts in my analysis.
❤️ Please, support our work with like & comment! ❤️

SILVER Set To Fall! SELL!
My dear subscribers,
My technical analysis for SILVER is below:
The price is coiling around a solid key level - 67.212
Bias - Bearish
Technical Indicators: Pivot Points Low anticipates a potential price reversal.
Super trend shows a clear sell, giving a perfect indicators' convergence.
Goal - 66.355
My Stop Loss - 67.771
About Used Indicators:
By the very nature of the supertrend indicator, it offers firm support and resistance levels for traders to enter and exit trades. Additionally, it also provides signals for setting stop losses
Disclosure: I am part of Trade Nation's Influencer program and receive a monthly fee for using their TradingView charts in my analysis.
———————————
WISH YOU ALL LUCK

SILVER: Still Bullish! Buy The Dip!In this Weekly Market Forecast, we will analyze the XAGUSD (SILVER) for the week of Dec. 15 - 19th.
Silver .... still strong! With a weakened USD due to an interest rate cut by the Fed, there are no headwinds to offer resistance.
Be mindful that this market is overextended, and a pullback is pending.
There is a +FVG to draw price to it below. That would make a great area to look for dip buying opportunities.
Enjoy!
May profits be upon you.
Leave any questions or comments in the comment section.
I appreciate any feedback from my viewers!
Like and/or subscribe if you want more accurate analysis.
Thank you so much!
Disclaimer:
I do not provide personal investment advice and I am not a qualified licensed investment advisor.
All information found here, including any ideas, opinions, views, predictions, forecasts, commentaries, suggestions, expressed or implied herein, are for informational, entertainment or educational purposes only and should not be construed as personal investment advice. While the information provided is believed to be accurate, it may include errors or inaccuracies.
I will not and cannot be held liable for any actions you take as a result of anything you read here.
Conduct your own due diligence, or consult a licensed financial advisor or broker before making any and all investment decisions. Any investments, trades, speculations, or decisions made on the basis of any information found on this channel, expressed or implied herein, are committed at your own risk, financial or otherwise.

Silver bullish breakout support at 6380The Silver remains in a bullish trend, with recent price action showing signs of a corrective pullback within the broader uptrend.
Support Zone: 6380 – a key level from previous consolidation. Price is currently testing or approaching this level.
A bullish rebound from 6380 would confirm ongoing upside momentum, with potential targets at:
6713 – initial resistance
6790 – psychological and structural level
6860 – extended resistance on the longer-term chart
Bearish Scenario:
A confirmed break and daily close below 6380 would weaken the bullish outlook and suggest deeper downside risk toward:
6233 – minor support
6135 – stronger support and potential demand zone
Outlook:
Bullish bias remains intact while the Silver holds above 6380. A sustained break below this level could shift momentum to the downside in the short term.
This communication is for informational purposes only and should not be viewed as any form of recommendation as to a particular course of action or as investment advice. It is not intended as an offer or solicitation for the purchase or sale of any financial instrument or as an official confirmation of any transaction. Opinions, estimates and assumptions expressed herein are made as of the date of this communication and are subject to change without notice. This communication has been prepared based upon information, including market prices, data and other information, believed to be reliable; however, Trade Nation does not warrant its completeness or accuracy. All market prices and market data contained in or attached to this communication are indicative and subject to change without notice.

XAGUSD: breakout of the support trend line🛠 Technical Analysis: On the 4-hour timeframe, Silver (XAGUSD) has been in a sustained bullish rally, characterized by a well-defined Support trend line that has successfully propped up price action since late November. However, the pair has now reached a critical Resistance zone between $65.70 and $67.00.
The price action is currently showing signs of exhaustion at this peak, as it struggles to break higher. The analytical projection suggests a breakdown of the support trend line, which would trigger a corrective move toward the horizontal support levels below. A shift in momentum is expected as the price moves away from the overextended resistance toward the $58.50 target.
———————————————
❗️ Trade Parameters (SELL)
———————————————
➡️ Entry Point: Sell on the break of the Support trend line (approx. $64.68 - $65.72).
🎯 Take Profit: $58.496 (Support).
🔴 Stop Loss: $67.775 (Above the current resistance zone).
⚠️ Disclaimer: This is a potential trade idea based on current analysis; market conditions and price direction are subject to change based on news factors and volatility.

DXY: long-term view🛠 Technical Analysis: On the weekly timeframe (W1), the U.S. Dollar Index is displaying a significant structural shift. Despite a brief breach of the psychological 100 level, the price failed to generate a strong downward impulse, suggesting that bearish momentum is exhausted.
As noted on the chart, "sellers are being bought out," paving the way for a recovery back above the 100 level. The primary objective of this move is a test of the long-term descending resistance line, which currently aligns with the 107.384 target.
———————————————
❗️ Trade Parameters (BUY)
———————————————
➡️ Entry Point: Confirmation of price holding above the pivot level (approx. 100.524).
🎯 Take Profit: 107.384 (Long-term Descending Resistance).
🔴 Stop Loss: Below the recent accumulation lows (approx. 97.787).
⚠️ Disclaimer: This is a potential trade idea based on current analysis; market conditions and price direction are subject to change based on news factors and volatility.

Stop!Loss|Market View: GOLD🙌 Stop!Loss team welcomes you❗️
In this post, we're going to talk about the near-term outlook for GOLD ☝️
Potential trade setup:
🔔Entry level: 4300.195
💰TP: 4217.466
⛔️SL: 4364.676
"Market View" - a brief analysis of trading instruments, covering the most important aspects of the FOREX market.
👇 In the comments 👇 you can type the trading instrument you'd like to analyze, and we'll talk about it in our next posts.
💬 Description: Following yesterday's false breakout of local resistance, gold is considered a selling opportunity, although an alternative scenario remains for growth toward 4400-4500. A sell should be initiated by waiting for a breakout of the support trendline, which pushes the price toward resistance at 4350. The preliminary target is currently around 4200. If the alternative scenario is realized, selling near 4400-4500 is likely to be considered, but it's best to do so after reaching this area and consider potential entries based on the market situation that develops.
Thanks for your support 🚀
Profits for all ✅

Silver is in the Bullish directionHello Traders
In This Chart XAGUSD HOURLY Forex Forecast By FOREX PLANET
today XAGUSD analysis 👆
🟢This Chart includes_ (XAGUSD market update)
🟢What is The Next Opportunity on XAGUSD Market
🟢how to Enter to the Valid Entry With Assurance Profit
This CHART is For Trader's that Want to Improve Their Technical Analysis Skills and Their Trading By Understanding How To Analyze The Market Using Multiple Timeframes and Understanding The Bigger Picture on the Charts

Silver Bullish Structure into Supply, Pullback Targets MarkedThis 1H Silver (XAGUSD) chart highlights a well-defined bullish market structure with multiple BOS (Break of Structure) confirmations as price trends higher along a rising trendline. After a strong impulsive move, price enters a consolidation phase, then continues upward, respecting the dynamic trendline support.
Price is currently trading just below a clearly marked Supply Zone, signaling potential short-term exhaustion. The projection illustrates a possible corrective pullback from supply, with downside targets aligned at prior structure and liquidity levels.
1st target sits near the previous support (~63.37)
2nd target aligns deeper into the range (~61.17)
Below, a higher-timeframe Demand Zone is marked, representing a strong area of interest if deeper retracement occurs.
Overall, the chart presents a trend-continuation context with a tactical short-term pullback scenario from premium prices.

SILVER Strong Uptrend! Buy!
Hello,Traders!
SILVER is reacting from a higher-timeframe demand cluster aligned with the rising trendline. Sell-side liquidity has been swept, followed by strong bullish displacement, suggesting smart-money re-accumulation and a continuation toward the next liquidity pool above. Time Frame 4H.
Buy!
Comment and subscribe to help us grow!
Check out other forecasts below too!
Disclosure: I am part of Trade Nation's Influencer program and receive a monthly fee for using their TradingView charts in my analysis.

XAGUSDXAGUSD remains in a strong uptrend and has made a new high of $66.44. Short-term view: If the price fails to break through $67, we expect a potential downtrend. Consider selling in the red zone.
🔥Trading futures, forex, CFDs and stocks carries a risk of loss.
Please consider carefully whether such trading is suitable for you.
>>GooD Luck 😊
❤️ Like and subscribe to never miss a new idea!

AUDUSD: potential medium-term reversal🛠 Technical Analysis: On the 4-hour timeframe, AUDUSD is forming a classic Head and Shoulders pattern, indicating a potential trend reversal from bullish to bearish. While a "Global bullish signal" remains on the chart, the price action has stalled, creating a defined "Neckline" support at 0.66200. The current accumulation at this support level suggests seller pressure is building. The trade setup relies strictly on a breakout confirmation: a candle close below 0.66200 would validate the pattern and trigger a sell-off towards the next major support zone at 0.64500.
———————————————
❗️ Trade Parameters (SELL)
———————————————
➡️ Entry Point: Sell only on a confirmed breakdown of support (approx. 0.66033 / below 0.66200)
🎯 Take Profit: 0.64523 (Support)
🔴 Stop Loss: Above the Right Shoulder (approx. 0.66786)
⚠️ Disclaimer: This is a potential trade idea based on current chart patterns; do not enter before the support level is broken, as the trend could still hold.

Traders Who Follow Their Plan 90% the Time Look VERY DifferentBehind the scenes with prop traders, something interesting showed up in the numbers.
Nothing changed in their strategy. Same setups. Same market.
What changed was this:
-Plan adherence went from about 50% of trades to around 90%
-Rule breaks dropped by about 70%
-Account survival jumped roughly 40% (they stayed funded much longer)
In other words, they didn’t “find a better edge.”
They just actually followed the plan they already had most of the time.
This is why so many traders feel stuck: they keep searching for a new strategy, when the real leak is not doing what they said they would do.
Be honest with yourself for a second:
If you look at your last 20 trades… how many were truly from your plan, and how many were “I’ll just try this”?
Drop your honest guess below as a % (for example: “40% plan / 60% random”).
No judgment, just curious how people see themselves vs what the data usually shows.
Trade Smarter Live Better / Mindbloome Exchange

SILVER (XAGUSD): Another BoS
Silver did it again.
The price updated the ATH yesterday, breaking and closing above
a major horizontal resistance.
It opens a potential for more growth.
Next resistance will be 68.0
❤️Please, support my work with like, thank you!❤️
I am part of Trade Nation's Influencer program and receive a monthly fee for using their TradingView charts in my analysis.

Long Term Silver Bull Going ShortThis post is a follow up to my "Grand Silver Supercycle" chart posted on 2/2/2023. I recommend referencing that chart to understand my commentary here. In that chart, I called for silver to double in price by the end of 2025 and to reach $95 by 2027. Since then, silver has overshot my near term price targets. I'm here to argue that silver has gone up too far too quickly and is due for a sharp pullback to the $50-$55 range.
Why am I calling this the near term top?
Silver has very neatly followed Elliot Wave Theory throughout its history. In 2023, I predicted Wave 3 of the current cycle, which began with the low in the summer of 2022, to have a 1.618 extension of Wave 1. Instead, silver just reached the 2.618 extension, which back in 2023, I thought was too bold of a prediction. While it is possible for a 4.618 extension to 102.5, these extensions are very rare. The bias is towards a pullback here.
There is also a convergence between the Elliot Wave extension, a fib retracement level, and logarithmic trendline. This indicates that any attempts to breakout higher will face strong resistance.
Finally, I need to talk about gold. The monthly RSI has been over 90 for 3 months, closing in on 4 months. Gold has only held an RSI above 90 for 4 consecutive months at one point prior in its charted history. Gold is still silver's big brother and will determine the direction the two move.
