Silver - Short Term Buy IdeaH1 - Strong bullish momentum.
No opposite signs.
Until the two Fibonacci support zones hold I expect the price to move higher further.
If you enjoy this idea, don’t forget to LIKE 👍, FOLLOW ✅, SHARE 🙌, and COMMENT ✍! Drop your thoughts and charts below to keep the discussion going. Your support helps keep this content free and reach more people! 🚀
-------------------------------------------------------------------------------------------------------------------
Silver

Continue OF Silver longThis is the updated chart of SILVER long that i posted 3 days back.
Same conditions still intact. A breakout from this pattern can push silver to 156000 Levels.
Keep a check on the chart and the pattern on 4 hour Timeframe of MCX SILVER.
Disclaimer- This is just for educational purpose.
Jai Shree Ram.

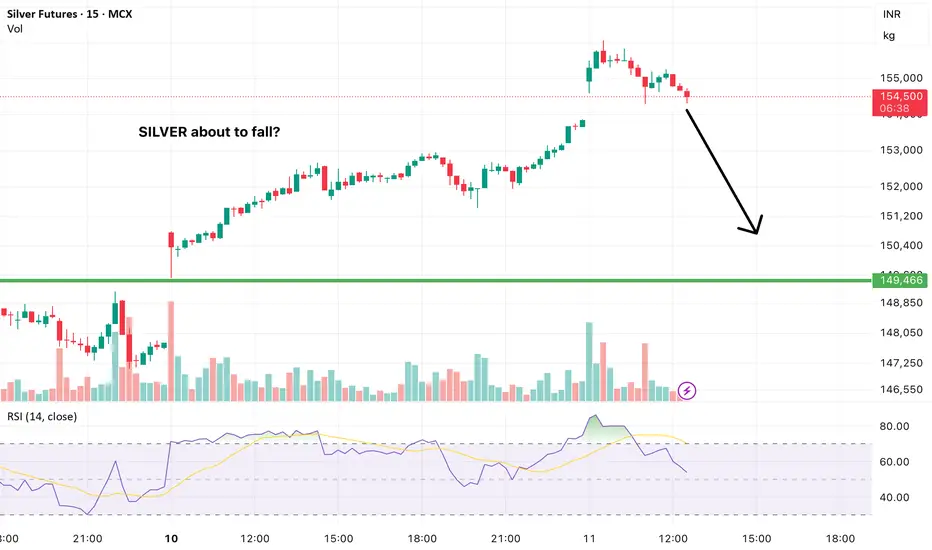
SILVER forming dangerous chart pattern today. Can fall from hereSilver forming negative or weka pattern on 15 minute charts which is indicating pressure from higher levels.
Can fall from here as per this chart pattern
Share this with your friends who trade in Commodities.
This is not an investment advice.
Silver Builds Momentum: Break Above 49.50 in Sight1. What Happened Recently
After rebounding from the 45.50 recent low, Silver rallied strongly into the 49.30–49.50 resistance zone, where it faced short-term selling pressure. A healthy correction followed, taking price back to the 47.00 support area.
2. Market Reaction
From that zone, bulls stepped back in. Since Wednesday last week, the market has been climbing in a constructive and steady manner, suggesting that the correction phase might be complete.
3. Technical Outlook
At the time of writing, Silver is attempting to break above the 49.30–49.50 resistance. If successful, this move could trigger a continuation toward the 50.50 zone, which represents the next meaningful resistance on the chart.
The broader structure remains bullish as long as price stays above 48.00, while dips below 49.00 offer good buying opportunities within the trend.
4. Trading Plan
My preferred approach is to buy dips under 49, with a protective invalidation under 48. First profit targets lie near 50.50, with potential extensions if momentum persists.
5. Conclusion
Momentum has shifted firmly back in favor of the bulls. As long as 48 holds, Silver remains in a bullish phase, and buying dips is the rational play. ⚡️

Stop!Loss|Market View: GOLD🙌 Stop!Loss team welcomes you❗️
In this post, we're going to talk about the near-term outlook for GOLD ☝️
Potential trade setup:
🔔Entry level: 4122.884
💰TP: 3895.119
⛔️SL: 4246.000
"Market View" - a brief analysis of trading instruments, covering the most important aspects of the FOREX market.
👇 In the comments 👇 you can type the trading instrument you'd like to analyze, and we'll talk about it in our next posts.
💬 Description: According to our previous review of this metal, the price is moving according to an alternative scenario, namely, a retest of the 4150-4200 range. Currently, short-term selling is being actively looked for, and the medium-term mood remains focused on levels of 3600-3700. We can expect additional manipulation/a slight move toward 4200 in the near future, but it's not a certain thing that we'll reach this round level, and we could reverse earlier.
Thanks for your support 🚀
Profits for all ✅
❗️ Updates on this idea can be found below 👇

SILVER Strong Supply Area Ahead! Sell!
Hello,Traders!
SILVER tapped into a major supply zone, where liquidity above previous highs got engineered for smart money entries. The structure suggests a bearish continuation toward the next target zone. Time Frame 5H.
Sell!
Comment and subscribe to help us grow!
Check out other forecasts below too!
Disclosure: I am part of Trade Nation's Influencer program and receive a monthly fee for using their TradingView charts in my analysis.

SILVER WILL KEEP GROWING|LONG|
✅SILVER is rallying from a refined demand zone, showing bullish orderflow continuation. With liquidity swept below previous lows, institutions may target the next imbalance near $51.00. Time Frame 3H.
LONG🚀
✅Like and subscribe to never miss a new idea!✅

Silver Tries a Comeback but It Could Depend on the ShutdownSilver is contracting within a triangle-like pattern. After the sharp selloff, it managed to find some balance above the 47.60–47.80 zone and has since regained the 200 SMA on the 60-minute timeframe.
Liquidity constraints tied to QT and the US government shutdown are creating downward pressure on precious metals. These factors are likely to ease once the shutdown and QT end, and the market may start pricing that in early, potentially leading to renewed bullish momentum in the coming days.
The 49.30 level is likely to serve as the trigger for upward movement. Until that resistance breaks, it’s best to remain cautious.

SILVER SENDS CLEAR BEARISH SIGNALS|SHORT
SILVER SIGNAL
Trade Direction: short
Entry Level: 4,984.0
Target Level: 4,875.1
Stop Loss: 5,056.8
RISK PROFILE
Risk level: medium
Suggested risk: 1%
Timeframe: 1h
Disclosure: I am part of Trade Nation's Influencer program and receive a monthly fee for using their TradingView charts in my analysis.
✅LIKE AND COMMENT MY IDEAS✅

XAGUSD H1 | Bullish Bounce off SupportXAGUSD is falling towards our buy entry at 47.95, which is a minor pullback support level, that aligns with the H1 Fair Value Gap and 71% Fibonacci retracement level.
The stop loss is at 47.56, which is a swing low support level, while the take profit is at 48.73, which is a swing high resistance level.
Stratos Markets Limited (tradu.com/uk ):
CFDs are complex instruments and come with a high risk of losing money rapidly due to leverage. 68% of retail investor accounts lose money when trading CFDs with this provider. You should consider whether you understand how CFDs work and whether you can afford to take the high risk of losing your money.
Stratos Europe Ltd (tradu.com/eu ):
CFDs are complex instruments and come with a high risk of losing money rapidly due to leverage. 70% of retail investor accounts lose money when trading CFDs with this provider. You should consider whether you understand how CFDs work and whether you can afford to take the high risk of losing your money.

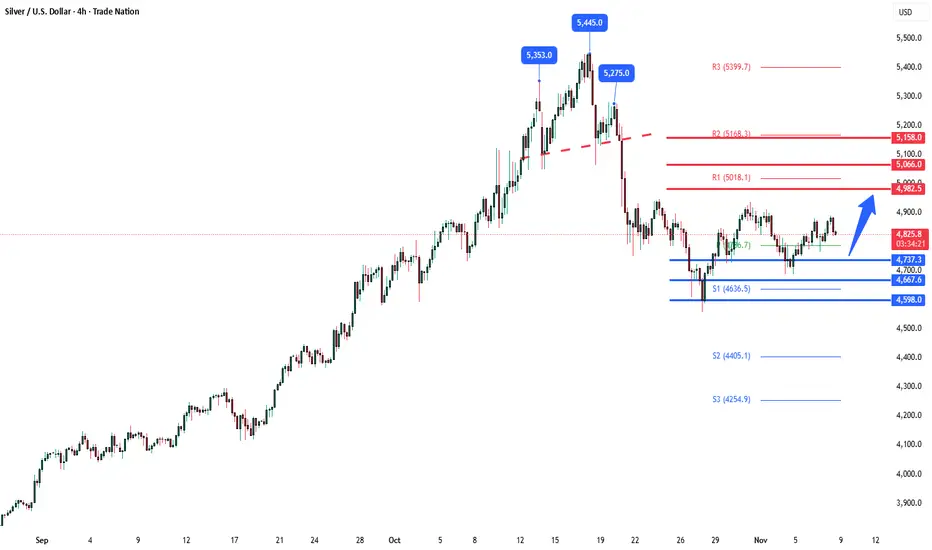
Silver oversold bounce retesting important resistanceSilver remains in a bullish trend, with recent price action showing signs of a corrective pullback within the broader uptrend.
Support Zone: 4737 – a key level from previous consolidation. Price is currently testing or approaching this level.
A bullish rebound from 4737 would confirm ongoing upside momentum, with potential targets at:
4980 – initial resistance
5066 – psychological and structural level
5166 – extended resistance on the longer-term chart
Bearish Scenario:
A confirmed break and daily close below 4737 would weaken the bullish outlook and suggest deeper downside risk toward:
4667 – minor support
4600 – stronger support and potential demand zone
Outlook:
Bullish bias remains intact while the silver holds above 4737. A sustained break below this level could shift momentum to the downside in the short term.
This communication is for informational purposes only and should not be viewed as any form of recommendation as to a particular course of action or as investment advice. It is not intended as an offer or solicitation for the purchase or sale of any financial instrument or as an official confirmation of any transaction. Opinions, estimates and assumptions expressed herein are made as of the date of this communication and are subject to change without notice. This communication has been prepared based upon information, including market prices, data and other information, believed to be reliable; however, Trade Nation does not warrant its completeness or accuracy. All market prices and market data contained in or attached to this communication are indicative and subject to change without notice.

SILVER: Bearish Continuation is Highly Probable! Here is Why:
Looking at the chart of SILVER right now we are seeing some interesting price action on the lower timeframes. Thus a local move down seems to be quite likely.
Disclosure: I am part of Trade Nation's Influencer program and receive a monthly fee for using their TradingView charts in my analysis.
❤️ Please, support our work with like & comment! ❤️

1980 Redux? SILVER set to Outshine the NYSE Composite.Has Silver set the stage to approach its all time high's versus the "Big Index" that was last seen close to 50 years ago.?
Why this chart is spectacular:
Silver has moved sharply higher this year, breaching it's historic $50 threshold, a feat last seen in 1980 and 2011.
Notable the Silver/US Equities ratio (using the TVC:NYA as a broad proxy) is forming a multi year bottom structure. Suggesting we are in the process of a powerful repricing from equities to commodities.
This is not a crash call on Stocks.
Simply put Metals and commodities are just likely be faster horses and receive higher capital allocations.
We've seen the Big short during the GFC.
We've seen Saylor's Big long trade on #BTC
is Silver the Big Reversal?

#DAX at a record ALL TIME HIGHand Yet this move is far from over
My final log target is still 8000 points away.
We are witnessing #Fiat melt away in front of our eyes.
Are you actually making money is the real question?
#gold #silver #bitcoin

Silver, bullish or bearish?Bullish divergence in RSI, an ascending triangle, and a moving average, combined with hitting the neckline, all these indications make Silver a good candidate for a Bullish rally that can reap a 1:3 RRR.

BRIEFING Week #45 : Growth made the TopHere's your weekly update ! Brought to you each weekend with years of track-record history..
Don't forget to hit the like/follow button if you feel like this post deserves it ;)
That's the best way to support me and help pushing this content to other users.
Kindly,
Phil

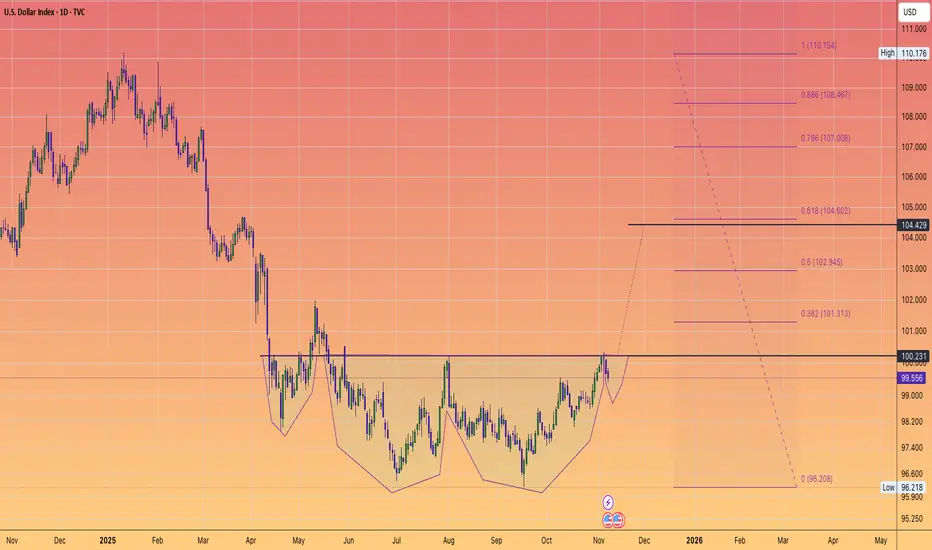
$DXY eye a 5 point move. RISK OFF.The dollar index is reversing course.
And I believe highly likely to trigger this complex inverse head and shoulder's.
A swift move to the 105 region
lines up with a expected downside move in #BTC
A corrective move in the #PreciousMetals
and further profit taking on the #AI trade.
I believe this all could play by Xmas.
So the odds of a #SantaRally are slim given current price action that we are seeing across the board.
Measured move would fill a gap!If this measured move in silver plays out, it would fill an important monthly/weekly/daily gap and retest the $39 breakout line.
We must first watch to see which direction this goes when it escapes the squeezing triangle.

Solver key support at 4737Silver remains in a bullish trend, with recent price action showing signs of a corrective pullback within the broader uptrend.
Support Zone: 4737 – a key level from previous consolidation. Price is currently testing or approaching this level.
A bullish rebound from 4737 would confirm ongoing upside momentum, with potential targets at:
4980 – initial resistance
5066 – psychological and structural level
5166 – extended resistance on the longer-term chart
Bearish Scenario:
A confirmed break and daily close below 4737 would weaken the bullish outlook and suggest deeper downside risk toward:
4667 – minor support
4600 – stronger support and potential demand zone
Outlook:
Bullish bias remains intact while the silver holds above 4737. A sustained break below this level could shift momentum to the downside in the short term.
This communication is for informational purposes only and should not be viewed as any form of recommendation as to a particular course of action or as investment advice. It is not intended as an offer or solicitation for the purchase or sale of any financial instrument or as an official confirmation of any transaction. Opinions, estimates and assumptions expressed herein are made as of the date of this communication and are subject to change without notice. This communication has been prepared based upon information, including market prices, data and other information, believed to be reliable; however, Trade Nation does not warrant its completeness or accuracy. All market prices and market data contained in or attached to this communication are indicative and subject to change without notice.
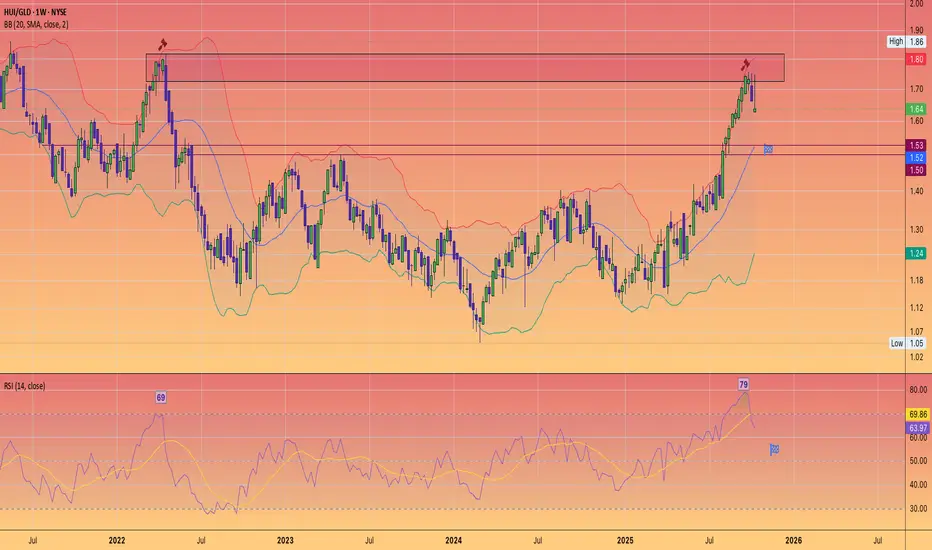
HUI/GLD showing weekly exhaustionUnderstandable given the Euphoria in the Precious metals markets the past two weeks.
Is the Bull Run completely over?
I don't think so.
#Silver has yet to Hit $95
and is merely testing it's own breakout level of its historical all time high's.
As this ratio is indicating the past few weeks it appears it wants to come back into previous resistance zones and also reset the RSI to around 50, so still in a bull market.
Would be a welcome correction.
#JX - Bull Market about to resume, massive inv Head & Shoulders.The Canadian venture index
After completing one Inverse Head and Shoulders that made target and overshot into expected resistance.
Has now setup a massive larger inverse head and shoulders that projects to previous all time high's last seen nearly 20 years ago.
The venture index is full of junior miners and commodity companies that have a letter .v Suffix
Once it has done retracing I expect it to attack the neckline for the Big pattern breakout.

Stop!Loss|Market View: USDJPY🙌 Stop!Loss team welcomes you❗️
In this post, we're going to talk about the near-term outlook for the USDJPY currency pair☝️
Potential trade setup:
🔔Entry level: 154.304
💰TP: 156.111
⛔️SL: 153.446
"Market View" - a brief analysis of trading instruments, covering the most important aspects of the FOREX market.
👇 In the comments 👇 you can type the trading instrument you'd like to analyze, and we'll talk about it in our next posts.
💬 Description: A second test of the 153.446 support level isn't a good buy signal, and it's best to take aside from buy positions near current levels for now. The most attractive option for buyers remains near the 154.310 resistance level. If the price does reach that level soon, it's highly likely that the price will continue moving toward 155-156 as sellers liquidate their positions.
Thanks for your support 🚀
Profits for all ✅
❗️ Updates on this idea can be found below 👇

Silver - The catastrophic rejection!🆘Silver ( TVC:SILVER ) is just collapsing:
🔎Analysis summary:
At this exact moment, Silver is retesting the previous all time highs, which were already rejected about 45 years ago. Considering the extremely bearish rejection on the smaller timeframes, Silver simply fails to break out. This will lead to a devastating reversal.
📝Levels to watch:
$50
SwingTraderPhil
SwingTrading.Simplified. | Investing.Simplified. | #LONGTERMVISION
