Silvers reached a fresh record high due to the short squeezeSilver prices reached an all-time high of over 53 USD/ounce, driven by a significant short squeeze in London. This rally was further fueled by safe-haven demand following the resumption of US-China trade tensions.
US President Trump expressed openness to negotiations after announcing an additional 100% tariff on Chinese goods, but China has not responded. Meanwhile, China's Sep exports surprisingly increased by 8.3% YoY, the fastest pace in six months, driven by demand from countries other than the US. Exports to the US fell 27% YoY due to tariff pressures. This indicates that the additional threat from Trump may not significantly impact China, especially given its crucial role in the AI value chain and its dominance in rare earth production. These elevated tensions could continue to drive markets toward safe-haven assets amid global instability.
On the supply side, the London Bullion Market Association, as reported by Bloomberg, confirmed that it is “aware of tightness in the silver market and is actively monitoring the situation.” Mine production has remained below demand since 2021, primarily due to electrical and electricity demand, especially from photovoltaics, where China is a dominant force. The ongoing supply shortage could continue to support silver prices.
Technically, XAGUSD is showing strong bullish momentum after breaking its previous record high, with both EMAs diverging and extending.
XAGUSD could continue to rise and test the 227.2% Fibonacci extension at 60.
Conversely, price could face take profit pressure after a long rally with the RSI indicates the overbought level (over 88). If the bullish momentum weakens, XAGUSD could test the resistance level at 47.88.
By Van Ha Trinh - Financial Market Strategist at Exness
Silver

Stop!Loss|Market View: GOLD🙌 Stop!Loss team welcomes you❗️
In this post, we're going to talk about the near-term outlook for GOLD ☝️
Potential trade setup:
🔔Entry level: -
💰TP: -
⛔️SL: -
"Market View" - a brief analysis of trading instruments, covering the most important aspects of the FOREX market.
👇 In the comments 👇 you can type the trading instrument you'd like to analyze, and we'll talk about it in our next posts.
💬 Description: Metals continue to demonstrate impressive results. As a result, we are seeing new all-time highs. It's difficult to find any potential buy or sell levels for gold, but we can highlight an area around 4200-4250, where sell trades, especially mid-term, are highly likely to be liquidated. This assumption is based on a 25% price move from the start of the current rally since August, as well as the point of control (POC) of the same rally around 3650. We should likely expect the end of the US shutdown, after which we could see a correction in metals.
Thanks for your support 🚀
Profits for all ✅
❗️ Updates on this idea can be found below 👇

Silver has reached the launchpad.Not only did Silver finally hit a new all time high but even more impressive is that it finally closed a candle above the rimline of the 40 year old cup and handle pattern it has been forming since before I was even born. Considering how long it took to accomplish this I can not in good faith let one daily candle close trick me into thinking that it has validated the breakout but this is definitely a giant leap closer to validating an eventual breakout. I get the feeling people are going to be absolutely mindblown by what silver does when the breakout is validated. We are currently on our way to the dotted red trendline’s target but on the way they we should definitely validate the cup and handle breakout hitch will then has us heading to the exponentially higher dotted green lines target at around $722. Buckle up people and prepare for blastoff in the not so distant future. Also be aware that they could have multiple dips back below then back above and below and above the rimline of the cup (horizontal green line) before the actual breakout. Or it could just send a random moonshot candle up to the target as well n the very first try. Best to be prepared for both possibilities. *not financial advice*

My Thoughts On Investing in SilverVery slow investment and might not be worth it for the everyday millennial... 100% gain for sure this decade though... I do like the consolidation though but GOLD's chart looks better!

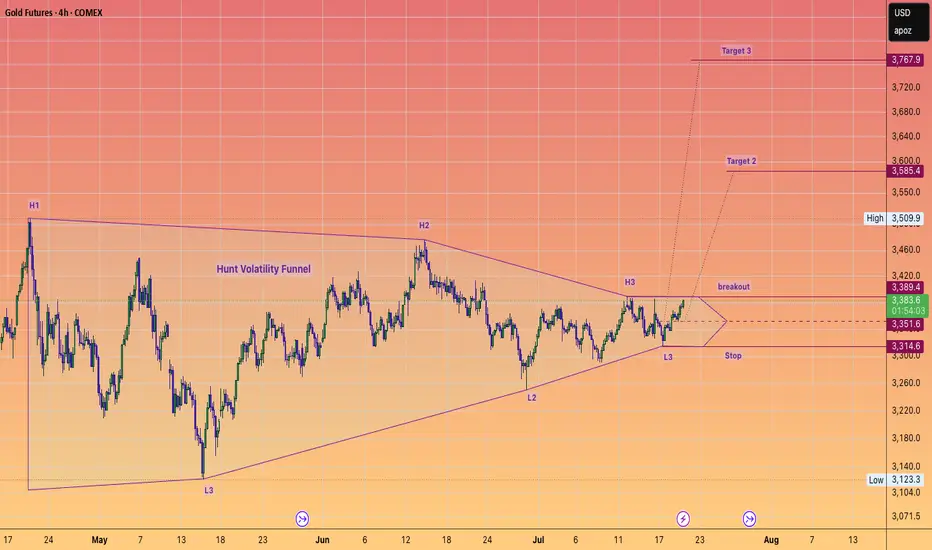
Trade Alert! GOLD to $3800 SOON.#HuntVolatilityFunnel setup which is about to trigger to the upside.
This setup should take gold to or very close to $4K IMHO
#GC
#GOLD
#SILVER
#METALS
Silver Shines — But Caution Ahead?Silver Shines — But Caution Ahead?
- Silver has just hit a fresh all-time high of $51.70, breaking past its 2011 record.
- However, the monthly RSI is racing toward the extreme 85.00 zone, a level that previously marked major tops in 2006, 2008, and 2011.
Momentum remains strong, but history suggests (as shown in the monthly Silver Chart) that when RSI enters this zone, sharp pullbacks tend to follow.
I don't mean, the the rally is over — but it's just a reminder that every time a steep vertical move is often followed by high volatility (volatility might invite pullbacks).

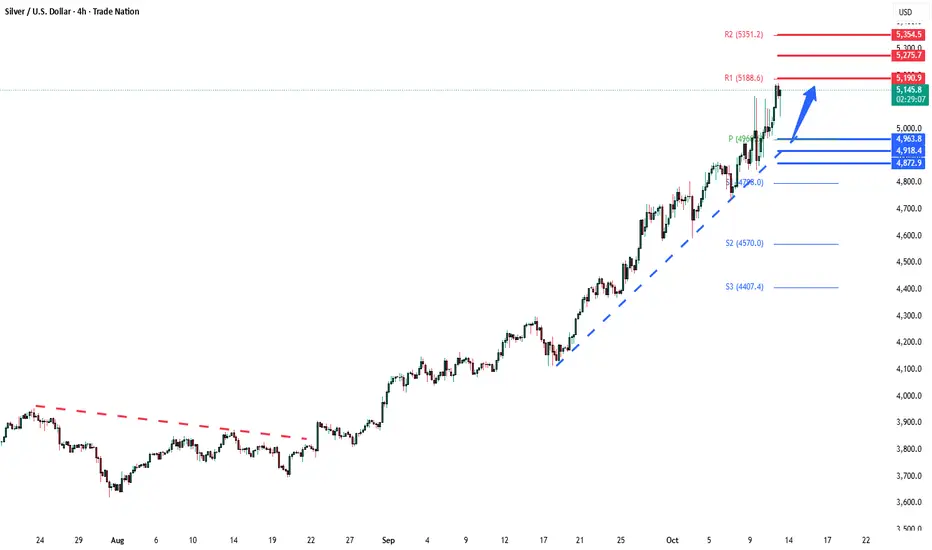
Silver bullish breakout supported at 4964The Silver remains in a bullish trend, with recent price action showing signs of a continuation breakout within the broader uptrend.
Support Zone: 4964 – a key level from previous consolidation. Price is currently testing or approaching this level.
A bullish rebound from 4964 would confirm ongoing upside momentum, with potential targets at:
5190 – initial resistance
5275 – psychological and structural level
5355 – extended resistance on the longer-term chart
Bearish Scenario:
A confirmed break and daily close below 4964 would weaken the bullish outlook and suggest deeper downside risk toward:
4920 – minor support
4870 – stronger support and potential demand zone
Outlook:
Bullish bias remains intact while the silver holds above 4964. A sustained break below this level could shift momentum to the downside in the short term.
This communication is for informational purposes only and should not be viewed as any form of recommendation as to a particular course of action or as investment advice. It is not intended as an offer or solicitation for the purchase or sale of any financial instrument or as an official confirmation of any transaction. Opinions, estimates and assumptions expressed herein are made as of the date of this communication and are subject to change without notice. This communication has been prepared based upon information, including market prices, data and other information, believed to be reliable; however, Trade Nation does not warrant its completeness or accuracy. All market prices and market data contained in or attached to this communication are indicative and subject to change without notice.
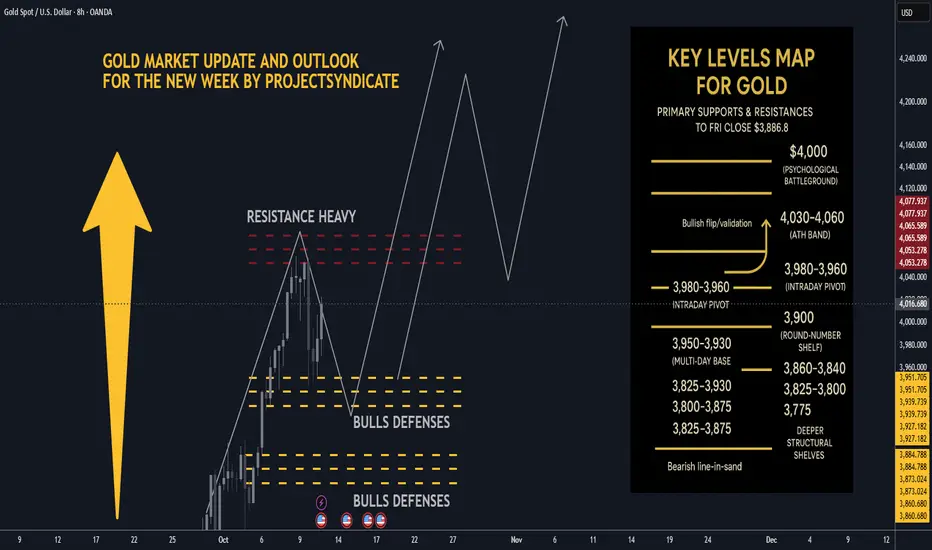
Gold next week: Key S/R Levels and Outlook for Traders🏆 Friday’s Close & Recent ATH:
Gold XAUUSD closed Friday around ~$3,990–$4,020/oz depending on venue most consolidated feeds show prints near $3.99–$4.02k at Friday close. The nearest recent intraday highs printed in the $4,030–$4,060 area across data providers this week, putting $4,000 as the immediate psychological battleground and $4,050–$4,060 as the latest short-term ATH band. YTD performance remains extraordinary 2025 YTD still showing a very large gain.
📈 Trend Structure:
Price continues to track a well-defined ascending channel on 1H/4H with clear impulsive legs out of recent consolidations. Market character = higher highs / higher lows, persistent dip-buying, and strong trend adherence into quarter-turn 25/50 handles near round thousands. Momentum has been resilient into week-end despite tariff headlines, suggesting structural demand and participation from official buyers.
🔑 Key Resistance Levels:
The most critical resistances to watch updated from Friday close ≈ $4,000:
• 4000 — immediate psychological round-number battleground.
• 4,030–4,060 — recent intraday ATH band / short-term supply recent highs printed here across venues.
• 4,075 → 4,100 — measured move / extension band if acceptance above the ATH zone occurs.
• 4,150–4,200 — stretch momentum targets on sustained risk-off and break/acceptance above 4,100 structural extension.
Quick note: different data vendors quote small differences in ticks — I used consolidated high prints to identify the ATH band.
🛡️ Support Zones:
Immediate supports step down as follows
• 3,980–3,960 intraday pivot just under Friday close.
• 3,950–3,930 multi-day base / near-week lows.
• 3,900–3,888 round-number shelf and the prior week’s consolidation band.
• Deeper structural shelves: 3,860–3,840, 3,825, 3,800 → 3,775.
A sustained break below ~3,900–3,888 would signal increasing corrective risk; daily close under ~3,825 would more clearly shift the regime.
⚖️ Likely Scenarios:
• Scenario 1 Base Case – Controlled dip toward 3,950–3,930 or the 3,900 area to reload bids, then rotation higher toward 4,030–4,060 as buyers re-engage.
• Scenario 2 Momentum Break – Quick clearance of the 4,030–4,060 ATH band → sustained acceptance above 4,075–4,100, unleashing momentum into 4,150–4,200. Overbought readings exist intraday, but structural demand has kept pullbacks shallow.
📊 Short-Term Targets:
On continuation: 4,020 → 4,030–4,060 → 4,075 → 4,100, with 4,150–4,200 as higher extensions if acceptance holds.
On retrace: 3,980 → 3,950 → 3,930 → 3,900 as the key retrace ladder.
💡 Market Sentiment Drivers updated:
• Tariff shock / geopolitical risk: President Trump announced proposals for large new tariffs reports of a 100% tariff threat and expanded export controls on Chinese imports this week, escalating trade-war risk and knocking risk sentiment — that increases safe-haven demand for gold. News outlets Reuters, AP, WaPo and market reactions were visible Friday.
• Rate & policy expectations: Markets continue to price material odds of rate easing/softer Fed path relative to earlier in the year; that reduces real yields and supports gold. Feeds and FedWatch implied pricing show elevated cut odds that underpin lower opportunity cost for gold.
• Official demand: Central bank buying has remained constructive — WGC/official stats show continued net purchases in recent months monthly buying rebounded in August. This adds structural support to dips.
• Macro/flow: Risk-off from tariff headlines, rare-earth export controls, and supply-chain concerns are the immediate drivers that could catalyze pushes toward the ATH band.
🔄 Retracement Outlook:
A tag of 3,950–3,930 or a short stop-run into 3,900–3,888 would be a typical healthy pullback inside the trend. Fast reclaim of the first support band after a liquidity flush often precedes fresh ATH tests. Breaks under 3,900 that fail to reclaim quickly increase the probability of a deeper slide into the 3,860–3,825 shelf.
🧭 Risk Levels to Watch:
• Bullish structure intact: holding above ~3,950–3,930 or more conservatively, above 3,900 keeps the bull case intact.
• Bearish line-in-sand: daily close < 3,825 weakens trend; daily close < 3,775–3,750 signals a bigger corrective phase and opens lower targets.
🚀 Overall Weekly Outlook:
Gold remains in a strong uptrend with $4,020–$4,030/ATH band $4,030–$4,060 → $4,000 as the immediate battleground after Friday’s close. Expect buyable dips while supports hold; the topside roadmap favors 4,075–4,100 and 4,150–4,200 as measured extensions if the market digests tariff news into a longer-running risk-off regime.
Gold Bull Markets Long Term Overview and 2025 Market UpdateGold Bull Markets Long Term Overview and 2025 Market Update
________________________________________
• This cycle is different: record central-bank buying + renewed ETF inflows + lower real rates = powerful tailwind.
• Price: Gold notched fresh ATHs this month (up to $3,790.82). 2025 is shaping up as the strongest year since the late 1970s.
• Relative: Gold is crushing equities YTD (≈+40% vs S&P 500 ≈+13% total return).
• Setup: A 13-year “cup-and-handle” breakout in 2024 kick-started the move.
• Outlook: Base case from the Street: $3,700 by end-’25 and ~$4,000 by mid-’26; upside to $4,500 if flows accelerate.
________________________________________
🏆 Historic Gold Bull Markets — Timeline & Stats
1) 1968–1980 “Super Bull”
• Start/End: ~$35 → $850 (Jan 1980)
• Gain: ~2,330%
• Drivers: End of Bretton Woods, oil shocks, double-digit inflation, geopolitical stress.
• Drawdown: ~–45% (1974–1976) before the final blow-off run.
2) 1999–2011/12
• Start/Peak: ~$252 (1999) → ~$1,920 (2011–12)
• Gain: ~650%
• Drivers: Commodities supercycle, EM demand, USD weakness, GFC safe-haven bid.
3) 2016/2018–Present (The “CB-Led” Cycle)
• Start Zone: $1,050–$1,200 → New ATH $3,790 (Sep 2025)
• Gain: ~215–260% (depending on 2016 vs 2018 anchor)
• Drivers: Record central-bank accumulation, sticky inflation/low real rates, geopolitics; 2024 13-yr base breakout.
________________________________________
📊 At-A-Glance Comparison (Updated 2025)
Metric 1968–80 Super Bull 1999–2012 2016/18–2025 Current
🚀 Total Gain ~2,330% ~650% ~215–260% (so far)
⏲️ Duration 12 yrs 13 yrs 7–9 yrs (ongoing)
💔 Max Drawdown ~–45% (’74–’76) ~–30% (’08) ~–20% (2022)
🏦 Main Buyer Retail/Europe Funds/EM Central Banks (dominant)
🏛️ Pattern Secular parabolic Cyclical ramps 13-yr base → breakout (’24)
Notes: current cycle characteristics validated by WGC demand trends & technical breakout in Mar 2024.
________________________________________
📈 Top 10 Stats of the Current Bull (2025)
1. Price & ATHs: Spot $3,75–$3,79k; fresh ATH $3,790.82 on Sep 23, 2025.
2. 2025 YTD: Roughly +40–43% YTD (best since the late ’70s).
3. Central Banks: 1,045 t added in 2024 (3rd straight 1k+ year). H1’25 ≈ 415 t (still elevated).
4. ETF Flows: Strongest half-year inflows since 2020, aiding the surge.
5. Gold vs Equities: Gold ≈+40% vs S&P 500 ≈+13% total return YTD.
6. Jewelry Demand: Price strength is crimping tonnage (2024 down ~11%; Q2’25 –14% y/y), even as value hits records.
7. Gold–Silver Ratio: Now around ~85–88 (silver catching up as it pushes $43–$44).
8. Macro Link: Strong safe-haven bid + rate-cut hopes supporting new highs.
9. Technical: Confirmed cup-and-handle breakout (Mar ’24) underpinning trend.
10. Street Forecasts: DB lifts 2026 to $4,000; GS baseline $4,000 by mid-’26, upside $4,500 with bigger private-investor rotation.
________________________________________
🔄 What Makes This Bull Different (2025 Edition)
• 🏦 Central-Bank Dominance — Official sector is the anchor buyer (3rd straight 1k+ tonne year in 2024; 2025 tracking strong despite Q2 deceleration).
• ⚡ Faster Recoveries — Pullbacks have been shallower and shorter vs the 1970s analog.
• 📈 Coexisting With Risk Assets — Rare combo: gold ATHs with equities up YTD suggests a macro hedge bid alongside optimism in select risk assets.
• 📐 Structural Breakout — The 13-year base cleared in 2024 set multi-year targets.
________________________________________
🎯 Strategy Ideas (2025 & Beyond)
Core
• Buy/Hold on Dips: Stagger entries (DCA) into physical (allocated), ETFs (e.g., GLD/IAU), and quality miners/royalties.
• Prefer Physical/Allocated where counterparty risk matters; use ETFs for liquidity.
Satellite/Leverage
• Silver & GSR Mean-Reversion: With the GSR ~85–88, silver historically offers torque in up-legs. Pair with high-quality silver miners.
• Factor Tilt in Miners: Focus on low AISC, strong balance sheets, growing reserves, and jurisdictions with rule-of-law.
Risk-Management
• Define max drawdown tolerance per sleeve; pre-plan trims near parabolic extensions or if macro invalidates (e.g., real-yield spike).
________________________________________
🧪 Reality Check: What Could Invalidate the Bull?
• Real yields + USD rip higher (sustained), dampening non-yielding assets.
• Sharp halt in official-sector buying (e.g., policy shifts).
• Rapid growth re-acceleration reducing safe-haven & rate-cut expectations.
________________________________________
🧭 Quick Reference Tables
🧾 Summary: Historic vs Current
Feature 1968–80 1999–2012 2016/18–2025
Total Gain ~2,330% ~650% ~215–260%
Duration 12 yrs 13 yrs 7–9 yrs (ongoing)
Correction ~–45% ~–30% ~–20% (’22)
Main Buyer Retail/Europe Funds/EM Central Banks
Pattern Parabolic Cyclical Cup & Handle → Secular
🧩 “If-This-Then-That” Playbook
• If real yields fall & CB buying persists → Ride trend / add on consolidations.
• If USD + real yields jump → Trim beta, keep core hedge.
• If GSR stays >80 with silver momentum → Overweight silver sleeve for torque.
________________________________________
🧠 Outside-the-Box Adds
💼 Role in a Portfolio (example frameworks)
• Resilience sleeve (5–10%): Physical + broad ETF.
• Offense sleeve (2–5%): Quality miners/royalties; optional silver tilt.
• Tactical (0–3%): Trend-following overlay (breakouts/consolidations).
🧭 Decision Checkpoints (quarterly)
• Central-bank net purchases (WGC).
• ETF flows (Western markets).
• Real yields (10y TIPS), USD trend, and GSR.
________________________________________
🔚 Key Takeaways (Updated)
• Relentless official-sector demand + technical breakout are the twin pillars of this cycle.
• Macro mix (policy easing expectations, geopolitics, diversification from USD reserves) supports an extended run.
• Base case: Street sees $3.7k by end-’25 and ~$4k by mid-’26, with upside to $4.5k if private capital rotation accelerates. Manage risk; embrace volatility.

SILVER SELLERS WILL DOMINATE THE MARKET|SHORT
SILVER SIGNAL
Trade Direction: short
Entry Level: 5,140.8
Target Level: 5,029.5
Stop Loss: 5,214.4
RISK PROFILE
Risk level: medium
Suggested risk: 1%
Timeframe: 1h
Disclosure: I am part of Trade Nation's Influencer program and receive a monthly fee for using their TradingView charts in my analysis.
✅LIKE AND COMMENT MY IDEAS✅

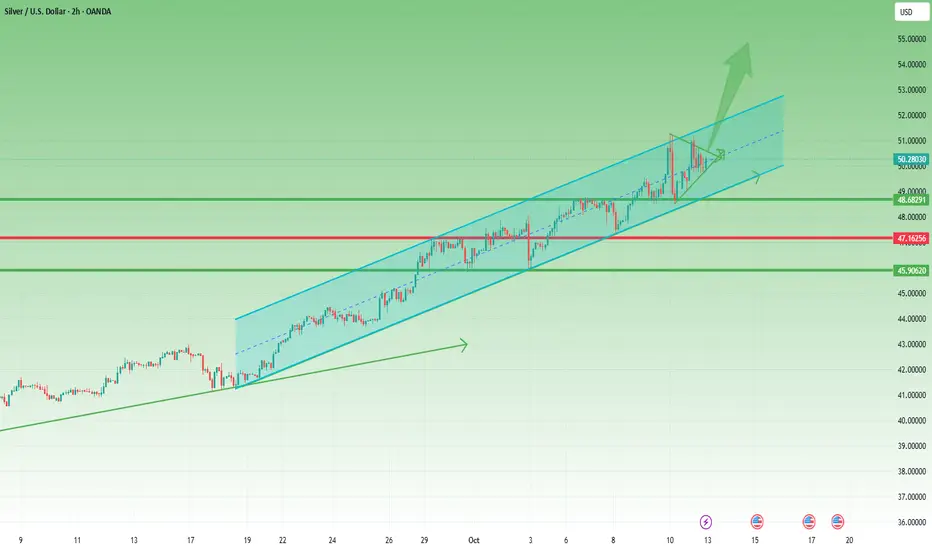
Silver: New ATH, Sharp Pullback, and What Comes NextLast week, something traders had been waiting for finally happened — Silver reached a new all-time high, touching 51.30 before a strong 3,000-pip selloff followed.
However, looking closely at the chart, we can see that this decline stopped precisely at the confluence of horizontal support and the ascending channel’s lower boundary — a technical level that often attracts renewed buying interest.
In my Friday’s analysis, I mentioned that although Silver looked very strong, traders should watch the ATH zone and the channel’s upper resistance for potential pullbacks. Indeed, XAGUSD reacted exactly from that area and corrected lower.
Now, things get very interesting:
1. Strong demand near $50 – Despite the initial drop on Friday, Silver built a solid floor just under the 50 level, suggesting that buyers remain in control and the recent ATH might just be a prelude to new highs.
2. Holding above the median line – The price is hovering around the channel’s midline without testing the lower boundary, a clear sign of underlying strength.
3. Potential pennant formation – Although not perfectly shaped, the price action since Thursday resembles a small pennant, which is typically a continuation pattern in bullish trends.
Putting these clues together, the technical picture still favors the upside, with confirmation coming if price sustains above the 50.50–50.70 zone.
If that happens, considering Silver’s recent momentum, we could easily see $55 as the next target in the coming week.
As long as $49 remains intact, my plan stays simple — buy the dips. 🚀
SILVER (XAGUSD) 15M – Bearish Rejection Setup Ahead TVC:SILVER
Structure | Trend | Key Reaction Zones
Price reached the accumulation + resistance zone, facing repeated rejections.
Structure is forming a lower-high pattern beneath the descending trendline.
If the rejection confirms, a sharp drop toward the next liquidity pool (49.00 area) can follow.
Market Overview
Silver has been ranging within a broad accumulation zone after rejecting the upper resistance region around 50.8–51.2. The market shows weakness near the top of the channel, hinting at a bearish continuation phase. If momentum fails to break above the diagonal resistance, a downside move toward 49.5–49.0 becomes highly probable before a possible reaction from the strong demand box.
Key Scenarios
✅ Bearish Case 📉 → 🎯 Target 1: 49.52 | 🎯 Target 2: 49.03 | 🎯 Target 3: 48.70
❌ Bullish Case 🚀 → 🎯 Target 1: 50.80 | 🎯 Target 2: 51.20 (if resistance breaks cleanly)
Current Levels to Watch
Resistance 🔴 : 50.80 – 51.20
Support 🟢 : 49.50 – 49.00 – 48.70
⚠️ Disclaimer: For educational purposes only. Not financial advice.

BRIEFING Week #41 : Havoc on CryptosHere's your weekly update ! Brought to you each weekend with years of track-record history..
Don't forget to hit the like/follow button if you feel like this post deserves it ;)
That's the best way to support me and help pushing this content to other users.
Kindly,
Phil

Gold’s Playbook Repeating in Silver?HI GUYS!
History doesn’t repeat, but in the markets, it often rhymes, and silver’s chart looks eerily familiar.
Gold’s long-term cup-and-handle pattern between 2013–2023 led to a massive breakout above $4,000. Now, silver appears to be tracing the same formation, just a few years behind.
Silver’s cup (2011–2024) has completed, and its handle (a descending channel) is forming right where gold’s did before it launched.
The measured target? Around $200+ USD, a level that would mark a historic revaluation of the metal.
With industrial demand rising and monetary uncertainty persisting, silver could soon follow gold’s lead, turning this technical Deja vu into a full-blown breakout.
History’s playbook is open. Silver might be next.

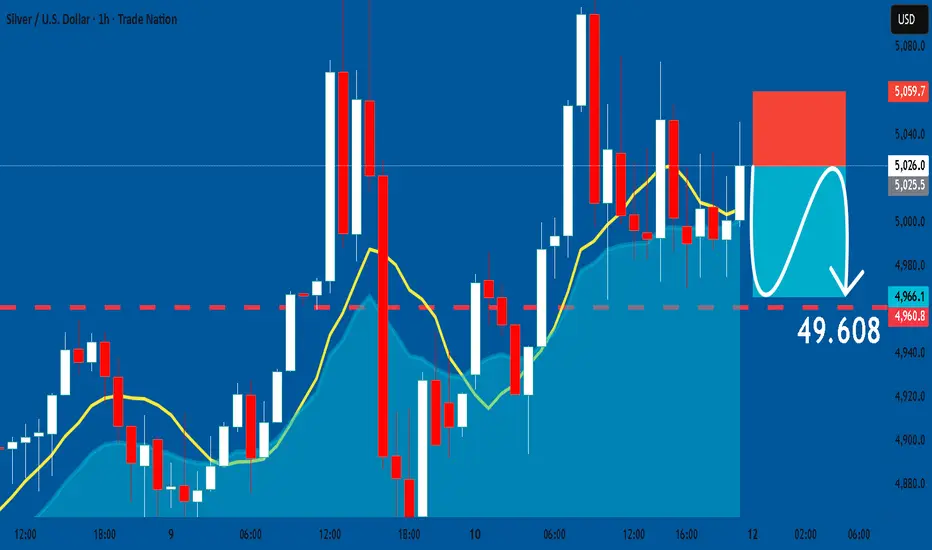
SILVER: Short Trade Explained
SILVER
- Classic bearish pattern
- Our team expects retracement
SUGGESTED TRADE:
Swing Trade
Sell SILVER
Entry - 50.260
Stop - 50.597
Take - 49.608
Our Risk - 1%
Start protection of your profits from lower levels
Disclosure: I am part of Trade Nation's Influencer program and receive a monthly fee for using their TradingView charts in my analysis.
❤️ Please, support our work with like & comment! ❤️
Silver Long-Term Outlook: Wyckoff, Fibonacci & Volunacci in PlayOn the monthly chart, Silver is showing a strong setup for long-term investors. We can clearly identify two adjacent Wyckoff accumulation patterns, signaling institutional accumulation phases.
Price action is following an ascending Fibonacci channel, reflecting a steady bullish structure. After breaking out of the second Wyckoff pattern, a Volunacci projection has formed—pointing toward a potential move to retest its historical high near $48.
This alignment of classic technical patterns with volume-based projection tools strengthens the long-term bullish case for Silver.

SILVER Buyers In Panic! SELL!
My dear friends,
SILVER looks like it will make a good move, and here are the details:
The market is trading on 5026.1 pivot level.
Bias - Bearish
Technical Indicators: Supper Trend generates a clear short signal while Pivot Point HL is currently determining the overall Bearish trend of the market.
Goal - 4968.0
Recommended Stop Loss - 5062.5
About Used Indicators:
Pivot points are a great way to identify areas of support and resistance, but they work best when combined with other kinds of technical analysis
Disclosure: I am part of Trade Nation's Influencer program and receive a monthly fee for using their TradingView charts in my analysis.
———————————
WISH YOU ALL LUCK

#XAGUSD: A Strong Bullish Move, Possible Target at $45?Silver is currently experiencing a correction, but the overall price remains bullish. Analysing the data, we can see a potential price reversal in our area of interest. Following the recent higher high, price is poised to create another record high. We should closely monitor volume and price behaviour. A strong volume signal would indicate a potential bullish move in the future.
Good luck and trade safely.
Like and comment for more!
Team Setupsfx_

Silver Bullet/Rocket Schedule. 11/Oct/25XAGUSD rocket launching might failed again on 3rd attempt at 56 +/- latitude on early 2026..before successfully shooting to outer space

$USGRES - U.S Gold Reserves (October/2025)ECONOMICS:USGRES
October/2025
source: World Gold Council
-The U.S Treasury's Gold Reserves ECONOMICS:USGRES have surpassed 1$ Trillion Dollars in
Value for the first time in History;
more than 90 times what's stated on the Government's Balance Sheet.
United States now holds 2.4 Times more Gold than Germany,
the second largest Gold holder in the World.
Not even the 2020 Pandemic Crisis, 2008 Financial Crisis or Dot.Com Bubble saw
TVC:GOLD post a 40% Annual Gain.
As The U.S Dollar TVC:DXY continues to lose Purchasing Power,
Safe Heaven assets like TVC:GOLD , TVC:SILVER and CRYPTOCAP:BTC continue their
Uptrend Resumption .

Silver uptrend support at 4900The Silver remains in a bullish trend, with recent price action showing signs of a continuation breakout within the broader uptrend.
Support Zone: 4900 – a key level from previous consolidation. Price is currently testing or approaching this level.
A bullish rebound from 4900 would confirm ongoing upside momentum, with potential targets at:
5110 – initial resistance
5155 – psychological and structural level
5200 – extended resistance on the longer-term chart
Bearish Scenario:
A confirmed break and daily close below 4900 would weaken the bullish outlook and suggest deeper downside risk toward:
4848 – minor support
4775 – stronger support and potential demand zone
Outlook:
Bullish bias remains intact while the silver holds above 4900. A sustained break below this level could shift momentum to the downside in the short term.
This communication is for informational purposes only and should not be viewed as any form of recommendation as to a particular course of action or as investment advice. It is not intended as an offer or solicitation for the purchase or sale of any financial instrument or as an official confirmation of any transaction. Opinions, estimates and assumptions expressed herein are made as of the date of this communication and are subject to change without notice. This communication has been prepared based upon information, including market prices, data and other information, believed to be reliable; however, Trade Nation does not warrant its completeness or accuracy. All market prices and market data contained in or attached to this communication are indicative and subject to change without notice.

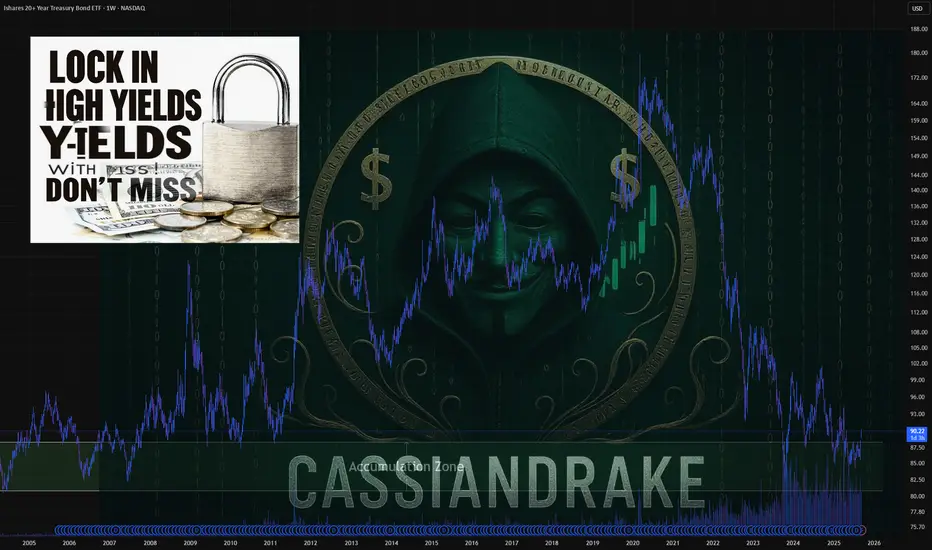
Why Now is the Best Time to Load Up on T-BillsIn 2025, investors have a unique opportunity to capitalize on high yields from Treasury Bills (T-Bills) as interest rates hover at their highest levels in years. With indications that the Federal Reserve may soon start cutting rates, now could be the ideal time to invest in T-Bills through the TLT ETF. This article explores why investing in T-Bills now could reap significant returns over the next decade.
Key Points:
Highest Interest Rates in Years:
Current interest rates on T-Bills are elevated, offering attractive yields for investors.
Historical data shows that such high yield opportunities are rare and may not be seen again for years.
Federal Reserve Rate Cut Expectations:
The Federal Reserve has signaled potential rate cuts due to concerns about job market stability and inflation trends.
Market expectations suggest that rate cuts may begin later in 2025, which could reduce yields on T-Bills in the future.
Strategic Advantage of T-Bills:
Investing now allows investors to lock in current high yields before potential rate cuts reduce returns.
T-Bills offer a safe investment with guaranteed returns, backed by the U.S. government, making them a low-risk option.
Why TLT ETF?
The TLT ETF provides exposure to long-term Treasury securities, making it an excellent vehicle for capitalizing on current high yields.
The advantages of using an ETF include ease of trading and diversification.
Conclusion:
With interest rates at a peak and expectations of future rate cuts, now is a strategic time to invest in T-Bills via the TLT ETF. By taking advantage of the current high yields, investors can secure returns that may not be available again for years to come.
TVC:DXY NASDAQ:MSTR TVC:GOLD TVC:SILVER BITSTAMP:BTCUSD $VNIDIA NASDAQ:TSLA VANTAGE:SP500
Stop!Loss|Market View: NZDUSD🙌 Stop!Loss team welcomes you❗️
In this post, we're going to talk about the near-term outlook for the NZDUSD currency pair☝️
Potential trade setup:
🔔Entry level: 0.57269
💰TP: 0.56494
⛔️SL: 0.57882
"Market View" - a brief analysis of trading instruments, covering the most important aspects of the FOREX market.
👇 In the comments 👇 you can type the trading instrument you'd like to analyze, and we'll talk about it in our next posts.
💬 Description: Bearish mood for the NZDUSD remains. The price is steadily approaching the local low of 0.57550, which will likely lead to a breakout based on technical and fundamental factors. The TVC:DXY is likely to recover to 100-150. Technically, accumulation near 0.57550 indicates sellers are taking the initiative. Global targets can be looked for near 0.55000.
Thanks for your support 🚀
Profits for all ✅
❗️ Updates on this idea can be found below 👇
