Gold (XAUUSD) – Technical Outlook
🟢 Bullish Scenario:
Key Level (Pivot): 3630
If price holds above 3630, bullish momentum may extend towards:
🎯 First target: 3656 (resistance)
🎯 If 3656 breaks strongly → continuation towards:
🎯 Second target: 3675
🎯 Third target: 3697
🔴 Bearish Scenario:
If price fails and sustains below 3630, bearish move may develop towards:
🎯 First support: 3595 (a strong support zone)
🎯 If 3595 breaks decisively → continuation towards:
🎯 Second target: 3546
📌 Summary:
3630 = decision zone
3656, 3675, 3697 = upside targets
3595, 3546 = downside targets
Silver

Silver/USD:Poised for a Breakout After 50 Years of ConsolidationIn my latest analysis of the Silver/USD chart, I've identified a significant resistance level at $48 USD. This level has been a formidable barrier for decades, but a breakout could signal a major shift. If Silver/USD manages to break through this resistance, we could see a target of $580 USD, representing a substantial upside potential.
Historically, after breaking out, assets often retest previous highs, so a retest of the $48 level might occur before a sustained move higher. This setup comes after an unprecedented 50-year consolidation period, suggesting that Silver/USD is gearing up for a long-term trend. This trade could unfold over the next five years, offering a compelling opportunity for long-term investors.

Gold | H4 Double Top | GTradingMethodHello Traders,
🧐 Market Overview:
Over the last 3 weeks, gold has rallied just under 10% — a massive move. While my longer-term outlook remains bullish, my system is currently flagging a potential short. On the 4-hour chart, a double top pattern is forming, signaling a possible pullback.
My system looks for rsi divergence, which is currently present. It also needs to see lower volume on the second top, also already confirmed.
My system has given the green light for opening a short. Now I am just waiting for a good entry point. Time to be patient and follow all my rules.
📊 Trade Plan:
Risk/Reward: 3.5
Entry: 3 664.5
Stop Loss: 3 691.4
Take Profit 1 (50%): 3 592
Take Profit 2 (50%): 3 551
💡 GTradingMethod Tip:
Trading is about probability. This means I need to take every single trade when my edge is available. It also means I need to follow my rules on every single trade.
🙏 Thanks for checking out my post!
Follow me for more setups and let me know — do you think gold will respect this double top or continue its bullish momentum?
📌 Disclaimer:
This is not financial advice. This content is to track my trading journey and for educational purposes only.

Silver Bullish breakout continuation supported at 4144The Silver remains in a bullish trend, with recent price action showing signs of a continuation breakout within the broader uptrend.
Support Zone: 4144 – a key level from previous consolidation. Price is currently testing or approaching this level.
A bullish rebound from 4144 would confirm ongoing upside momentum, with potential targets at:
4260 – initial resistance
4320 – psychological and structural level
4375 – extended resistance on the longer-term chart
Bearish Scenario:
A confirmed break and daily close below 4144 would weaken the bullish outlook and suggest deeper downside risk toward:
4065 – minor support
4020 – stronger support and potential demand zone
Outlook:
Bullish bias remains intact while the silver holds above 4144. A sustained break below this level could shift momentum to the downside in the short term.
This communication is for informational purposes only and should not be viewed as any form of recommendation as to a particular course of action or as investment advice. It is not intended as an offer or solicitation for the purchase or sale of any financial instrument or as an official confirmation of any transaction. Opinions, estimates and assumptions expressed herein are made as of the date of this communication and are subject to change without notice. This communication has been prepared based upon information, including market prices, data and other information, believed to be reliable; however, Trade Nation does not warrant its completeness or accuracy. All market prices and market data contained in or attached to this communication are indicative and subject to change without notice.

XAGUSD H1 | Price retracing into support levelSilver (XAG/USD) is falling towards the buy entry, which is a pullback support that aligns with the 61.8% Fibonacci retracement and could bounce from this level to the take profit.
Buy entry is at 41.20, which is a pullback support that aligns with the 61.8% Fibonacci retracement.
Stop loss is at 40.76, which is a pullback support level.
Take profit is at 41.64, which is a swing high resistance level.
High Risk Investment Warning
Trading Forex/CFDs on margin carries a high level of risk and may not be suitable for all investors. Leverage can work against you.
Stratos Markets Limited (tradu.com ):
CFDs are complex instruments and come with a high risk of losing money rapidly due to leverage. 65% of retail investor accounts lose money when trading CFDs with this provider. You should consider whether you understand how CFDs work and whether you can afford to take the high risk of losing your money.
Stratos Europe Ltd (tradu.com ):
CFDs are complex instruments and come with a high risk of losing money rapidly due to leverage. 66% of retail investor accounts lose money when trading CFDs with this provider. You should consider whether you understand how CFDs work and whether you can afford to take the high risk of losing your money.
Stratos Global LLC (tradu.com ):
Losses can exceed deposits.
Please be advised that the information presented on TradingView is provided to Tradu (‘Company’, ‘we’) by a third-party provider (‘TFA Global Pte Ltd’). Please be reminded that you are solely responsible for the trading decisions on your account. There is a very high degree of risk involved in trading. Any information and/or content is intended entirely for research, educational and informational purposes only and does not constitute investment or consultation advice or investment strategy. The information is not tailored to the investment needs of any specific person and therefore does not involve a consideration of any of the investment objectives, financial situation or needs of any viewer that may receive it. Kindly also note that past performance is not a reliable indicator of future results. Actual results may differ materially from those anticipated in forward-looking or past performance statements. We assume no liability as to the accuracy or completeness of any of the information and/or content provided herein and the Company cannot be held responsible for any omission, mistake nor for any loss or damage including without limitation to any loss of profit which may arise from reliance on any information supplied by TFA Global Pte Ltd.
The speaker(s) is neither an employee, agent nor representative of Tradu and is therefore acting independently. The opinions given are their own, constitute general market commentary, and do not constitute the opinion or advice of Tradu or any form of personal or investment advice. Tradu neither endorses nor guarantees offerings of third-party speakers, nor is Tradu responsible for the content, veracity or opinions of third-party speakers, presenters or participants.

Gold (XAUUSD) Technical Outlook
🟢 Bullish Scenario:
Key level: 3612
If the price holds above 3612, the bullish momentum is likely to continue towards:
🎯 First target: 3656
🎯 Second target: 3675
🎯 Third target: 3697 (if 3656 breaks strongly)
🔴 Bearish Scenario:
If the price breaks and sustains below 3612, the downside move may extend towards:
🎯 First support: 3595 (a strong support zone)
🎯 If this level breaks and price sustains below ➝ further decline towards:
🎯 Second target: 3546
📌 Summary:
3612 = key decision level
3656, 3675, 3697 = upside targets
3595, 3546 = downside targets

Silver Near PRZ – Bearish Reversal Incoming?Today I want to share with you an analysis of SILVER ( OANDA:XAGUSD ). In my opinion, in terms of technical analysis , Silver has a more regular chart than Gold( OANDA:XAUUSD ) these days.
Silver is currently trading near the Resistance line , Important Resistance lines , Yearly Resistance(2) and Potential Reversal Zone(PRZ) .
In terms of Elliott wave theory , it seems that Silver has managed to complete microwave 3 of the main wave 5 , and after the support lines are broken, we can expect a decline and completion of microwave 4 . The end of microwave 4 could follow Fibonacci levels .
Also, we can see the Regular Divergence(RD-) between Consecutive Peaks .
I expect Silver to fall to at least $40.51(First Target) AFTER breaking the support lines .
Second Target: $39.81
Stop Loss(SL): $42.18
Note: Today's US data release could cause a shock to Silver, but ultimately, Silver will continue its downward trend (at least to the first target).
Please respect each other's ideas and express them politely if you agree or disagree.
Silver/ U.S. Dollar Analyze (XAGUSD), 4-hour time frame.
Be sure to follow the updated ideas.
Do not forget to put a Stop loss for your positions (For every position you want to open).
Please follow your strategy and updates; this is just my Idea, and I will gladly see your ideas in this post.
Please do not forget the ✅' like '✅ button 🙏😊 & Share it with your friends; thanks, and Trade safe.

Silver Daily Channel After Breaking Above Major ResistanceI identified this channel at the beginning of August, and it has worked quite well for position trades to date. As daily fluctuations evolve, I may make minor adjustments to this channel using significant lows from the past, present, or future.
The following is my August video explaining the construction of the channel:
Micro Silver Futures
Ticker: SIL
Minimum fluctuation:
0.005 per troy ounce = $5.00
Disclaimer:
• What presented here is not a recommendation, please consult your licensed broker.
• Our mission is to create lateral thinking skills for every investor and trader, knowing when to take a calculated risk with market uncertainty and a bolder risk when opportunity arises.
CME Real-time Market Data help identify trading set-ups in real-time and express my market views. If you have futures in your trading portfolio, you can check out on CME Group data plans available that suit your trading needs tradingview.com/cme/

EUR/USD | Euro Rejected, Eyeing 1.168 & 1.166 (READ THE CAPTION)By analyzing the EUR/USD chart on the 4-hour timeframe, we can see that the price started to drop as expected, correcting down to 1.168. After that move, demand stepped in, and now the pair is trading around 1.1716.
If the price manages to stay below 1.174, we could see another bearish move. The possible downside targets are 1.168 and 1.166. Key supply zones are 1.174–1.178 and 1.179–1.1810.
Please support me with your likes and comments to motivate me to share more analysis with you and share your opinion about the possible trend of this chart with me !
Best Regards , Arman Shaban

Gold | H2 Double Top | GTradingMethodHello Traders 👋
🧐 Market Overview:
I’ll be honest — I’m feeling a little hesitant about entering another Gold trade. The last few setups have gone against my system more than I would like. But trading is always a game of probability — clusters of losses are part of the process.
The key is staying disciplined. Over the long run, probability is in my favour, and that’s why I have to take this trade. My system is flagging a potential double top on the H2 chart, and the so far setup aligns with my rules.
Some of the variables I look for:
- Negative rsi divergence
- decreasing volume on the second top
- Need candle to close in range to take the trade
📊 Trade Plan:
Risk/Reward: 3.7
Entry: 3666
Stop Loss: 3689
Take Profit 1 (50%): 3592
Take Profit 2 (50%): 3565
💡 GTradingMethod Tip:
Even the best systems go through losing streaks. The edge comes not from avoiding them, but from executing consistently and letting probability work itself out over time.
🙏 Thanks for checking out my post!
Make sure to follow me for more setups and share your thoughts — will this H2 double top play out, or does Gold still have momentum to push higher?
📌 Disclaimer:
This is not financial advice. This content is to track my trading journey and for educational purposes only.

Gold | H1 Head and Shoulders | GTradingMethodHello Traders 👋
We’re finally getting a clean pattern to short Gold on.
🧐 Market Overview:
The chart is showing signs of exhaustion. We already have negative RSI divergence and decreasing volume on the right shoulder — both pointing to weakening buying momentum. I’m still waiting for confirmation before fully committing, but the setup is looking solid.
📊 Trade Plan:
Risk/Reward: 4.0
Entry: 3640.77
Stop Loss: 3652.5
Take Profit 1 (50%): 3602.4
Take Profit 2 (50%): 3581.5
💡 GTradingMethod Tip:
When trading reversal patterns like head & shoulders, volume is key. A drop in volume on the right shoulder often strengthens the case for a potential move lower.
🙏 Thanks for checking out my post!
Make sure to follow me to catch the next setup and let me know what you think — will this H&S confirm, or does Gold still have room to push higher?
📌 Disclaimer:
This is not financial advice. This content is to track my trading journey and for educational purposes only.

Gold | 30min Head and Shoulders | GTradingMethodHello Traders!
There is a potential head and shoulders in the making.
🧐 Market Overview:
One of the key indicators I watch when trading double tops is negative RSI divergence. On the Gold chart, price has been printing higher highs while RSI has been putting in lower highs — a classic sign of weakening buying momentum.
It’s important to note: negative RSI divergence does not guarantee a correction. It’s simply one element within our robust trading system that helps us build higher-probability setups.
📊 Trade Plan:
Risk/Reward: 3.5
Entry: 3655.1
Stop Loss: 3664.7
Take Profit 1 (50%): 3624
Take Profit 2 (50%): 3614
💡 GTradingMethod Tip:
Always remember — divergence is a signal, not a certainty. Use it in confluence with structure, patterns, and risk management for the best results.
🙏 Thanks for checking out my post!
Make sure to follow me to catch the next idea and please share your thoughts — do you think this head and shoulders will play out, or is Gold still too strong?
📌 Disclaimer:
This is not financial advice. This content is to track my trading journey and for educational purposes only.

Silver Pullback Ahead? A Buying Opportunity in the MakingSilver is in an uptrend channel both in the short term and the medium term. Significant bullish pressure is coming from gold, rising technology investment that boosts demand for silver, persistent inflation risks, and the Fed being on the verge of cutting rates. Fundamentally, everything supports silver, and upward pressure is likely to continue.
However, in the short term, upward momentum has started to ease despite the push from gold, which could be an early signal of a small correction. The upward move is still expected to continue, but if the green trendline and the 40.50 support both fail, there is a zone between 39.10 and 40.50 with previous low trading volume that could be filled by a selloff. Such low-volume zones often behave similarly to gaps, though not always.
In either case, silver has stronger potential over the medium term, and any sudden selloffs are likely to remain buying opportunities.

SILVER Will Go Up! Long!
Here is our detailed technical review for SILVER.
Time Frame: 1h
Current Trend: Bullish
Sentiment: Oversold (based on 7-period RSI)
Forecast: Bullish
The market is on a crucial zone of demand 4,131.3.
The oversold market condition in a combination with key structure gives us a relatively strong bullish signal with goal 4,170.3 level.
P.S
Overbought describes a period of time where there has been a significant and consistent upward move in price over a period of time without much pullback.
Disclosure: I am part of Trade Nation's Influencer program and receive a monthly fee for using their TradingView charts in my analysis.
Like and subscribe and comment my ideas if you enjoy them!

Gold | H1 Head and Shoulders | GTradingMethodGood morning Traders 👋
Gold... Could you please give us a head & shoulders to short? 🧐
I’m keeping a close watch here for potential shorting opportunities. An H1 head & shoulders setup would be the first prize.
After such a strong run over the past few days, surely gold owes us a relief rally at some stage...?
What do you think — are we lining up for a short, or does gold have more gas left in the tank?

Silver (SIL1!): Bullish! Buy The Dip!Silver is at the highest its been since 2011.
There is no reason to short this market. A short term pullback should be seen as a long opportunity.
Price has taken the External Range Liquidity, and a move back to Internal Range Liquidity is naturally expected. The +FVG (blue) looks like a great place to look for high probability buys.
It is intersected by the old high, adding to the confluence of support at that level.
What do you think? Comment down below!
Disclaimer:
I do not provide personal investment advice and I am not a qualified licensed investment advisor.
All information found here, including any ideas, opinions, views, predictions, forecasts, commentaries, suggestions, expressed or implied herein, are for informational, entertainment or educational purposes only and should not be construed as personal investment advice. While the information provided is believed to be accurate, it may include errors or inaccuracies.
I will not and cannot be held liable for any actions you take as a result of anything you read here.
Conduct your own due diligence, or consult a licensed financial advisor or broker before making any and all investment decisions. Any investments, trades, speculations, or decisions made on the basis of any information found on this channel, expressed or implied herein, are committed at your own risk, financial or otherwise.

Silver shines on a mix of financial momentum and industrial streSilver shines on a mix of financial momentum and industrial strength
Technical Perspective
XAGUSD is consolidating within an ascending triangle, a continuation pattern that implies a bullish breakout post accumulation phase.
Bullish alignment of EMA cross also reinforces the positive outlook within consolidation.
Currently, XAGUSD is testing the upper boundary of the sideways range. A close above the 41.50 upper bound resistance would confirm a bullish continuation, with the next upside target at 44.80 based on the 261.8% Fibonacci retracement level.
However, failure to break above 41.50 may trigger a pullback toward the ascending trendline. A breakdown below this line would expose the key psychological support at 40.00.
Fundamental Perspective
Silver maintains a high correlation with gold, often rallying alongside it when gold prices rise.
Expectations of Fed rate cuts reduce the opportunity cost of holding silver, boosting demand.
Industrial demand remains robust, especially in solar panels, electric vehicles, and electronics, with China driving consumption. Meanwhile, years of persistent supply deficits have tightened the market, providing strong fundamental support.
Geopolitical risks and safe-haven flows attract capital into broadly precious metals including silver.
In summary, silver’s latest rally is supported by monetary easing expectations, strong industrial demand, and heightened geopolitical tensions that reinforce safe-haven demand.
Analysis by: Krisada Yoonaisil, Financial Markets Strategist at Exness

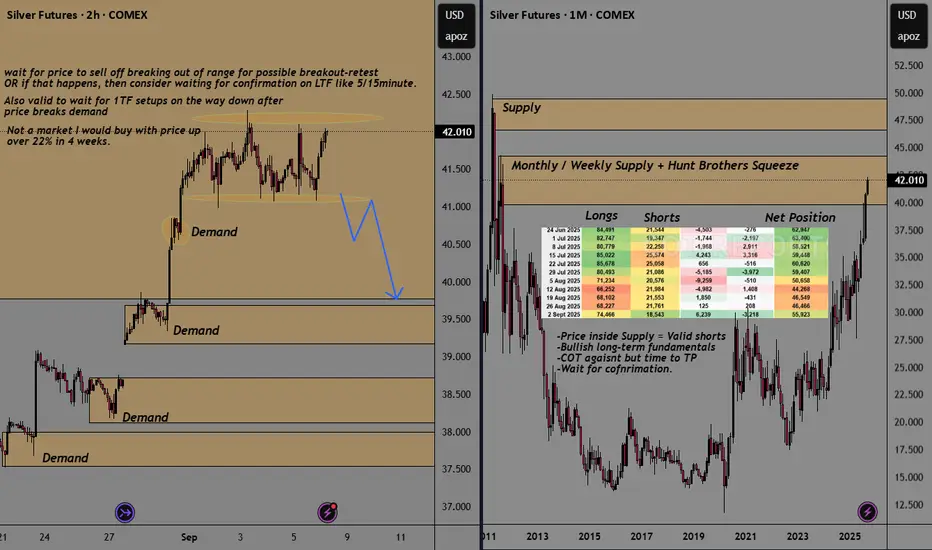
SILVER SI Supply-Demand AnalysisSee chart For Full Analysis
- Price inside HTF Weekly supply
- Strong Metals market, while I remain bullish long-term, I don't like the current
location price is in, and instead would like to see price sell off and see trader taking profits.
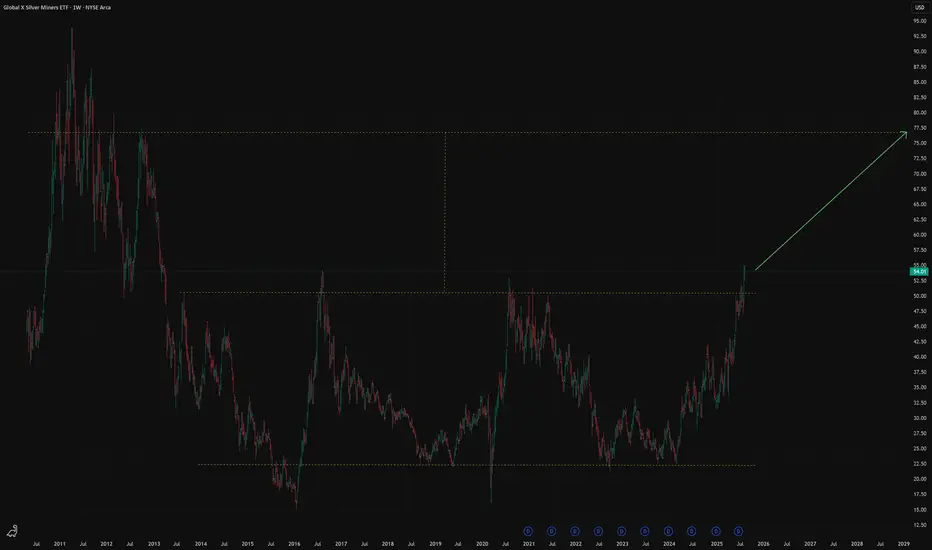
SIL ETF US- Silver Miners Mid Term ideaFollow us and don't miss a next idea on global markets
According to Mining Visuals Silver deficit is expected of 118 million ounces. At the same time strong industrial demand - driven by solar, electronics and green technologies.
Historically, mining stocks outperform the growth rates of the metals themselves. This hypothesis is confirmed by the fact that, starting in 2024, ETF SIL (silver miners) has outperform the metal itself.
From a technical point of view, ETF SIL has emerged from a long-term consolidation and there is a high probability of growth to the $80.
Silver uptrend sideways consolidation supported at 4067The Silver remains in a bullish trend, with recent price action showing signs of a consolidation within the broader uptrend.
Support Zone: 4067 – a key level from previous consolidation. Price is currently testing or approaching this level.
A bullish rebound from 4067 would confirm ongoing upside momentum, with potential targets at:
4181 – initial resistance
4224 – psychological and structural level
4260 – extended resistance on the longer-term chart
Bearish Scenario:
A confirmed break and daily close below 4067 would weaken the bullish outlook and suggest deeper downside risk toward:
4042 – minor support
4014 – stronger support and potential demand zone
Outlook:
Bullish bias remains intact while the Silver holds above 4067. A sustained break below this level could shift momentum to the downside in the short term.
This communication is for informational purposes only and should not be viewed as any form of recommendation as to a particular course of action or as investment advice. It is not intended as an offer or solicitation for the purchase or sale of any financial instrument or as an official confirmation of any transaction. Opinions, estimates and assumptions expressed herein are made as of the date of this communication and are subject to change without notice. This communication has been prepared based upon information, including market prices, data and other information, believed to be reliable; however, Trade Nation does not warrant its completeness or accuracy. All market prices and market data contained in or attached to this communication are indicative and subject to change without notice.

Silver | H4 Double Top | GTradingMethod
🧐 Market Overview:
All my variables have been met.
Some of the variables I look for are as follows:
- RSI divergence
- Lower volume on top 2 (In this case JOLTS came out, which causes an exception to the volume rule)
- Attack candle closes in range
Opened a short position on Silver.
📊 Trade Plan:
Risk/Reward: 3.9
🎯 Entry: 41.29
🛑 Stop Loss: 41.67
💰 Take Profit 1 (50%): 39.93
💰 Take Profit 2 (50%): 39.34
💡 GTradingMethod Tip:
Sometimes news events (like JOLTS) can disrupt normal volume behavior. That’s why it’s key to use multiple variables together, not rely on just one signal.
🙏 Thanks for checking out my post!
Make sure to follow me to catch the next idea and please share your thoughts — I’d love to hear them.
📌 Please note:
This is not financial advice. This content is to track my trading journey and for educational purposes only.

Ivanhoe Mines - a 50% discount opportunity !The share price of this mining monster has suffered a 50% price decline in the last 6 months.
One of the main reasons for the share price decline is the suspension of underground operations at the Kakula mine due to seismic activity. This suspension has led to a withdrawal of production and cost guidance for 2025, causing investor uncertainty and a subsequent drop in share price 1,2,3 Additionally, the company has faced challenges with its smelter, including a fire that damaged onsite generators and caused a three-month delay in commissioning. These issues, combined with power constraints and grid instability in the Democratic Republic of Congo (DRC), have contributed to a more conservative production outlook.
However there are lots of positive catalysts for Ivanhoe Mines: the upcoming rise in precious metal prices, especially the wake up of the severely undervalued PLATINUM prices.
Platreef PGM project in South Africa contains 7 million ounces of gold (0.25 gpt) and 50 million ounces of AuEq. About 90% of annual production (1 million ounces) will consist of PGMs (platinum group metals), making it the largest PGM mine in the world ! Platreef is expected to have low all-in production costs, though more precise figures will become available after the ramp-up phase, scheduled for the second half of 2025.
Platreef PGM, Kakula-Kamoa (massive copper mine, the largest high grade mine globally) and Kipushi (a high-grade zinc operation); With all three of their mines expected to be in production, 2025 could be a pivotal year for them.
Chart wise, the price is still rising in a long term rising wedge. Price just found support on the lower resistance and is bouncing strongly. OBV on balance volume is still on a steady rise. I own Ivanhoe Mines since I got in at sub 1$ (thanks to Rick Rule's reccomandation - God may bless him). and I am not willing to let go before we reach 50$, which is my long term target.

XAGUSD Overextended: Watching 40.50 NecklineIn the past months I argued that Silver should rise and reach 40, and the market not only achieved that but even exceeded the level, printing a high at 41.50.
However, just like Gold, this move looks overextended and vulnerable to correction.
📌 Technically, price has tapped 41.50 twice. While it cannot yet be called a confirmed double top, the possibility exists. The neckline of this potential pattern is at 40.50.
• A break below 40.50 could trigger a deeper correction.
• First target: under 40, toward the 39 technical support zone.
🔑 Trading Plan: I remain cautious at these levels.
If 40.50 gives way, I will look for shorts targeting the 39 area. Counter-trend trades carry very high risk, but the setup is worth monitoring. 🚀
