Silver Unfolds A New Impulse Within 5th WaveSilver is moving higher as expected, pushing even beyond 39, but since the market also broke to new highs, it’s clear that higher degree wave four is finished as a flat correction back at 36.20, so be aware of even further continuation higher into wave five while makret trades above 39. We need five subwaves now in this blue wave 5 cycle, so more gains can follow after some intraday setbacks. But keep in mind that we are in the final leg of the higher-degree fifth wave impulse that could come to an end around 42/43 this year.
Silver

Trump’s Bond Strategy vs. Saylor’s High-Stakes Bitcoin BetBitcoin ( BITSTAMP:BTCUSD ) Macro Analysis: Trump’s Bond Strategy vs. Saylor’s High-Stakes Bitcoin Bet
1. Trump’s Bond Play and Crypto Ventures: A Dual Macro Hedge
Since returning to office in January 2025, Donald Trump has purchased over $100 million in corporate and municipal bonds, including debt from Meta, Citigroup, and local governments. These purchases are notable for two reasons:
Yield Lock: Trump’s bond buys were made at yields near 5%, a level not seen since the pre-2022 low-rate era. If the Federal Reserve cuts rates as expected in late 2025, the value of these bonds will rise, and their fixed 5% coupons will become increasingly attractive compared to new, lower-yielding issues.
Policy Alignment: Trump has publicly pressured the Fed to lower rates, which would further inflate the value of his bond portfolio. His administration’s fiscal and trade policies (e.g., tariffs, deregulation) could also indirectly support bond markets by stimulating demand for safe-haven assets.
Trump’s Crypto Ventures: Profiting from the Public
Unlike traditional crypto investors, the Trump family’s involvement in the sector is not built on holding Bitcoin or other digital assets. Instead, their companies focus on selling crypto-related products, cashing in on trading fees, and enriching themselves at the expense of an uninformed public. These ventures have been widely criticized as predatory, leveraging Trump’s political influence and public persona to attract unsuspecting investors into high-fee, low-value schemes—effectively an open scam that prioritizes short-term profits over genuine market participation.
Implications for Bitcoin:
If rates fall, bond yields become less competitive with risk assets like Bitcoin, potentially driving capital back into crypto.
However, Trump’s bond strategy and his family’s exploitative crypto ventures signal a preference for traditional financial instruments and extractive business models over supportive crypto policies. This could temper any positive impact on Bitcoin from his administration’s economic agenda.
2. Michael Saylor’s MicroStrategy: A Leveraged Bitcoin Bet
MicroStrategy, under Michael Saylor, has become the world’s largest corporate holder of Bitcoin, with over 446,000 BTC (worth ~$50 billion as of September 2025). The company’s strategy relies heavily on convertible debt issuance:
Debt Structure: MicroStrategy has issued billions in zero- or ultra-low-interest convertible notes (as low as 0.625%), using the proceeds to buy Bitcoin. This allows the company to avoid high interest payments and benefit from Bitcoin’s price appreciation.
Risks:
Leverage: If Bitcoin’s price falls sharply, MicroStrategy may face margin calls or be forced to sell BTC to meet debt obligations, exacerbating downward pressure on $BTCUSD.
Equity Dilution: The company’s aggressive stock issuance (planned dilution from 330M to 10B shares) could depress shareholder value if Bitcoin underperforms.
Recent Performance:
MicroStrategy’s stock NASDAQ:MSTR has outperformed Bitcoin in 2024–2025, but its valuation is now highly correlated with BTC’s price and market sentiment toward leverage.
3. Federal Reserve Policy: The Wild Card
Current Rates: The Fed has held rates at 4.25–4.50% since late 2024, but markets anticipate cuts in late 2025 (potentially 0.50–0.75% by year-end).
Impact on Bitcoin:
Rate Cuts: Historically, lower rates boost risk assets. Bitcoin could benefit from increased liquidity and weaker dollar, as seen in late 2024 when BTC rallied following Fed easing.
Inflation & Macro Risks: If cuts are delayed or inflation resurges, Bitcoin may face headwinds as investors favor bonds or cash.
4. The Crypto Winter Thesis: Is Doomsday Coming?
Bull Case: If the Fed cuts aggressively and liquidity floods markets, Bitcoin could resume its upward trajectory, especially if institutional demand (e.g., ETF inflows) remains strong.
Bear Case:
MicroStrategy’s Leverage: A sharp BTC drop could force NASDAQ:MSTR to liquidate holdings, triggering a cascade effect.
Regulatory Risks: Trump’s bond focus, his family’s extractive crypto ventures, and potential regulatory crackdowns could dampen sentiment.
Macro Uncertainty: Geopolitical tensions, recession fears, or a stronger-than-expected dollar could further pressure risk assets.
Technical Outlook:
BITSTAMP:BTCUSD is currently trading at $109,430 (as of September 4, 2025), up 1.63% over the past week but still range-bound between $107K–$112K.
Support/Resistance: Watch $105K (psychological support) and $115K (next resistance). A breakout or breakdown here could signal the next major move.
Conclusion: A Tale of Two Strategies
Trump’s bond purchases and push for rate cuts could indirectly benefit Bitcoin by reducing the appeal of fixed income, but his administration’s stance on crypto, and his family’s history of exploiting the public through crypto ventures, remains a significant red flag. Meanwhile, MicroStrategy’s leveraged Bitcoin bet is a high-risk, high-reward play that could either propel BITSTAMP:BTCUSD to new highs or accelerate a downturn if forced liquidations occur.
Traders should monitor:
Fed meetings (next: September 16–17, 2025) for rate cut signals.
MicroStrategy’s debt maturity schedule and Bitcoin holdings.
Trump’s policy shifts on crypto regulation and fiscal stimulus, as well as any new developments in his family’s crypto-related businesses.
Final Thought: The stage is set for a volatile Q4 2025. While the macro backdrop favors risk assets if the Fed eases, the specter of leverage unwinding, regulatory risks, and the Trump family’s extractive crypto practices looms large. Caution and active risk management are advised.
NASDAQ:MSTR NASDAQ:COIN TVC:GOLD TVC:SILVER NASDAQ:MARA BITSTAMP:ETHUSD CRYPTOCAP:USDC NASDAQ:TSLA NASDAQ:NVDA

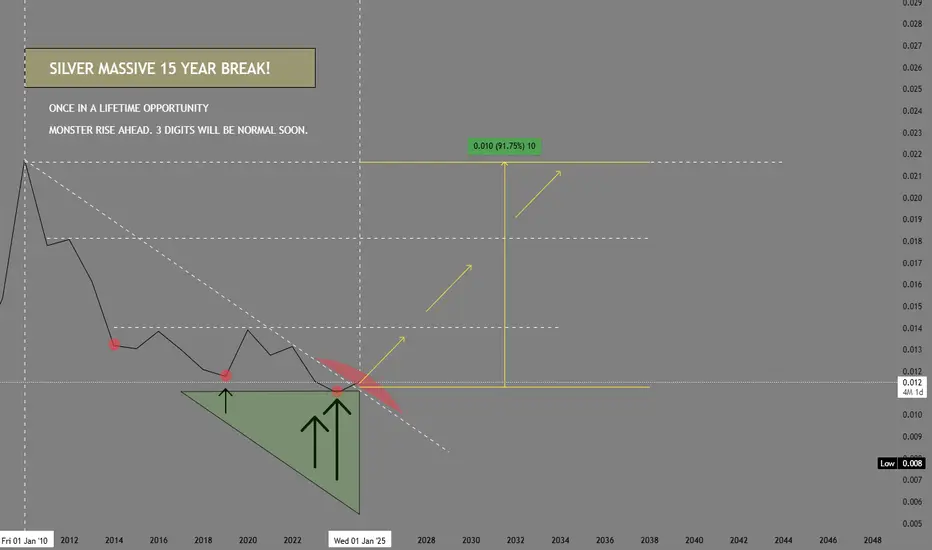
SILVER, MONSTER RISE AHEAD targeting 3 digit pricing!!! SEED NOWFirst things first. Chart is based on reverse metrics of GOLD/SIVER.
SILVER, is usually the supporting actor of the main star GOLD for months. During GOLD's relentless series of rise from 1900 -- silver has been pretty much on the low key state in terms of volume exposure and media mileage but that is about to change soon.
Recent long term data metrics is hinting of a massive reversal to the upside after that elusive 14-year downtrend break. This event does not come often, so THIS IS VERY SPECIAL -- a once in a lifetime opportunity.
Based on our diagram, we are seeing some expanding upside pressure this past few weeks rendering a strong break of this long standing resistance trend that lasted years -- which started from 0.033 on April 2011 to finally tapping an extreme lows at 0.09 on January 2025. This HUGE SHIFT is giving some clues already of whats about to transpire in the next few months -- to break barriers.
Now things are shifting BIG TIME for SILVER as recent price surge this past few weeks has depicted a very significant net long positioning on a grand time scale (long term).
Since the start of 2025, SILVER has already risen almost 40% from its lows. An impressive feat.
This yearly percentile growth is hinting of a bigger picture as we move forward -- to rise further, and explore new high HIGHS in the next few seasons.
This recent massive break -- 14 years in the making should warrant significant positioning already both in retail and institutions.
I'm expecting SILVER to supercede gold in terms of percentile growth metrics % because of the wide price difference ratio.
SILVER will continue to grab good attention from hereon as increasing demand of this metal will just inflate its prices -- moreso, with apparent depleting supplies.
To add to this, US has proposed adding silver to its Critical Minerals List, reflecting its vital industrial, technological, and national security importance, especially for renewable energy, electronics, and medical applications. The draft 2025 list by the USGS and Department of the Interior includes silver for the first time, aiming to boost domestic supply security and reduce reliance on imports by providing incentives for mining and recycling.
With all these factored in, SILVER should be a no-brainer part of your portfolio starting today.
Rewards will be far greater than you will ever imagine.
Current price: 39.0
Target 100.
Long term Target 200-400.
TAYOR. Trade safely.
SILVER’S SUPERCYCLE: $40 Retest Could Ignite a Moonshot to $66Silver OANDA:XAGUSD ) has finally broken out of a multi-year resistance zone, soaring past $40 for the first time since 2011. With technical momentum building and macro tailwinds in place, this could be the beginning of a supercycle rally in precious metals.
Trade Plan:
🔹 Entry Zone: Watching for a pullback to $40.00 – a former resistance turned key support
🔹 Stop Loss: $38.00 (below support, invalidates breakout if breached)
🔹 Targets:
• TP1: $44.00 – $48.00
• TP2: $58.00 – $66.00
Why This Setup?
✅ Breakout from multi-decade cup & handle formation
✅ Bullish momentum driven by inflation hedging, weak USD, and rising industrial demand
✅ Historical precedents suggest that confirmed breakouts in silver often move fast and far
Watchlist:
🕵️ Keep an eye on volume, RSI divergence, and how price reacts near $40. A healthy pullback and strong bounce would validate the setup.
#Silver #XAGUSD #SilverStackers #Commodities #PreciousMetals #GoldVsSilver
#BreakoutTrade #TechnicalAnalysis #MetalsTrading #SpotSilver #TradingSetup
#MacroTrading #SafeHavenAssets #InflationHedge #SilverSqueeze #Supercycle

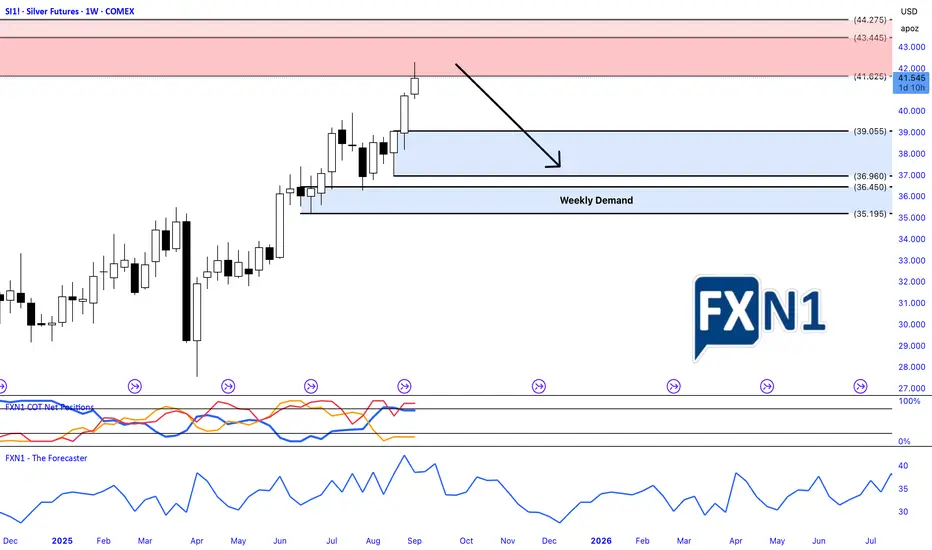
Silver Trade Insights: Supply Levels, Seasonality and COTI have initiated a short position in silver as the price approaches a significant weekly supply zone. This entry was strategically determined based on an intra-day supply level identified on the daily chart. My outlook is primarily bearish, supported by seasonal patterns suggesting a potential downward trend. Additionally, non-commercial traders and institutional investors have been increasing their short positions, while retail traders continue to build long positions. I'm anticipating a possible trend reversal, but I also remain cautious of a retest of my designated supply area before any decisive move. As always, I recommend conducting thorough personal research before making any trading decisions.
✅ Please share your thoughts about Silver in the comments section below and HIT LIKE if you appreciate my analysis. Don't forget to FOLLOW ME; you will help us a lot with this small contribution.
Silver Daily Analysis- Silver continues to ride its bullish momentum within an ascending channel formation.
- It is supported by dovish expectations from the Fed.
- The market has already started pricing in the September rate cuts, which weakens the dollar and provides a tailwind for precious metals.
- The Fib Extension 1.272 (41.32) is acting as a crucial immediate hurdle for bulls.
- Prices have also entered the overbought zone
- testing upper Bollinger band &
- above 70 level of RSI
- Both signaling minor corrections
- However, a clean break and sustained close above Fib Extension 1.272 level will likely fuel further upside momentum.
- On the upside, the next milestone sits near $44.0, aligning with historical resistance and the extended Fib projections.
Risk Factors:
* Failure to sustain above the 1.272 extension (41.32) could trigger profit-taking.
* A retest of the lower trend line of the channel near 39.5 or the middle Bollinger band near 38.5 could be witnessed
Short-term pullbacks are possible, but the broader bias remains bullish as long as the Fed maintains its rate-cut trajectory.

Is it Time to Buy Silver and Sell Gold???Analysis of the "Gold to Silver Ratio" will Reveal Curical Facts
Analysis on Weekly Timeframe:
1. The ratio is trending within a symmetrical triangle pattern near 86.5.0, indicating gold is significantly more expensive relative to silver.
2. However, the ratio started declining after reaching peak of 105.5 during April, while testing the upper trend line of the triangle.
3. The ratio is expected to further fall & at least test the lower trendline of the triangle near 80.5, if breached, then support at 75.5 could be witnessed.
4. Currently, the ratio is trending near the levels previously seen during the Global Financial Crisis - 2008, after which it drastically declined.
Silver Shines Brighter Than Gold
---------------------------------------------------------------------------------------------------------------------
What is the Gold/Silver Ratio?
- The Gold/Silver ratio measures the value of gold in relation to silver.
- Basically, it tells us how many ounces of silver are needed to buy one ounce of gold.
- For example, if gold was trading at $1000 and silver was priced at $20, the gold : silver ratio would be 50.
- Current Situation - Gold Rate = ~$3500 & Silver = ~$40; the gold : silver ratio would be ~87.50
Interpretation
- A high ratio means gold is more expensive relative to silver (and vice versa)
- Historically, it has been seen that, when the ratio rises above 80 (currently it is 87.5), silver gets undervalued relative to gold
- An undervalued silver makes it a potential buy against gold.

SILVER Will Go Up! Buy!
Please, check our technical outlook for SILVER.
Time Frame: 12h
Current Trend: Bullish
Sentiment: Oversold (based on 7-period RSI)
Forecast: Bullish
The market is trading around a solid horizontal structure 4,089.7.
The above observations make me that the market will inevitably achieve 4,300.4 level.
P.S
Please, note that an oversold/overbought condition can last for a long time, and therefore being oversold/overbought doesn't mean a price rally will come soon, or at all.
Disclosure: I am part of Trade Nation's Influencer program and receive a monthly fee for using their TradingView charts in my analysis.
Like and subscribe and comment my ideas if you enjoy them!

Gold Lags Behind SilverGold lags behind silver. I’m referring to silver’s percentage gains outpacing gold, not suggesting that silver is becoming more expensive than gold. Investors and traders focus on percentage gains, whereas consumers buying jewelry make decisions based on how much it’ll actually cost them.
Last year, silver’s 60% gain outpaced gold’s 40%, and year-to-date, silver has once again outperformed gold with a 52% gain compared to gold’s 36%.
Micro Silver Futures
Ticker: SIL
Minimum fluctuation:
0.005 per troy ounce = $5.00
Disclaimer:
• What presented here is not a recommendation, please consult your licensed broker.
• Our mission is to create lateral thinking skills for every investor and trader, knowing when to take a calculated risk with market uncertainty and a bolder risk when opportunity arises.
CME Real-time Market Data help identify trading set-ups in real-time and express my market views. If you have futures in your trading portfolio, you can check out on CME Group data plans available that suit your trading needs www.tradingview.com

Gold | 15min Head and Shoulders | GTradingMethodHello Traders.
Welcome to today's trade idea by GTradingMethod.
🧐 Market Overview:
There’s a potential head and shoulders pattern forming on the 15-minute chart. Gold broke to a new high yesterday, and a healthy breakout often comes with a retest before continuing higher.
This 15-minute head and shoulders could signal that retest — or potentially lead to a deeper correction.
One of the variables I will be looking for is lower volume on the right shoulder.
📊 Trade Plan:
Risk/reward = 3.3
Entry price = 3 536.3
Stop loss price = 3 543.5
Take profit level 1 (50%) = 3 516.8
Take profit level 2 (50%) = 3 506
💡 GTradingMethod Tip:
Patterns can provide an edge, but waiting for confirmation helps you avoid false signals and emotional decisions.
🙏 Thanks for checking out my post!
Make sure to follow me to catch the next idea and please share your thoughts - I would like to hear them.
📌 Please note:
This is not financial advice. This content is to track my trading journey and for educational purposes only.

Gold’s $200 Surge Defies the DollarOver the past week, gold prices exploded by more than $200 per ounce, shattering the $3,500/oz threshold to new all-time highs . Silver joined the surge, breaching $40/oz for the first time since 2011 . This explosive precious metals rally is striking not only for its magnitude, but because it occurred in tandem with a strengthening U.S. dollar – a sharp break from the usual inverse correlation between gold and the greenback. Typically, “gold’s appeal reflects an inverse relationship with the dollar’s value”, as one analyst noted , and gold soars when the dollar slumps. Yet this time, the U.S. Dollar Index held firm (even rising against some currencies), so gold’s ascent “alongside the value of the US dollar” appears anomalous .
This disconnect has confounded the simplistic media narrative that tried to pin gold’s move on U.S. political drama – namely turmoil surrounding Donald Trump pressuring the Federal Reserve. Indeed, mainstream headlines have leaned on that explanation: “Gold surges after Trump’s Fed pressure,” blared the Financial Times, after President Trump’s attempted (and unprecedented) firing of Fed Governor Lisa Cook raised alarms about Fed independence . Bloomberg News similarly attributed gold’s spike to “rate-cut bets” spurred by Trump’s actions . There is some truth here – investors clearly sought safety amid U.S. political uncertainty, with the largest gold ETF (SPDR Gold Shares, ticker GLD) hauling in over $2.3 billion of inflows last week to top all ETFs, “as gold prices flirted with record highs near $3,500” following Trump’s attempt to oust a Fed official . Concerns over Fed independence and Washington turmoil did fuel safe-haven demand . But a closer investigation of market data and cross-asset flows reveals a more complex story than “Trump made gold jump.” In particular, the simultaneous rise of gold and the dollar hints at other forces at play – potentially global capital rotations and eurozone undercurrents – that the simplistic narrative overlooks.
Order Flow: U.S. Buying vs. Asian Selling
One immediate clue lies in where the strongest gold buying originated. Market internals and order flow patterns suggest that North American investors led this rally, while Asian and European participants were net sellers or laggards. Gold’s intraday price action repeatedly showed dips during Asia and London trading hours, followed by robust gains during U.S. market hours – indicating steady accumulation out of New York overcoming profit-taking elsewhere. This aligns with recent flow trends: “Gold ETF buying has flipped from Asia to Western investment markets”, notes BullionVault, as China and India saw outflows while U.S. and European gold funds began expanding together . In the past fortnight, Asian-listed gold ETFs shrank by over 5 tonnes – the heaviest 2-week outflow since the Ukraine invasion – even as Western funds saw their strongest stretch of inflows in over two years .
Physical gold selling in Asia corroborated this trend. As prices hit fresh highs above $3,000 and $3,500, Asian jewelry holders rushed to “cash in”. In India’s bazaars and Middle Eastern souks, retailers report a surge of people selling old jewelry and coins to lock in gains . “Customers raced to cash in their old gold,” Reuters noted, with scrap sales booming across India and the Middle East . This flood of recycled gold effectively made Asia a net supplier to the market during the rally, potentially “tempering gold’s rally” in those regions if it continues . In contrast, U.S. investors were voracious buyers: not only did American ETFs see big inflows, but U.S. futures markets showed relentless bids during New York trading sessions, driving price strength into each day’s close.
In sum, Western demand carried gold higher even as Eastern markets took profits. This East-to-West flow reversal suggests the price surge was not simply a global panic “bid” for gold, but rather a targeted rotation of capital – with U.S. and European buyers eagerly absorbing the supply coming out of Asia. Such a dynamic is important because it hints that new money (likely institutional and speculative) in the West was a key driver, rather than traditional physical demand from Asia (which actually softened amid the high prices).
Gold in USD vs. Gold in EUR: A Currency Disconnect
Another intriguing aspect of this rally is how differently it played out in U.S. dollars versus other currencies – particularly the euro. Gold’s price in USD hit record highs, but gold priced in euros (XAU/EUR) did not. In fact, at gold’s peak this week the euro-priced ounce “held beneath spring highs” even as the USD-priced ounce broke out . Gold in British pounds and Japanese yen did notch new records alongside USD gold , but the euro-denominated price lagged.
This discrepancy between XAU/USD and XAU/EUR is telling. Had the rally been driven purely by U.S.-centric fears (Trump/Fed turmoil) causing a weak dollar, we would expect the opposite – gold might jump in USD but soar even more in euros as the dollar falls. Instead, the dollar strengthened against the euro, and gold’s rise in USD terms outpaced its rise in EUR terms. One interpretation is that some of the buying came from investors shifting capital out of euro assets and into dollar-based gold, effectively boosting both gold and the dollar simultaneously. In other words, capital flight from euro-based holdings could be an underlying factor. If European investors (or global investors with euro exposure) moved funds into U.S. dollars or dollar-priced gold, that would drive the dollar higher at the same time as gold – precisely what we saw.
It’s notable that earlier in the year, gold in euros had spiked to record levels (during a bout of euro weakness and regional banking worries), whereas U.S. gold lagged at that time. Now the roles reversed: “the dollar price topped its previous high, but the euro price of gold stayed below its spring peak” . This reversal suggests the latest rally was U.S.-led, not euro-led. Rather than a panic specifically within Europe, this feels like a more subtle rotation away from the euro toward “safe” currencies and assets. The euro’s exchange rate was relatively firm during this gold spike (indeed, gold’s jump was despite a firm dollar, not because of a weak one), implying the move wasn’t about a collapsing euro – it was about proactive reallocation. In essence, global investors may be quietly diversifying out of euros into gold (and dollars) as insurance against potential eurozone troubles down the line.
Speculators Pile In: CFTC Data Shows Growing Longs
Fueling gold’s ascent has been a wave of speculative positioning in the futures market. The Commodity Futures Trading Commission (CFTC) Commitments of Traders (COT) report reveals that hedge funds and money managers have been steadily adding to bullish gold bets. In fact, bullish bets are at their highest levels in years. As one market analysis noted, “the net long position of Managed Money traders rising… back to 4-year high… reaching 155% of long-term average” . This means speculators hold vastly more long contracts than usual, a clear sign of momentum-chasing and confidence in further upside.
Recent data confirms the build-up: speculators’ net-long gold positions jumped to around 237,000 contracts in mid-August (versus ~178,000 in early 2024) and remain elevated . For context, that mid-August figure was the largest net long in at least four years. Even trend-following funds that had been absent are now “firing on all cylinders,” adding to length as gold broke out. Importantly, while these speculative inflows are large, some analysts point out they are “relatively modest… given the move in gold prices – suggesting there is further upside to come” if more investors pile in . In other words, positioning is bullish but not yet at extreme record levels in proportion to gold’s price move, leaving room for additional buyers.
This surge in paper gold interest highlights that the rally has a strong “hot money” component. It’s not just passive safe-haven holding; fast-moving traders are actively driving the market higher. The rising COT longs also underscore why gold’s jump defied the dollar: in a typical risk-off scenario, one might see short covering or flight from other assets incidentally lift gold, but here we have an affirmative speculative buildup anticipating higher gold ahead.
Massive ETF Inflows: GLD and Silver ETFs See Big Demand
Alongside futures activity, investment flows into gold and silver exchange-traded funds (ETFs) have been massive, indicating broad-based demand from institutions and retail investors alike. The flagship gold ETF, GLD, saw particularly eye-popping inflows. In the week of the surge, GLD attracted roughly $2.3 billion of new money, making it “the No.1 asset gatherer among U.S.-listed ETFs” . To put that in perspective, GLD outdrew even the largest stock index funds for the week – a remarkable rotation of capital into precious metals.
These inflows pushed GLD’s total assets to new heights, as investors sought the convenience of paper gold exposure during the rally. Other precious metals funds saw similar interest: iShares’ silver trust (SLV) reportedly logged sizable inflows as silver prices jumped in unison with gold. Silver’s rally – over 10% in a week to above $40/oz – was the strongest in years, and analysts noted that “momentum traders obviously also became involved” once silver broke technical levels . The U.S. government’s proposal last week to classify silver as a critical mineral (which could spur domestic stockpiling) “helped to fuel the surge through $40” , giving fundamental justification to silver’s move and further enticing ETF investors.
Taken together, the ETF data paints a picture of widespread investment allocation into precious metals. Gold-backed ETFs globally had already been seeing positive inflows in recent months – the World Gold Council reported that the first half of 2025 saw the largest H1 gold ETF inflows since 2020 – and this past week accelerated that trend. The demand was not confined to the U.S. either; European-listed gold funds also saw creations (with particularly strong buying in the UK, Switzerland, and Germany in recent months) . But the U.S. flows were dominant. North American funds accounted for the bulk of new gold ETF buying this quarter , reflecting that U.S. investors are driving this shift to hard assets.
Such massive ETF inflows, alongside record futures longs, indicate a broad conviction trade into gold and silver. Whether as an inflation hedge, a geopolitical hedge, or a play on future Fed easing, capital is pouring into these assets via easily accessible vehicles. GLD’s $2+ billion weekly haul underscores that this was not a niche move – it was front and center in capital markets.
Not a Typical “Risk-Off” – Stocks, Crypto and Bonds Stayed Resilient
Crucially, unlike many past gold spikes, this one did not coincide with a major selloff in other asset classes. In classic market panics, gold’s rise is often mirrored by tumbling equities, collapsing bond yields (as investors buy Treasuries), or even a rush out of speculative assets like cryptocurrencies. That didn’t really happen here – indicating this gold rally was driven by rotation of capital from cash or low-yield reserves, rather than forced liquidations elsewhere.
Consider the stock market: global equities barely blinked. The MSCI World Stock Index had just hit an all-time high in late August; it fell only about 1.5% from that peak during gold’s run-up . A 1.5% dip is trivial – essentially normal daily volatility – and U.S. indices similarly remained near record levels. There was no sense of an equity crash or widespread fear in stocks; in fact, some risk assets like small-cap stocks rose on hopes of Fed rate cuts. Crypto markets were also relatively stable. Bitcoin and other major cryptocurrencies held in their recent trading ranges with no signs of a flight-to-safety out of crypto. Unlike early 2020 (when Bitcoin plunged during a dash for cash), this time crypto was “largely unfazed”. If anything, crypto investors likely interpreted Fed dovishness as positive, which could have buoyed coins – but there was no mass exodus from crypto into gold.
Bonds told a more nuanced story. U.S. Treasuries did not rally alongside gold – in fact, long-term bond prices fell last week, sending yields higher . Typically, if there were a major fear-driven episode, one would expect Treasury yields to plunge (as bond prices rise on safe-haven buying). Instead, the 10-year and 30-year yields ticked up. Notably, gold and bonds moved in opposite directions: “the split between government debt and gold prices has been underway, with gold rising… while the value of longer-term Treasury bonds has halved over five years” . Part of last week’s bond weakness was due to fresh concerns about fiscal deficits and inflation – which ironically can boost gold. A fund manager at Newton noted that the bond market isn’t yet signaling long-term inflation, but “there is falling confidence that can continue indefinitely”, characterizing the situation as a “fiscal crisis, rather than an economic crisis” driving gold’s rise . In short, gold’s jump wasn’t the result of a panic-driven bond rally – if anything, it coincided with a bond selloff. That implies the money fueling gold had to come from elsewhere (cash, forex reserves, or rotation out of other holdings) rather than from investors dumping stocks and bonds in fear.
This cross-market resilience supports the idea that the gold/silver inflows were more of a strategic reallocation or hedge, not a reaction to an acute crash in other assets. As one analyst put it, “If you were a Martian observing this, gold and long-term bonds sending opposite signals is telling you there are concerns” below the surface – but it’s an unusual mix of signals. Investors didn’t run for the exits in equities or corporate bonds; instead, they appear to have drawn on sidelined cash or reallocated currency reserves to fund their gold purchases. This makes the episode more interesting: it hints at a rotation happening quietly, rather than an obvious crisis visible in all markets.
Beyond the Trades: Is Capital Fleeing the Eurozone?
These patterns – U.S.-led gold buying, euro underperformance, no broad risk asset selloff – point to a deeper macro narrative: a potential rotation of capital out of Europe’s financial system and into hard assets. Several data points and developments reinforce this interpretation:
Reserve Currency Shifts: In a striking milestone, gold has now surpassed the euro as the world’s second-largest reserve asset (behind only the U.S. dollar). An ECB report highlighted that for the first time ever, gold represents a larger share of global foreign exchange reserves (20%) than the euro (16%) . In other words, central banks collectively hold more value in gold than in euro-denominated assets. This reflects concerted gold accumulation (over 1,000 tonnes per year since 2022, more than double the prior decade’s average ) at the expense of fiat holdings. It’s effectively a rotation out of traditional currencies – notably the euro – and into bullion. Such a shift “is remarkable”, as one market veteran noted, and coincides with 95% of central banks stating they plan to increase gold reserves in the next year – the highest on record . This trend screams a subtle mistrust in the long-term stability of the euro and other fiat assets, and a desire for the safety of hard currency.
Eurozone Stress Signals: While the eurozone isn’t in open crisis, there are hints of structural stress that may be nudging smart money to preemptively seek safety. Political instability is one concern – for example, in France (the Eurozone’s second-largest economy), the government is teetering on the edge of collapse amid budget battles. Even ECB President Christine Lagarde cautioned that “any risk of a government falling in the euro zone a concern”, after French markets wobbled on snap election fears . Such political tremors feed into a narrative of euro-area fragility. Meanwhile, European banks and governments are grappling with high debt loads and thin margins. As interest rates rose this year, sovereign and corporate borrowing costs in Europe jumped, exposing vulnerabilities in heavily indebted nations. Observers have warned of “debt saturation” and precarious leverage in Europe’s financial system (some even pointing to bloated gold derivatives positions at European banks as a risk) . If investors – or other central banks – perceive even a small chance of a Eurozone financial accident (be it a debt crisis, a bank failure, or political rupture), they may quietly trim exposure now.
Geopolitical Fragmentation and Inflation Hedging: Beyond Europe-specific issues, the broader macro backdrop is one of fracturing globalization and lingering inflation – conditions under which hard assets historically thrive. Under President Trump, the U.S. has upended elements of the post-WWII order, from trade alliances to security commitments . Trade wars and tariffs are forcing reallocations of supply chains and reserves. According to Reuters, Trump’s aggressive policies and sanctions have “upended Western security policy” and contributed to an environment where diversifying away from reliance on any single currency (especially the U.S. dollar) becomes prudent . Many developing countries have responded by boosting gold holdings as a hedge against geopolitical risks and potential sanctions (a lesson learned after Russia’s USD reserves were frozen in 2022) . This “de-dollarization” impulse, interestingly, often doesn’t benefit the euro – it benefits gold. Nations looking to reduce dollar dependence aren’t rushing into euros; they’re buying bullion (and to some extent, yuan) . This adds to global gold demand independent of day-to-day traders.
At the same time, inflation remains a concern. Though off its peak, inflation in both the U.S. and Europe has been stubbornly above central bank targets, eroding trust in fiat purchasing power. Gold is the classic inflation hedge, and its appeal grows when investors worry that “there are concerns… the right tail of inflation risk” in the future . Notably, this gold rally occurred even as inflation expectations in bond markets remained relatively contained – suggesting some investors aren’t waiting for official signals; they are positioning early against the possibility of inflation or currency debasement down the road. The fact that inflation-linked bonds have not rallied (underperforming regular bonds) implies the bond market isn’t convinced inflation will run away . But gold’s surge could be seen as a belts-and-suspenders approach – insurance in case the bond market is wrong or central banks falter.
Hard Asset Accumulation by Private Wealth: It’s not just central banks. Wealthy individuals and institutions are also shifting into tangible assets. Anecdotally, vault operators report high demand for physical gold storage. Real assets from commodities to real estate are getting increased allocation in portfolios as a hedge against both inflation and geopolitical strife. Silver’s inclusion on a U.S. critical minerals list last week (to secure supply chains) is emblematic of the new era of resource nationalism and strategic stockpiling . Gold and silver stand to benefit as strategic assets in a fragmenting world. The rally in both metals might be an early sign of investors preferring the certainty of hard assets in hand over promises on paper.
All these factors converge to a clear insight: the gold and silver surge may be an early warning signal of capital seeking safety from systemic risks – particularly those emanating from currency systems and financial institutions. Unlike a sudden crisis that causes a panicked stampede, this feels more like a strategic redeployment of capital: a rotation before the full storm hits.
Conclusion: A Canary in the Coal Mine?
Gold’s extraordinary run this past week – soaring in concert with a firm dollar, absent a stock market crash – is not just a one-off curiosity. It appears to be a manifestation of deeper shifts in investor behavior and economic regime. The simple story of “Fed drama and political turmoil” belies the larger context: we are likely witnessing a rotation toward safety and solidity in anticipation of future turbulence. Whether that turbulence comes from Europe’s financial system, unsustainable government debts, or a fracturing global order, investors are hedging their bets.
Precious metals are, in effect, serving as a barometer of macro stress and a receptacle for capital seeking refuge. As the European Central Bank’s own analysis noted, “gold generally offers a safe haven in times of stress… in extreme cases, gold prices tend to rise alongside the US dollar, while stock and bond prices decline” . That’s essentially what we’ve just observed – minus the sharp stock decline (at least so far). It puts policymakers on notice: something is bubbling beneath the surface. The last time we saw gold and the dollar rising together was during episodes like the onset of COVID-19 and the 9/11 attacks – clear crises. This time, the “crisis” is more subtle: a slow burn of fiscal strains, geopolitical realignments, and creeping distrust in institutions.
For investors and professionals, the takeaways are clear. Diversification into hard assets is gaining momentum, and not without reason. Gold’s role as a portfolio stabilizer is reasserting itself; even at record nominal prices, it’s attracting huge inflows as a form of insurance. The traditional inverse relationship with the dollar is not sacrosanct – when confidence in both major fiat blocs (dollars and euros) is tested, gold can rise against all currencies at once. Silver’s concurrent jump and its industrial strategic importance highlight that this is a broader precious metals renaissance.
Finally, it’s worth pondering the source of the $200 gold move. The evidence suggests it came not from panic, but from prudence – a reallocation from the quiet corners of cash and currency reserves into the safety of bullion. If that is the case, this gold surge could very well be the early tremor before larger quakes. Investors are effectively voting with their wallets, and their message is a cautious one: prepare for potential storms by holding real assets. Gold’s unusual rally, defying the dollar gravity, might be the canary in the coal mine for broader shifts to come – from an era of easy money and faith in central banks to one where tangible value and trust (or the lack thereof) drive decisions. As always, gold is both a barometer and a beneficiary of such paradigm shifts.
Sources:
Reuters – “Gold hits a record $3,532…main drivers fueled by U.S. President Trump’s upending of policy and Fed independence concerns.”
ETF.com – “GLD led all ETFs last week, hauling in $2.3B as gold flirted with $3,500.”
Reuters – “Gold tops $3,500… FT: ‘Gold surges after Trump’s Fed pressure’… Bloomberg: ‘Record high as rate-cut bets fuel demand.’”
BullionVault – Order flow: “Asian gold ETFs shrank…while European and North American products have now expanded together in 7 of the past 8 weeks, the strongest stretch in 27 months.”
Reuters – Physical market: “As gold prices jump… customers race to cash in old jewellery… If the rush to sell continues, could temper gold’s rally.”
BullionVault – “Dollar gold hit new highs…but Euro and Yuan price of gold held beneath spring highs”
BullionVault – COT data: “Net long position of Managed Money traders 4-year high…155% of long-term average.”
Reuters – “Silver breached $40, highest since 2011… momentum traders involved after US proposal to label silver a critical mineral helped fuel the surge.”
BullionVault – “Western stock markets dropped only 1.5% from last week’s record… long-term gov’t debt fell, driving yields higher, even as gold rose.”
ECB Financial Stability Review (via Frank Holmes) – “Gold now represents 20% of global FX reserves vs 16% for the euro – first time gold’s share exceeds euro’s.”
Reuters – Christine Lagarde: “France is solid but any risk of a government falling in the euro zone is a concern.”
Reuters – “Annual central bank gold purchases have exceeded 1,000 tons since 2022, double the 2010s average”
World Gold Council – “Gold ETFs saw 397t inflows Jan-June 2025, the largest first-half inflow since 2020.”
ECB Research – “In extreme cases (9/11, pandemic onset), gold prices tend to rise alongside the US dollar while stock and bond prices decline markedly – confirming gold’s safe-haven role in times of stress.”
- Gold trades near record highs on US rate cut bets; silver at 14-year high | Reuters
- Gold Surpasses Euro as the Second-Largest Reserve Currency in the World
- What does the record price of gold tell us about risk perceptions in financial markets?
- Gold Tops $3500 Record Price | Gold News
- Gold ETF Inflows Lead $34.3B Surge Into U.S.-Listed ETFs
- Gold ETF Investing Flips from East to West | Gold News
- After the gold rush: Asian, Mid-East sellers flood jewellery market | Reuters
- Central bank demand propels safe-haven gold to record peak | Reuters
- Explainer: Gold's record-breaking rally: who's keeping it going? | Reuters
- Global flows stay hot | World Gold Council
- France's far-right RN says it is getting ready for potential snap elections | Reuters
- Eurozone Financial Crisis: Debt and Derivative Dangers

Silver XAGUSD Overextended With Range-Bound Price Action🥈 XAGUSD (Silver) is overextended in my view 📈. Price has recently pushed into new highs 🔼 and is now moving sideways in a range 📊—often a sign that larger entities 💼 may be working their orders.
⚖️ This could be a form of distribution, as silver has moved into a zone of thin liquidity 🌊. To facilitate bigger positions, institutions may need to generate liquidity by keeping price sideways ⏸️ before the next move.
📉 My current bias is for a retracement back into equilibrium ⚖️ and towards an unresolved bullish imbalance 🔍 that remains below.
⚠️ This is for educational purposes only, not financial advice 📚

Explaining Fibonacci Retracement/Extension levelsThis video is designed to help teach you why I use the Fibonacci Defense levels as components of price action and how I use Fibonacci retracement/extension levels (related to previous market trends).
Remember, the three components of price action are TIME, PRICE, & ENERGY.
If you don't understand how price is structured before attempting to use Fibonacci concepts, it's almost like trying to throw darts blindfolded.
You must break down the previous trends in order to try to understand what is happening with current price trends (expansion/contraction/phases).
Watch this video and I hope it helps all of you understand what the markets are doing and how to use Fibonacci Retracement/Extension levels more efficiently.
All types of technical analysis are validation tools - not guarantees. The only thing we get out of technical analysis is a way to validate or invalidate our expectations. A or B. Nothing else.
Get some.
#trading #research #investing #tradingalgos #tradingsignals #cycles #fibonacci #elliotwave #modelingsystems #stocks #bitcoin #btcusd #cryptos #spy #gold #nq #investing #trading #spytrading #spymarket #tradingmarket #stockmarket #silver

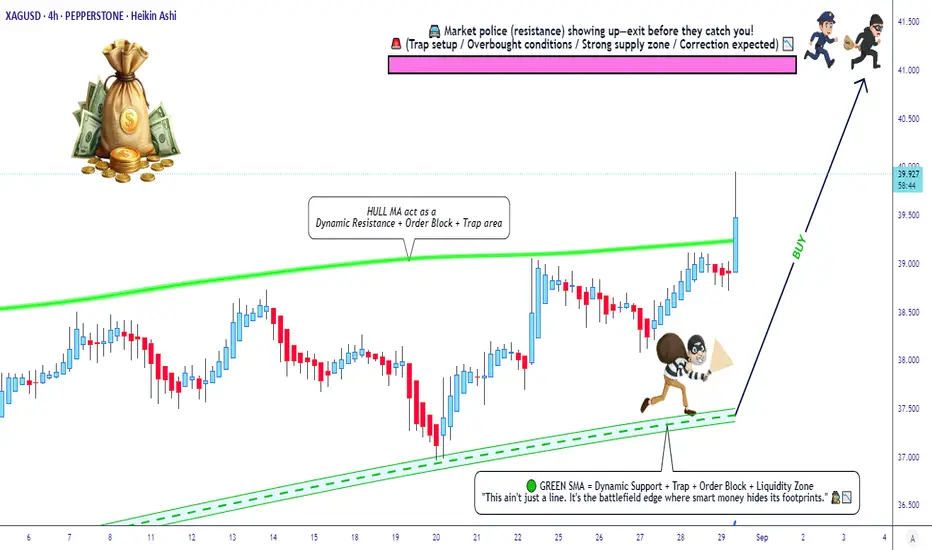
XAG/USD Market Robbery Plan – Entry, SL, and Escape Route💎 XAG/USD Silver vs U.S Dollar Heist Plan (Swing/Scalping Trade) 💰🚀
🌟Hello Money Makers, Robbers & Thief OG’s🌟
The vault is open… and this time it’s SILVER (XAG/USD)! ⚡
Based on our 🔥Thief Trading Style🔥, here’s the robbery blueprint:
📈 Entry (The Break-In):
The thief doesn’t wait at the door… we layer in quietly. Place multiple buy limit orders at:
(39.900)
(39.700)
(39.500)
(Feel free to add more layers if you want to expand the robbery bag 🏦).
Any pullback = our silent entry.
🛑 Stop Loss (Thief Escape Route):
This is Thief SL @38.700.
But remember, dear Ladies & Gentleman (Thief OG’s), adjust SL according to your own risk appetite & position size.
🎯 Target (The Police Barricade 🚓):
Police waiting heavy at 42.000 – so don’t get caught!
Our escape van target is set @ 41.000 💰.
Grab the loot and vanish before the chase starts! 🏃♂️💨
💎 Thief Notes:
Silver shines but can trap greedy robbers. Always layer in wisely, manage risk, and respect the Thief Code.
⚠️ Trading Alert:
Beware of sudden news explosions 📢 – they trigger alarms in the market vault! Use trailing SL if the loot gets heavy.
🔥💵 Support our robbery squad 💥Hit the Boost Button💥 to fuel the getaway car 🚘💨.
Every like = more strength for our crew. Stay sharp, stay stealthy, and keep robbing the market with Thief Trader Style! 🏆🥷💰
#SilverHeist #XAGUSD #ForexThief #SwingTrade #ScalpingPlan #LayeringStrategy #ThiefTrader #MarketRobbery #BullishSilver #SmartTrading
SILVER (XAGUSD): The Next Resistance
Here is my latest structure analysis for Silver.
With a current bull, run the price successfully violated
39.0 - 39.5 supply area that turned into a demand zone now.
The closest strong supply zone that I see is based on a major
rising trend line and 41.0 psychological level.
It looks like the price may easily reach that soon.
❤️Please, support my work with like, thank you!❤️
I am part of Trade Nation's Influencer program and receive a monthly fee for using their TradingView charts in my analysis.

Silver - Expecting Bullish Continuation In The Short TermM15 - Strong bullish momentum.
No opposite signs.
Until the two Fibonacci support zones hold I expect the price to move higher further.
If you enjoy this idea, don’t forget to LIKE 👍, FOLLOW ✅, SHARE 🙌, and COMMENT ✍! Drop your thoughts and charts below to keep the discussion going. Your support helps keep this content free and reach more people! 🚀
--------------------------------------------------------------------------------------------------------------------
