Why the Same Strategy Performs Differently in Crypto and ForexMany traders experience the same frustration. A strategy shows consistency in one market and breaks down in another. The instinctive reaction is to question the rules, indicators, or entries. In most cases, the strategy is not the problem. The environment is.
Crypto and Forex operate under very different structural conditions. Crypto trends tend to expand faster, with sharper volatility and deeper intraday swings. Liquidity is thinner, order books change rapidly, and price frequently overshoots levels before stabilizing. Forex moves more slowly, with deeper liquidity and more controlled reactions, especially during active sessions.
These differences change how a strategy behaves in practice. Stop placement that works well in Forex can be too tight for Crypto, where routine volatility regularly exceeds technical boundaries. Profit targets that feel conservative in Crypto may be unrealistic in Forex, where expansion unfolds more gradually. The logic of the setup remains sound, but the execution parameters no longer match the market.
Time also plays a role. Crypto trades continuously, meaning trends can develop at any hour and extend without the pauses created by session boundaries. Forex activity is concentrated around specific windows, and strategies often perform best when aligned with those periods. Running the same rules outside their optimal timing reduces effectiveness.
Risk sequencing further amplifies these differences. In Crypto, clusters of volatility can create rapid drawdowns even when the strategy remains statistically valid. In Forex, losses are often more evenly distributed, allowing smoother equity curves. Traders who do not adjust position sizing or expectations misinterpret this as inconsistency.
Successful traders adapt execution while preserving logic. Entry criteria, risk models, and trade management evolve to fit the market’s structure. The strategy stays the same. The application changes. Understanding this distinction is what allows traders to remain consistent across asset classes rather than constantly searching for something new.
Silver

Gold analysisGold is soaring down and there is no similar occasion in history. I believe this was caused by social media popularity, which pushed gold and silver in an unhealthy way through an insane amount of leveraged positions. Institutions saw this as an opportunity, triggering a domino effect where every single position liquidated caused another liquidation, moving the price insanely down.
I can see from the chart that the price is touching a support level, but cumulative delta is not confirming the price. This suggests an exhaustion and that the price can push back up again. You can find these indicators on my profile, named Trendlines and Institution Radar.
Where do you think gold and silver will move next?

XAUUSD: immediate prospects🛠 Technical Analysis: On the H4 chart, Gold has printed a sharp reversal from the major resistance zone near 5,600, triggering an aggressive bearish impulse back into the 5,000 area. The move suggests a classic “blow-off + pullback” phase, where price stabilizes after an extended rally before the next leg forms. The previously broken structure around 5,100 is now acting as a key pivot zone — if price fails to reclaim it, sellers keep control. XAUUSD is trading below the SMA 50, while still above the SMA 100 and SMA 200, pointing to a corrective decline inside a larger uptrend. The chart highlights a likely accumulation range around 5,000, which can lead to continuation lower if distribution persists. The next downside objective aligns with the marked support at 4,586, with a deeper target toward the lower support zone around 4,300. A sustained recovery back above 5,100 and the SMA 50 would weaken the bearish scenario and favor stabilization.
———————————————
❗️ Trade Parameters (SELL)
———————————————
➡️ Entry Point: Sell on consolidation below 5,100
🎯 Take Profit: 4,586.53 (extended target: 4,300)
🔴 Stop Loss: 5,210.39
⚠️ Disclaimer: This is a potential trade idea based on current analysis; market conditions and price direction are subject to change based on news factors and volatility.

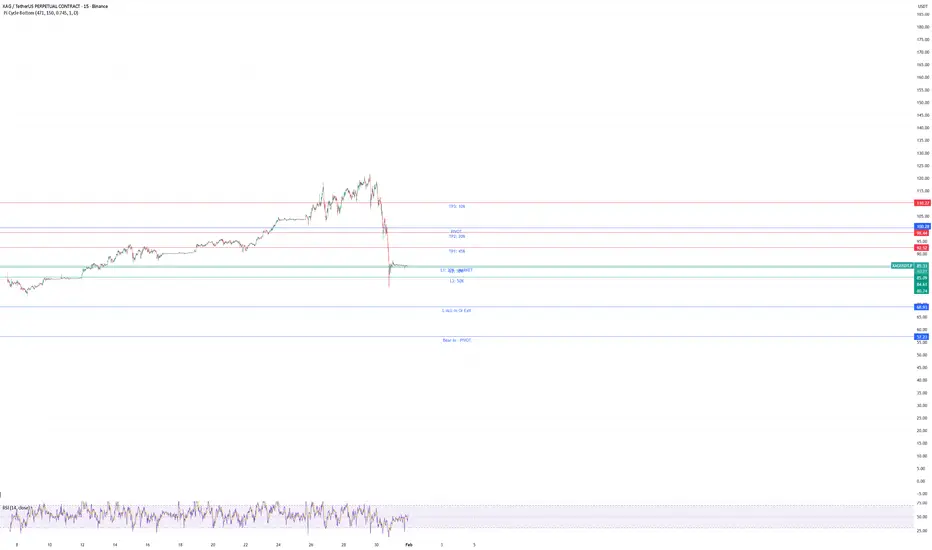
Silver Panic Drop → Distribution at 85 |Sell-Side Liquidity PlayOne day before this setup, Silver printed a heavy bearish displacement
from 121.6920 → 74.2869 — clear panic selling.
That move already told us one thing:
buyers were forced out, control shifted to sellers.
Now price has retraced and is distributing near 85.5144, forming a double top before the 0.5 Fibonacci retracement.
🧠 Trade Logic:
Strong bearish impulse = bearish bias
Retracement = corrective, not bullish
Double top near 85.5144 = early distribution
Entry taken before full 0.5 Fib
Stop-loss placed beyond 0.5 Fib (clean invalidation)
Target = sell-side liquidity below recent lows
This is not chasing price.
This is selling weakness after a panic move.
If price holds above 0.5 Fib → idea invalid.
If sellers stay in control → liquidity is the magnet.
👉 Like if you trade structure
👉 Comment if you see the same distribution
👉 Follow for clean, no-noise metals setups

Medium-Term Pause in the silver bull?From 2020 Lows, it is possible to consider the larger Wave 3 up over. If this plays out, then the Wave 4 correction will last longer than expected and hurt in terms of time as well than just the price. For context - Wave 2 lasted 2 years.

Is Silver Dead?Silver sold down strongly on Friday, and is now basing off a strong support zone. Not surprised to see a recovery to $100/ounce before the next course of action.

$SPY & $SPX — Market-Moving Headlines Week of Feb 2–6, 2026🔮 AMEX:SPY & SP:SPX — Market-Moving Headlines Week of Feb 2–6, 2026
🌍 Market-Moving Themes
💥 Anti-Fiat Unwind
Gold, Silver, and Crypto suffer forced liquidation as capital rotates out of crowded hedges
🧠 AI Earnings Take Center Stage
GOOGL, AMZN, PLTR headline a second straight AI earnings stress test week
🏭 Manufacturing vs Services Split
Weak manufacturing data contrasts with resilient services, complicating the growth narrative
👷 Labor Market Reality Check
ADP, Jobless Claims, and Friday’s Jobs Report will drive Fed cut expectations
🌏 Emerging Market Pressure
India budget selloff highlights fragility across EM, raising spillover risk to EEM
📅 Post-FOMC Re-Pricing
Markets digest last week’s Fed tone through hard data instead of rhetoric
📊 Key U.S. Economic Data — Feb 2 to Feb 6 (ET)
MONDAY, FEB. 2
- TBA Auto sales Jan | Previous: 16.1M
- 9:45 AM S&P flash U.S. manufacturing PMI Jan | Previous: 51.9
- 10:00 AM ISM manufacturing Jan | Actual: 48.4 | Forecast: 47.9
TUESDAY, FEB. 3
- 9:45 AM S&P final U.S. services PMI Jan | Previous: 52.5
- 10:00 AM Job openings Dec | Actual: 7.1M | Previous: 7.1M
- 10:00 AM ISM services Jan | Actual: 53.5 | Previous: 54.4
WEDNESDAY, FEB. 4
- 8:15 AM ADP employment Jan | Actual: 45K | Forecast: 41K
THURSDAY, FEB. 5
- 8:30 AM Initial jobless claims Jan 31 | Actual: 212K | Previous: 209K
- 10:50 AM Atlanta Fed President Raphael Bostic speaks
FRIDAY, FEB. 6
- 8:30 AM U.S. employment report Jan | Actual: 55K | Forecast: 50K
- 8:30 AM U.S. unemployment rate Jan | Actual: 4.4% | Previous: 4.4%
- 8:30 AM U.S. hourly wages Jan | Actual: 0.3% | Previous: 0.3%
- 8:30 AM Hourly wages YoY | Actual: 3.6% | Previous: 3.8%
- 10:00 AM Consumer sentiment prelim Feb | Actual: 54.0 | Previous: 56.4
- 3:00 PM Consumer credit | Actual: $8.0B | Previous: $4.2B
⚠️ Disclaimer: For informational purposes only. Not financial advice.
📌 #SPY #SPX #Macro #JobsReport #NFP #Earnings #AI #Crypto #Gold #Markets #Options

DXY – End of the Dollar Advantage? Shorting a Broken TrendThe U.S. Dollar Index has broken below key multi‑year levels and printed a fresh four‑year low after losing its interest‑rate advantage, as the Fed shifts from fighting inflation to cutting rates to defend growth. With cumulative rate cuts of up to 75–100 bps expected in 2026 and capital already flowing out of U.S. assets into higher‑yielding Eurozone and EM markets, the structural bid under the dollar is fading and rallies are increasingly being sold. At the same time, aggressive fiscal deficits, political pressure on the Fed from the Trump administration, and growing talk of de‑dollarization are undermining confidence in the dollar as a safe‑haven, reinforcing the bearish macro backdrop. Technically, DXY has cleanly broken the 97.0 floor, extending a downtrend from 2025 and confirming a sequence of lower highs and lower lows, so my bias is to sell corrective bounces back into broken support / fresh supply and target continuation toward the 95–97 handle in line with major bank forecasts for another 3–5% downside this year.

SILVER: Still Bullish? Buy This Massive Dip?In this Weekly Market Forecast, we will analyze the XAGUSD (SILVER) for the week of Feb. 2-6th.
Silver took a -30% dive Friday, upon the nomination of new Fed Chair by Pres. Trump. The market reacted by transferring funds out of the metals and into the USD. But don't be fooled! This was not a reversal, or correction to the parabolic move by Silver. It was an opportunity to get in at a discount for investors!
None of the market conditions that caused the bull run have changed. The up trend was not broken. That's all still in place. Therefore, there is no reason to change the bullish outlook.
For investors, Dollar Cost Averaging is your friend now.
For traders, let the market show you the pullback is over by looking for a bullish break of structure on the HTFs, no less than the Daily TF. Then and only then are buy entries valid.
Enjoy!
May profits be upon you.
Leave any questions or comments in the comment section.
I appreciate any feedback from my viewers!
Like and/or subscribe if you want more accurate analysis.
Thank you so much!
Disclaimer:
I do not provide personal investment advice and I am not a qualified licensed investment advisor.
All information found here, including any ideas, opinions, views, predictions, forecasts, commentaries, suggestions, expressed or implied herein, are for informational, entertainment or educational purposes only and should not be construed as personal investment advice. While the information provided is believed to be accurate, it may include errors or inaccuracies.
I will not and cannot be held liable for any actions you take as a result of anything you read here.
Conduct your own due diligence, or consult a licensed financial advisor or broker before making any and all investment decisions. Any investments, trades, speculations, or decisions made on the basis of any information found on this channel, expressed or implied herein, are committed at your own risk, financial or otherwise.

Silver is once again on a path that will lead to higher goals!Given the trend that began at the beginning of 2020, it seems that this precious metal has found a special place among investors and is consolidating itself in this position.
It should be noted that for whatever reason this consolidation occurs, the goals above $ 100 per ounce of silver are achievable.
The lagging behind the price of silver in comparison to the growth of the price of gold indicates attractive investment opportunities and, to quote us "noble Iranians", "maybe too soon is too late!"
What has caused silver to grow faster than gold?Considering the fluctuations of silver and the price movement model and the silver chart, it is reporting a price movement towards a price target in the range of $87 per ounce!
What seems to be the main question is why the price of silver is moving faster than gold and why does silver need to fill its price growth gap with gold at this time??!!
The link below is the path to past silver analysis:

Silver crash: is the bounce real or a bull trap?Silver and gold start the week in damage control. Last week’s dramatic move wiped out over US$15 trillion in value as silver crashed ~30% and gold ~10%.
What matters now is whether price action confirms that sellers are still in control.
The current bounce visible on the 4H chart still leaves silver well below the 20-day moving average ($92 on the 1-day chart). $91–92 is the next overhead test, followed by the $97–100 range if bulls regain control. Unless silver forms a clear base with higher lows, this could remain a high-volatility correction environment.
Despite the crash, silver could retain its longer-term bullish tailwinds, including industrial demand, safe-haven interest, and a persistent supply deficit.

SILVER: Will Start Growing! Here is Why:
Balance of buyers and sellers on the SILVER pair, that is best felt when all the timeframes are analyzed properly is shifting in favor of the buyers, therefore is it only natural that we go long on the pair.
Disclosure: I am part of Trade Nation's Influencer program and receive a monthly fee for using their TradingView charts in my analysis.
❤️ Please, support our work with like & comment! ❤️

Silver: record volume at the highs — selling priorityThe price corrected with a wick below the second zone (86.5–80), but ultimately held within it, stopping at 85.18.
Hi traders and investors!
Weekly timeframe
The price came close to, but did not quite reach, the lower boundary of the buyers’ initiative at 70.07 and technically may still move into this area.
At the same time, in the latest weekly candle the main volume was accumulated at the top, within the 107,000–113,000 range.
This is the largest weekly volume in history (!).
Daily timeframe
The daily chart shows a similar picture: the candle also printed record volume (!), with volume again accumulated in the upper part of the candle.
Given the overall context, buying is not a priority — it is more reasonable to focus on selling setups.
Hourly timeframe (H1)
On H1, the seller’s initiative is in control, and its range is clearly visible on the chart.
There was a test of the key initiative candle (KC on the chart).
Short positions may be considered on a manipulation (false breakout) of the test level at 86.50. An additional confluence would be price interaction with the 50% of the trading range at 88.70.
It is also visible on the hourly chart that volume has started to build around the daily level at 84.03. If volume accumulation continues, a bounce toward the 104,000–108,000 area is possible, where short positions can again be considered.
Profitable trades!
This analysis is based on the Initiative Analysis (IA) method.

Is silver catching its breath—sideways before another leg up?Silver’s had a strong run since Nov ’25 and now looks ready to cool off. Sideways action seems likely. As long as range 75 holds, the bigger bullish picture stays intact. Bulls would need to clear range 114 to push higher—probably not right away. Let it settle, then watch for the next move.

Is gold consolidating sideways before its next leg higher?After a strong run since Nov ’25, gold might need to catch its breath. Sideways action could be the setup for another leg higher. As long as 4500 holds, the uptrend stays intact. Expect consolidation for the remainder of February.

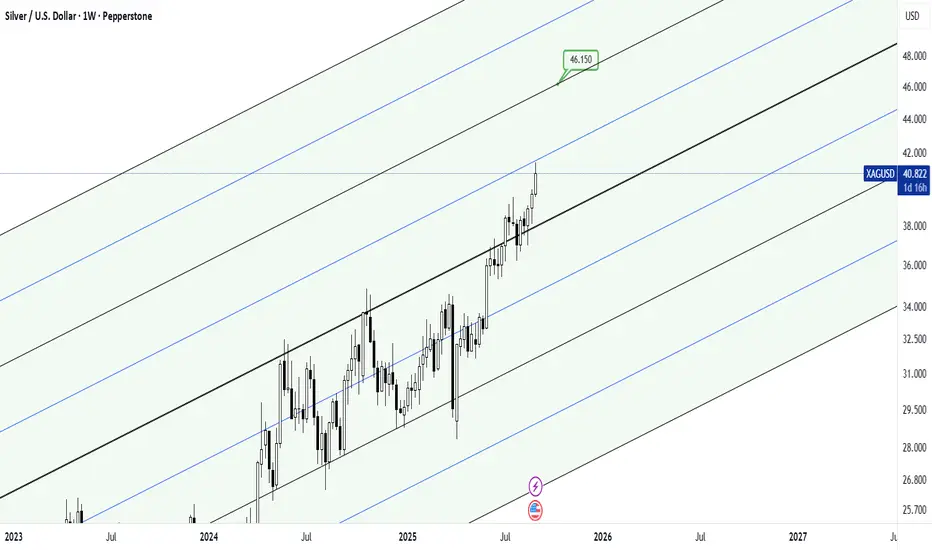
XAGUSD, Elliott wave analysis■Outlook of XAGUSD on 1W chart.
In the previous analysis, a long-term outlook for XAGUSD was presented using the 1M chart.
In this analysis, I have illustrated the internal structure of upper degree wave (5).
On the chart, the red wave represents the base degree, the orange wave is one degree lower, and the green wave is another degree below that.
From 2020 to April 2025, Waves 1 and 2 appeared across all three degrees, and a strong upward movement emerged as the Wave 3s (3-(ⅲ)-(3)) at each degree interacted with one another.
This composite wave interaction resembles a waveform reconstructed through an inverse Fourier transform.
At present, it is highly likely that Wave (4) has begun in the degree two levels below the base. However, since the higher‑degree Wave 3 (3-(ⅲ)) has not yet been completed, the broader trend still has room to extend further. The current wave is supported by the red channel line, and once the time correction is complete, the bullish trend is expected to resume.
■Previous analysis (Jan 25, 2026)

Silver vs M1 - More Upside?Commodity cycles should be viewed from a large macro perspective (Yearly Chart). From a support/resistance standpoint, assuming M1 at 21T next year, this would equate to approximately $120 for Silver. Pressures from silver shortages in the BRICS alliance are contributing to the demand.

[LOI] - SILVERKey Points:
- JP. Morgan is reputable for manipulating Silver markets, having been fined. Not impossible that as this dump was not followed by the Shanghai Spot physical, SILVER derivatives, likely to match price upwards after the weekend.
Notes on how I personally use my charts/NFA:
Each level L1-L3 and TP1-TP3 (Or S1-S3) has a deployment percentage. The idea is to flag these levels so I can buy 11% at L1 , 28% at L2 and if L3 deploy 61% of assigned dry powder. The same in reverse goes for TP. TP1: 61%, TP2:28% and TP3:11%. If chart pivots between TP's, in-between or in Between Sell levels these percentages are still respected. I like to use the trading range to accumulate by using this tactic.
Just my personal way of using this. This is not intended or made to constitute any financial advice.
This is not intended or made to constitute any financial advice.
NOT INVESTMENT ADVICE
I am not a financial advisor.
The Content in this TradingView Idea is for informational purposes only, you should not construe any such information or other material as legal, tax, investment, financial, or other advice. Nothing contained within this idea constitutes a solicitation, recommendation, endorsement, or offer to buy or sell any securities or other financial instruments in this or in in any other jurisdiction in which such solicitation or offer would be unlawful under the securities laws of such jurisdiction.
All Content on this idea post is information of a general nature and does not address the circumstances of any particular individual or entity. Nothing in the idea/post constitutes professional and/or financial advice, nor does any information on the idea/post constitute a comprehensive or complete statement of the matters discussed or the law relating thereto. You alone assume the sole responsibility of evaluating the merits and risks associated with the use of any information or other Content on the idea/post before making any decisions based on such information.
Sir. Galahad - QUANT
Disclaimer
The information and publications are not meant to be, and do not constitute, financial, investment, trading, or other types of advice or recommendations supplied or endorsed by.
Update idea
Add note
SirGalahad-QUANT
Disclaimer
The information and publications are not meant to be, and do not constitute, financial, investment, trading, or other types of advice or recommendations
Silver Drops More Than 31% — Is This Silver Friday?This Friday, silver experienced a drop of more than 31%, one of the sharpest declines seen in decades.
When I analyzed historical data, I found only one comparable event with a larger short-term collapse: Silver Thursday in March 1980.
That naturally raises the question:
👉 Are we witnessing a modern version of Silver Thursday?
👉 Or should we call this a “Silver Friday”?
A Brief Reminder: What Was Silver Thursday?
In March 1980, silver prices collapsed by nearly 50% in a single session.
The backdrop was extreme:
Prices had surged from ~$6 to almost $50 in less than two years
The rally was driven by heavy leverage and position concentration
The Hunt brothers controlled a massive share of the silver market through futures and physical holdings
When exchanges (notably COMEX) raised margin requirements and imposed liquidation-only rules, forced selling kicked in.
Liquidity vanished, margin calls cascaded, and prices collapsed violently.
Silver Thursday became a textbook example of how leverage and rule changes can destroy a market in days.
Is Today the Same Situation?
Short answer: no — not really.
While the magnitude of the drop looks dramatic, the structure of the market is very different.
What drove the silver rally in 2025?
Momentum-driven inflows
Strong speculative positioning
Catch-up trade vs gold
Short-term narrative around inflation and monetary uncertainty
But importantly:
No major supply shock
No structural shortage
No sudden change in long-term fundamentals
This was not a multi-year cornering attempt like in 1980.
What Actually Happened This Friday?
Rather than a systemic breakdown, this move looks like:
A violent deleveraging
A reset of overextended positioning
The unwinding of a few weeks of extremely fast price appreciation
In other words, silver didn’t collapse back to “fundamental value” —
it simply gave back a short period of excessive growth.
Final Thought
Large percentage drops feel historic in real time.
But context matters.
In 1980, silver collapsed because the market structure broke.
In 2026, silver dropped because the rally got ahead of itself.
Same metal.
Very different story.

Commodities Don’t Move Together… They Take TurnsOne mistake I see a lot of traders make
they treat commodities like one big trade.
Gold, silver, oil, copper… same button, same mindset.
But commodities don’t move together.
They rotate.
Gold usually speaks first.
Not because growth is strong, but because confidence is changing. Liquidity shifts, risk perception shifts, and gold quietly reacts.
Silver comes next.
That’s when protection starts turning into opportunity. Volatility increases. Participation increases.
Then you see it in the industrial metals.
Copper, platinum, palladium. This is where demand stops being a theory and starts showing up on the chart.
Energy tends to move later.
By then, growth is obvious and inflation is no longer a surprise. Oil isn’t early. It’s confirmation.
Most traders wait for confirmation.
Few pay attention to the sequence.
The goal isn’t to predict the entire cycle.
It’s to recognize where we are inside it… and stop trading the wrong phase.
That alone filters out a lot of bad decisions.
⚠️ Disclaimer: This is not financial advice. Always do your own research and manage risk properly.
📚 Stick to your trading plan regarding entries, risk, and management.
Good luck! 🍀
All Strategies Are Good; If Managed Properly!
~Richard Nasr

Silver levels to look forAfter the meltdown in the prices, the prices closed above 2025 high. From here what is the next course of action is all mentioned in the video.

AG | Silver Miners Will Rise | LONGFirst Majestic Silver Corp. engages in the production, development, exploration and acquisition of mineral properties. It owns and operates producing mines in Mexico including the La Encantada Silver Mine, La Parrilla Silver Mine, San Martin Silver Mine, La Guitarra Silver Mine, Del Toro Silver Mine, Santa Elena Silver & Gold Mine, and San Dimas Silver & Gold Mine. The company was founded by Keith Neumeyer on September 26, 1979 and is headquartered in Vancouver, Canada.
