Silver’s 2025 Explosion — How High Can It Go?In 2025, Silver ( OANDA:XAGUSD ) has experienced a remarkable surge, making it one of the most notable assets of the year. As we approach the end of 2025, I’ve decided to analyze silver to see how far its bullish trend might continue. So, stay with me as we delve into the reasons behind silver’s rise and explore how far this upward momentum could go.
Let’s begin by looking at the fundamental factors driving silver’s increase in 2025. After that, we’ll move on to the technical analysis.
Fundamental Drivers Behind Silver’s Massive 2025 Rally:
Structural Supply Deficit — Multi‑year deficits draining inventories, tight physical market.
Strong Industrial Demand — Solar, EVs, semiconductors & data centers consuming silver at record levels.
Rate Cut Expectations — Anticipated Fed easing lifts non‑yielding assets like silver.
Safe‑Haven Flows — Geopolitical risk, inflation, and a softer dollar boosting precious metals demand.
Liquidity & Momentum — Smaller market vs gold( OANDA:XAUUSD ) amplifies swings, attracting speculators.
Silver has surged ~ 150–165% YTD , setting fresh all‑time highs as both an industrial metal and investment hedge.
-----------------------
Technical Analysis:
Now, considering the technical side, with less than five days remaining before the six-month and one-year candles close, I’ll focus on a higher time frame for silver’s analysis. Recently, silver achieved a new all-time high, capturing widespread attention, and many prominent figures are now discussing silver’s potential.
From a classic technical analysis perspective on the six-month time frame, it appears that silver has formed a bullish continuation pattern, specifically a cup and handle pattern, and the recent six-month candle has broken the neckline/resistance zone($50-$34) with strong volume. This suggests that the bullish trend for silver is likely to continue.
From an Elliott Wave perspective, it seems that silver is completing wave 3, potentially within an ascending channel and a Potential Reversal Zone(PRZ) .
I expect that silver, upon entering this Potential Reversal Zone(PRZ) , will undergo a correction. If you’re considering adding silver to your portfolio, it’s wise to wait for that correction, as buying at all-time highs can be riskier due to the strong upward momentum.
What do you think? How far can silver’s bullish trend extend, and what levels might we see in 2026?
💡 Please respect each other's opinions and express agreement or disagreement politely.
📌 Silver/ U.S. Dollar Analyze (XAGUSD), 6-month time frame.
🛑 Always set a Stop Loss(SL) for every position you open.
✅ This is just my idea; I’d love to see your thoughts too!
🔥 If you find it helpful, please BOOST this post and share it with your friends.
Silveranalysis

#SILVER(XAGUSD): Another Big Buy In Making, 2026 We Are Ready! **SMC|ICT Based Analysis On Silver (XAGUSD)**
Dear Traders,
We extend our best wishes for the upcoming New Year.
🔺Today, we will analyse Silver (XAGUSD). The month of December typically presents reduced market liquidity and volume due to numerous holidays. The market initiated with a positive liquidity gap at $83.50, subsequently experiencing a significant decline. The price descended to $70.44 and is currently trading at $71.51. This substantial sell-off indicates a high probability of further price depreciation. We anticipate the price to fall within the range of $68 to $66.
🔺Entering a position within our identified key levels may prove profitable, with take-profit targets established at the following key levels: the first at $75, the second at $78, and the swing key level at $85. These levels should be utilized as take-profit objectives. For stop-loss placement, we suggest setting it at $66, or at your discretion.
🔺We wish you a prosperous New Year and hope this year fulfils your aspirations. We sincerely appreciate your continued support throughout the years.
Team SetupsFX_

Bitcoin, Gold and Silver compared since Nov 2021 - whats next ?ALL CHARTS ARE WEEKLY>
As many will know, November 2021 saw Bitcoin retreat into a DEEP bear market that lasted until Jan 2023.
From January 2023, we have seen Bitcoin Rise from Around $15K to a New ATH of around $126K, a staggering 722% rise in less than 2 years.
But how does this compare to Gold and Silver in that same time period ?
For Gold, the best Tool is the BTC XAUt Chart, the GOLD Bitcoin trading pair.
That is the main chart above;
From Nov 2021 to Jan 2023, Bitcoin Lost 75 % to Gold.
From Jan 2023 to December 2024, Bitcoin Gained 268% Over Golds rise at the same time.
From Dec 2024 to the current date, Bitcoin has Lost 53%. to Gold.
So we See Bitcoin Long Term holder still in profit over Gold.
BUT is the current Draw Down is Bitcoin likely to continue and will Gold continue to rise ?
Impossible to say for sure as you know.....
But we can get some ideas from looking at the Gold USD Chart
I found it very interesting that for the period that Bitcoin was in a DEEP bear, Gold did little on a basis that, from the start of the BTC bear to when it ended, we had GOLD at the same price. It has Risen, lost its gains, and rose back to the starting point.
Once the Bitcoin Bull Market began in Jan 2023, BTC rose 269% above the Gold usd price rise of 49.7%
Bitcoin bacame overSold in Octobwe 2025 and, to date, has lost 53% to Gold USD price.
In the same time period. Gold has risen 75% in USD price.
BUT......Look at the Gold Price Action.
Look at those BOLD Fibomacci Lines. Gold has hesitated on each of the 1, 2 and 3 Fib lines and PA has just reached up to the 4.
Could we be about to see a pause in Golds Rise in value ?
Lets look at the Bitcoin Gold chart again quickly.
Bitcoin has just arrived on the lower trend line of the descending channel.
It also intersects with a Horizontal line of support.
We may see Bitcoin Rise against Gold on a BTC XAUt chart?
This can be done in a number of ways.
Golds price can Drop quicker that Bitcoins if both assets get rejected. This would see the BTCXAUt PA Rise.
OR, if Gold Ranges / dropsn under that 4 Fib line and Bitcoin Rises a little......the same BTCXAUt PA pattern happens.
It may be wirtg noting that some charts point to a continued drop in BTCUSD price.......
If that happens and Gold Ranges / Rise, all the ideas above become invalidated.
It may also be worth noting GOLD is becoming Over Bought.
So now we turn to SILVER>...
To me, this chart reminds me So much of the Low Cap crypto ALT Coins on the 2021 Bitcon Bull run.
Parabolic rises and sudden sharp sell offs.
Is Silver The Metals "Alt" Coin ?
I think so.....but we may not get that Flash crash.
Since the Start of this Bitcoin run since Jan 2023, we saw Silver Rsie 65% in USD price.
Since Bitcoin has begun cooling off, we have seen a parabolic rise of 177%
The 2 and the 4 Fib lines were rejection zones but since then.......No stopping Silver.
Can it continue ?
In all honesty, if Gold is about to pause and Bitcoin continues to Range / Drop, it may well continue the parabolic rise UNTIL PEOPLE BEGIN TAKING PROFITS..
And then it will act like a low cap ALT coin in the Crypto market......
Fot Me, that will begin to happen at the 10 Fib extension......The $100- Silver ounce.
As for BITCOIN Versus BOTH these assets.......
I can see Bitcoin Beating Gold in the near term
The Weekly RSI
VERY oversold and in an area it has bounced from perviously..
However, Weekly MACD could drop durther
But on a 4 hour MACD, we do see a VERY bullish idea of a pennant.
So much to take in here but to conclude,
Bitcoin is ready to ouitperform Gold again.
Gold may follow its habit and Range under the 4 Fib line....
Silver is like a Teenager on a Moped for the first time, Flying like a rocket.....with dangers.
The 2 questions I ask myself...
1 - Can Silver maybe continue past $100
2- Is Bitcoin USD about to Bounce hard in January, reaching new ATH by Febuary / March?
I think Both are possible but Risky........and there lays another Question......
Have a safe and Happy New Year party all of you

SilverSilver prices found support around $75, and if they rebound from there, they could potentially reach new highs.
However, they will also encounter resistance around $78 and $81.
If the support level is broken, prices will fall back to between $72 and $69.

Silver likely to outperform Gold in coming decade upto 5-7X1. World Order Shifting
2. Cup and Handle pattern with Multiyear Breakout
3. Gold is mainly a monetary asset (central‑bank reserves, jewellery, investment), so its price is driven by interest rates, inflation expectations
Silver has a dual role: a precious metal plus a heavily industrial metal used in solar, EVs, electronics, data centres and other technology, so it benefits when both macro hedging demand and real‑economy demand rise together.
4. Silver is critical for photovoltaics and EVs: each solar panel uses roughly 20 grams of silver, and solar alone has grown to about 15–20% of total annual silver demand, with further growth expected through 2030.
5.EVs and high‑performance electronics use significantly more silver than internal‑combustion or legacy systems, so policy‑driven decarbonisation and AI/data‑centre build‑out act as structural demand tailwinds that gold does not enjoy.
6. China is one of the largest silver miners and the dominant refiner, and from 2026 it is introducing export controls that require licences to ship silver abroad, effectively tightening an already deficit global market
7. China contributes just 13% of overall silver production but one market study reports silver import growth of over 200% year‑on‑year from 2023 to 2024, and China hosts over 80% of global solar panel manufacturing and major EV and electronics capacity, so it absorbs a large share of the world’s silver used in photovoltaics, electronics and related technologies.
Cautions:
Silver is more volatile 1.5 to 2 times but historical returns are better than Gold.

Gold or Silver?Right now: SILVER!
I know, I know! Crazy schitt! Don't look at me!
The chart’s telling the story — Silver hasn’t even really started its move yet. Don’t blame me, I’m just reading the data.
Silver is up 87% year-over-year and outperforming gold by 11%, which is still on the low end historically.
That suggests Silver either has room to run from here, or it’s simply the safer relative play versus gold on a risk-adjusted basis.
If you’ve got space in your portfolio, it’s a reasonable addition.
If it hits nose-bleed levels, we reassess.
THANK YOU for getting me to 5,000 followers! 🙏🔥
Let’s keep climbing.
If you enjoy the work:
👉 Drop a solid comment
Let’s push it to 6,000 and keep building a community grounded in truth, not hype.

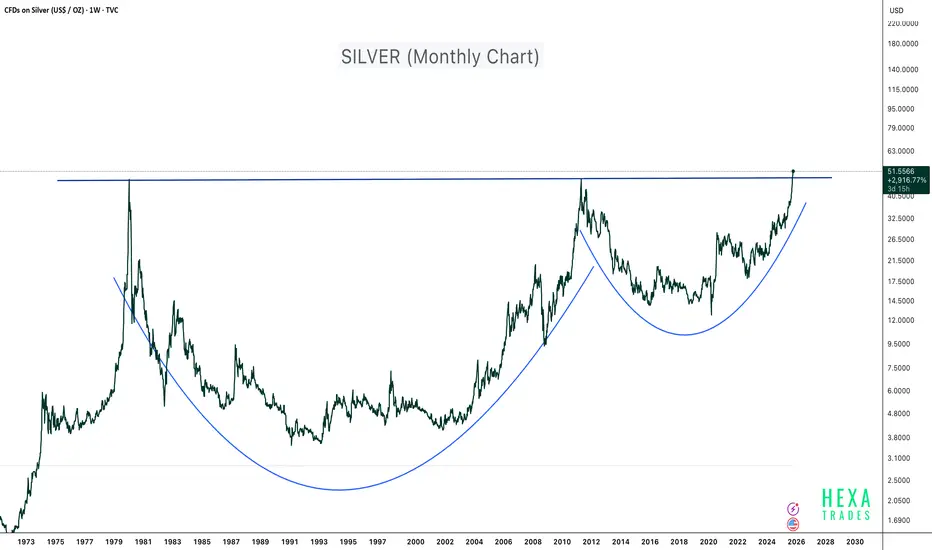
Silver - 45 Years of Breakout!Silver has just completed one of the largest and longest cup and handle patterns in financial history, spanning more than four decades. The metal has officially broken above the 1980 and 2011 highs, signaling a potential supercycle breakout on the monthly timeframe.
This type of long-term technical structure typically marks the beginning of a massive secular bull run, often driven by macroeconomic shifts such as inflation cycles, fiat currency debasement, and rising demand for hard assets.
Technical Highlights:
- Pattern: 45-year Cup and Handle formation
- Breakout Zone: Above $50 confirmed (Weekly chart)
- Structure: Deep base formation showing multiple accumulation phases (1981–2001 and 2012–2023)
Macro Perspective:
Silver is benefiting from:
- Increased industrial demand (especially in solar, EV, and electronics sectors)
- Inflationary monetary policies and growing global money supply
- Renewed investor interest in tangible and real assets
This breakout could mark the start of a multi-year bull run for silver. Long-term investors may view this as an opportunity to accumulate and hold for 10–15 years, aligning with the magnitude and duration of the pattern.
If the price experiences short-term pullbacks in the coming months, use DCA (Dollar-Cost Averaging) to build long-term exposure.
Conclusion:
After 45 years of consolidation, silver is finally breaking free. The chart points toward a historic structural breakout, potentially setting the stage for the next precious metals supercycle.
Cheers
Hexa
Disclaimer:
This analysis is for educational purposes only and does not constitute financial advice. Always conduct your own research and manage risk responsibly.
Silver - This metal is blowing up now!💣Silver ( OANDA:XAGUSD ) is rallying even higher:
🔎Analysis summary:
Just a couple of months ago, we witnessed another bullish break and retest on Silver. It was quite obvious that Silver will rally accordingly and just recently, we experienced another +150% rally. However, looking at the higher timeframe, Silver is still not done.
📝Levels to watch:
$100
SwingTraderPhil
SwingTrading.Simplified. | Investing.Simplified. | #LONGTERMVISION

Silver- Monthly TFLook at how far we are extended above the 21 SMA on the monthly TF, the same is the case for any TF- weekly included. Usually such huge divergences even out, the last time we were at $50 peak in 2011, it was similar and we know what happened. It may not play out the same over the next 14 years, but we have to be wary especially if holding bags and in gains or if trying to enter now, which has more risk v reward imho

Silver Price Hits a Record High Near $72Silver Price Hits a Record High Near $72
On 12 December, we noted that silver had climbed above $60. It took the market less than two weeks to advance further and clear the next psychological milestone at $70.
Today, XAG/USD reached $72, extending the sharp rally that began in the autumn. Gold prices have also been showing strong momentum.
The surge in precious metals has been driven by:
→ robust ETF buying from retail investors;
→ rising geopolitical tensions (media reports suggest the US has deployed additional military forces close to Venezuela);
→ reduced liquidity during the holiday period. Thin trading conditions often leave markets exposed to abrupt price swings.
Technical Analysis of XAG/USD
When reviewing the XAG/USD chart two weeks ago, we:
→ identified an ascending channel (marked in blue);
→ outlined the possibility of a pullback from the channel’s upper boundary.
Since then (as indicated by the arrows):
→ the price retreated twice from the upper boundary on 12 and 16 December;
→ on 17 December it broke above the channel;
→ on 19 December the former resistance acted as support, allowing buyers to consolidate above the blue ascending channel.
The current move is characterised by a steep upward trajectory (shown in orange), with the breakout above the $70 psychological level appearing decisive.
With silver trading this morning close to the upper edge of the orange channel and the RSI in overbought territory, the market looks vulnerable to a corrective pullback. Indeed, long holders may be tempted to lock in profits after a gain of nearly 30% since the start of the month.
That said, the unique dynamics of holiday trading could still fuel an attempt to push towards the $80 level.
This article represents the opinion of the Companies operating under the FXOpen brand only. It is not to be construed as an offer, solicitation, or recommendation with respect to products and services provided by the Companies operating under the FXOpen brand, nor is it to be considered financial advice.

DEC.21,2025 ANALYSIS- DXY, BTC, NAS100, SPX500, XAUUSD & XAGUSDDXY CAUTION BEARISH: Weekly closing with a strong Bullish hammer candle suggests resistance block as shown could be broken for further upside. However due a hidden bearish divergence on RSI supported by the 21 EMA crossover resistance zone gives Bears an equal opportunity for reversal. I am personally watching a 5 wave pattern to bring the dollar index to a target around 96.961 This will ultimately close the gaps that occurred on October 5th to October 7th which also corresponds to the daily chart double tops target.
BITCOIN: STILL BEARISH, BTC has consolidated for the last 4 weeks now in a channel consolidation suggesting a bearish continuation rather than an accumulation for reversal. On the daily chart price has now exited the Bearish Flag pattern and I think based on the daily double tops rejection of the fib 0.382 retrace level within the bear flag formation, this week price action could gains momentum for the downtrend to test the liquidity zone of $80,524 and put the next target around $74k zone.
NAS100 & SPX500 WIDE RANGE TRADE: Both indices closed last week with a strong Bullish candles. Whiles our lower targets from last week wasn't achieved we got close enough. The setup this week spells caution as the gaps from last week's trade could now be filled as price is poised to test the all time high resistances again.
GOLD & SILVER ALMOST TOPPING: Gold on the weekly chart has hit a perfect double top with divergences on indicators like RSI and MACD. However, we still closed the week with a green candle suggesting that price could move towards $4,475 before getting rejected. The divergences don't give me a comfortable long position and so I will stay on the sideline and wait for confirmations for pullback trade towards the weekly 21 EMA.
Silver is still in a last wave and also ending so there is not much reward for the risk. My up target is about $68.38 before the major pullback. There are already divergences on the both daily and weekly chart but these divergences don't make the risk reward attractive for a long trade.
I hope my publications are helpful to your own analysis and perspective. Thank you and please show your support for these analysis with a boost or comment so it's shown to other traders and gets featured on Trading View editors desk. Have a great and profitable trading week and remember risk management is your first job as a trader. Cheers!!

Silver is in the Bullish directionHello Traders
In This Chart XAGUSD HOURLY Forex Forecast By FOREX PLANET
today XAGUSD analysis 👆
🟢This Chart includes_ (XAGUSD market update)
🟢What is The Next Opportunity on XAGUSD Market
🟢how to Enter to the Valid Entry With Assurance Profit
This CHART is For Trader's that Want to Improve Their Technical Analysis Skills and Their Trading By Understanding How To Analyze The Market Using Multiple Timeframes and Understanding The Bigger Picture on the Charts

Will Defiance join the party?Defiance Silver is one of the few development companies that has not taken advantage of this massive move in silver.
So, either there are underlying issues hurting this stock price... OR... this thing is getting ready for a massive pop to the upside.

Chandi Hi Chandi!Chandi is trying to reach till Chand!
Today Silver Future has touched 214583 which is Life time high as of now....
Today after giving a new LTH it is showing the sign of Distribution here.
If Silver Breaks down todays low which is 209000 which is a Support in 1 Hr time Frame it can turn Bearish as also we can see Divergence of RSI is Daily Time Frame.
Once Silver Turns Bearish we can see the level of 180000 in next few weeks.
level of 180000 will be very crucial as if it breaks this level also next stop will be 140000
and if it takes Support from 180000 and shows Bullish Sign here one can invest small qty here well 140000 will be a very good level to invest in Silver.
Lets see!

SILVER: Still Bullish! Buy The Dip!In this Weekly Market Forecast, we will analyze the XAGUSD (SILVER) for the week of Dec. 15 - 19th.
Silver .... still strong! With a weakened USD due to an interest rate cut by the Fed, there are no headwinds to offer resistance.
Be mindful that this market is overextended, and a pullback is pending.
There is a +FVG to draw price to it below. That would make a great area to look for dip buying opportunities.
Enjoy!
May profits be upon you.
Leave any questions or comments in the comment section.
I appreciate any feedback from my viewers!
Like and/or subscribe if you want more accurate analysis.
Thank you so much!
Disclaimer:
I do not provide personal investment advice and I am not a qualified licensed investment advisor.
All information found here, including any ideas, opinions, views, predictions, forecasts, commentaries, suggestions, expressed or implied herein, are for informational, entertainment or educational purposes only and should not be construed as personal investment advice. While the information provided is believed to be accurate, it may include errors or inaccuracies.
I will not and cannot be held liable for any actions you take as a result of anything you read here.
Conduct your own due diligence, or consult a licensed financial advisor or broker before making any and all investment decisions. Any investments, trades, speculations, or decisions made on the basis of any information found on this channel, expressed or implied herein, are committed at your own risk, financial or otherwise.

Silver Breakout Confirmed or False Move Ahead?💎 PROFESSIONAL SILVER BLUEPRINT: XAG/USD BREAKOUT STRATEGY 💎
Day & Swing Trade Opportunity | Metals Market Analysis
🎯 TRADE SETUP SUMMARY
Asset: XAG/USD (Silver vs US Dollar)
Bias: Bullish Breakout
Timeframe: 4H & Daily Charts
Strategy Type: Momentum Breakout with Risk Management
📊 ENTRY & EXECUTION PLAN
⚡ ENTRY CONDITIONS (MUST HAVE ALL):
Price Breakout above 66.900 with 4H candle close
Volume Confirmation – Higher than average volume on breakout
Momentum Alignment – RSI above 50 (but not overbought >70 on entry)
🎯 PRIMARY TARGET: 69.000
Why this level? Previous major resistance turned support
Multiple confluence:
Fibonacci 61.8% extension from recent swing
Psychological round number
Overbought zone on weekly chart
🛡️ RISK MANAGEMENT PROTOCOL
Stop Loss: 65.500 (1.4% risk from entry)
Alternative SL options for different risk profiles:
Aggressive: 66.200 (1.05% risk)
Moderate: 65.500 (2.1% risk)
Conservative: 64.900 (3.0% risk)
🔍 MARKET CONTEXT & RATIONALE
📈 TECHNICAL CONFLUENCE:
Pattern Recognition: Ascending triangle breakout on 4H
Moving Averages: Price above 50 & 200 EMA on daily
Momentum: MACD histogram turning positive on daily
Volume Profile: High volume node at 66.50 supports bullish bias
🎭 MARKET PSYCHOLOGY:
"Police Barricade" at 69.000: Institutional resistance zone where profit-taking intensifies
Overbought Trap Risk: RSI likely to hit 75+ at target – smart money exits early
Retail Sentiment: Currently neutral – room for bullish momentum
🌐 CORRELATION MATRIX – RELATED ASSETS
1️⃣ PRIMARY CORRELATION: XAU/USD (Gold)
Correlation Coefficient: +0.85 (Strong Positive)
Key Insight: Silver often amplifies gold moves (2-3x volatility)
Watch For: Gold breaking $2,350 = Accelerated silver rally
Divergence Alert: If gold rises but silver lags → Caution needed
2️⃣ USD INFLUENCE: DXY (US Dollar Index)
Relationship: Inverse (-0.70 correlation)
Critical Levels: DXY below 104.50 = Bullish for silver
Data to Monitor: Fed statements, CPI data, employment reports
3️⃣ CURRENCY PAIRS WITH HIGH CORRELATION:
EUR/USD (+0.65) – Euro strength often mirrors silver strength
AUD/USD (+0.60) – Australia = major silver producer
USD/JPY (-0.55) – Risk sentiment indicator
4️⃣ COMMODITY & EQUITY CORRELATIONS:
Copper (+0.75) – Industrial demand proxy
S&P 500 (+0.50) – Risk-on environment supportive
US Treasury Yields (-0.60) – Real yields critical for non-yielding metals
⚖️ FUNDAMENTAL BACKDROP
🦅 MACRO DRIVERS SUPPORTING SILVER:
Monetary Policy: Dovish Fed pivot expectations
Industrial Demand: Green energy transition (solar panels, EVs)
Geopolitical: Safe-haven flows during uncertainty
Inflation Hedge: Persistent inflation concerns
⚠️ RISK FACTORS MONITORING:
USD Strength Surprise
Rate Hike Resurgence
Economic Slowdown impacting industrial demand
ETF Outflows (SLV holdings)
📋 TRADE MANAGEMENT PROTOCOL
A-SCALE EXECUTION (RECOMMENDED):
Position Size: 1-2% account risk per trade
Scale-In: 50% at breakout, 50% on retest of 66.900 as support
Scale-Out: 50% at 68.200, 50% at 69.000
Trailing Stop: Move to breakeven at 67.800
B-SCALE ADJUSTMENTS FOR MARKET CONDITIONS:
High Volatility: Reduce position size by 30%
Low Volume Breakout: Wait for confirmation candle
News Event Day: Consider entering after news settles
📊 CONFLUENCE CHECKLIST – BEFORE ENTERING
✅ Price > 66.900 (4H close)
✅ Volume > 20-day average
✅ DXY < 104.80
✅ XAU/USD trending upward
✅ No major economic news in next 4 hours
✅ Risk defined (max 2% of account)
"Are you trading silver this week? Bullish or bearish?"
"What's your silver target for Q2?"
"Which correlation do you find most reliable: gold or DXY?"
✨ LIKE if this adds value! FOLLOW for systematic trade blueprints! ✨
💬 COMMENT your silver outlook or trade adjustments below!
🔄 SHARE to help fellow traders navigate volatile markets!


Silver Potential Bullish ContinuationAfter a considerable retracement, Silver price still seems to exhibit signs of overall potential Bullish momentum as the price action may form a credible Higher Low with multiple confluences through key Fibonacci Levels, Higher timeframe Harmonic Projections and Support levels which presents us with a potential long opportunity.
Trade Plan:
Timeframe : 1D
Entry : 61.204
Stop Loss : 55.64
TP 1 : 66.768
TP 2 : 72.315

What has caused silver to grow faster than gold?Considering the fluctuations of silver and the price movement model and the silver chart, it is reporting a price movement towards a price target in the range of $87 per ounce!
What seems to be the main question is why the price of silver is moving faster than gold and why does silver need to fill its price growth gap with gold at this time??!!
The link below is the path to past silver analysis:

Silver Analysis
Silver is close to an important resistance, it reacted a few times and could not breakthrough but did not make lower lows too, so still market is bullish.
Stay alert on resistance line (red line) and with confirmation you can join buyers.
Stay tuned for our next updates.

XAG Analysis
Here is my view for today on XAG.
As per the previous analysis the purple line is important resistance as you see we have had a few reactions on 4h timeframe. need to see how its gonna pass this resistance area and with confirmation decide whether to enter or wait.
Check the yesterday's analysis and How much did yo guys made with our last analysis? ;)
Stay tuned for our next updates.

Silver is in the Bullish directionHello Traders
In This Chart XAGUSD HOURLY Forex Forecast By FOREX PLANET
today XAGUSD analysis 👆
🟢This Chart includes_ (XAGUSD market update)
🟢What is The Next Opportunity on XAGUSD Market
🟢how to Enter to the Valid Entry With Assurance Profit
This CHART is For Trader's that Want to Improve Their Technical Analysis Skills and Their Trading By Understanding How To Analyze The Market Using Multiple Timeframes and Understanding The Bigger Picture on the Charts

Silver Bullish Continuation Expected After PullbacksH4 - Strong bullish move
No opposite signs
Until the two support zones hold I expect bullish continuation
👉 If you enjoy this analysis, please Like, Follow, and Support the profile! Your engagement motivates us to share more quality setups.
