Silver Price Ready for Lift-Off: Bullish Channel Silver (XAG/USD) is consolidating within a rising channel, with strong Ichimoku cloud support hinting at a potential bullish breakout. After a brief pullback to the lower channel boundary, price action shows signs of rebound momentum targeting the $54 resistance zone. A confirmed break above $53 could trigger an upward move equal to the channel height, continuing the bullish trend. Traders are watching for a breakout confirmation above the midline for a potential long setup.
🧭 Chart Overview
Timeframe: 30-minute chart
Indicator: Ichimoku Cloud (9, 26, 52, 26)
Price: $52.67 (as of the chart time)
Trend Channel: Rising (ascending parallel channel)
---
📊 Price Action Analysis
1. Trend Structure:
The chart shows Silver trading inside a well-defined ascending channel, respecting both upper and lower boundaries.
Price recently bounced off the lower channel support, which often acts as a bullish signal within an ongoing trend.
2. Ichimoku Cloud (Kumo):
The price is hovering around the top of the Ichimoku cloud, suggesting neutral-to-bullish sentiment.
The cloud’s future span (Senkou Span A > Span B) points slightly upward — a sign of potential continuation of the uptrend.
Support lies near the $52.50–$52.60 zone, which aligns with both the lower channel line and the top of the cloud — a strong confluence area.
3. Momentum Observation:
The recent correction looks more like a healthy retracement than a reversal.
Buyers are likely waiting for confirmation before pushing higher.
4. Breakout Levels:
Immediate Resistance: $53.40 (mid-channel + previous top).
Major Resistance: $54.00 (upper channel target).
Support Zone: $52.50–$52.00 (Ichimoku + trendline confluence).
---
🚀 Bullish Scenario
If price closes above $53.40, it would confirm a breakout of the short-term consolidation pattern.
The projected move (based on the channel height) suggests a target near $54.50–$54.60.
Silveranalysis

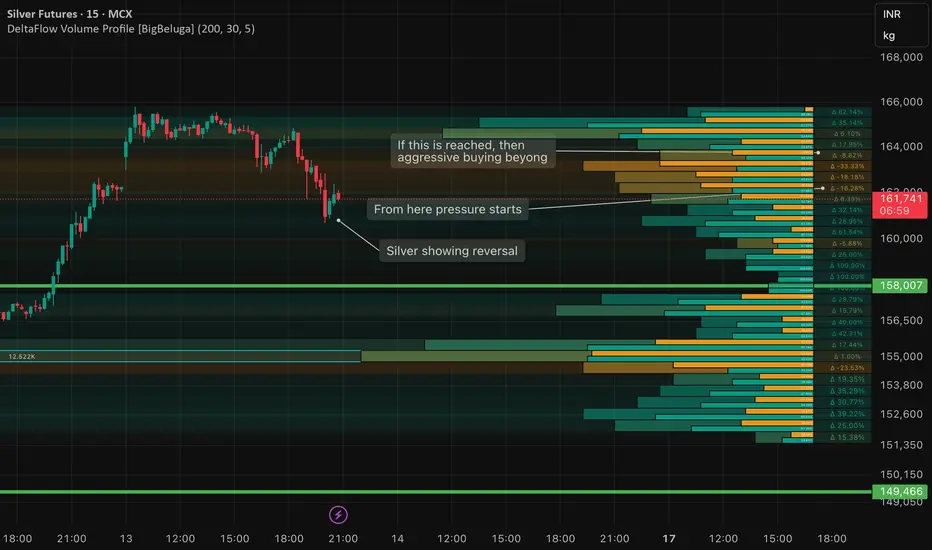
SILVER showing reversal from lower levels as US Govt reopensSilver crashes and wipes away entire day's gain by falling around 3000 points on MCX and is now showing a reversal on 15 min chart as investors turned to precious metals as a hedge against rising global uncertainties. Hopes of upcoming Federal Reserve rate cuts—driven by signs of a softening US job market—also boosted sentiment. Supply-side worries added further support, with India’s wedding season increasing demand and concerns emerging over possible US tariffs on silver. Additionally, the US Department of the Interior recently classified silver, copper, and metallurgical coal as “critical minerals,” underscoring their strategic economic importance. This new status could pave the way for Section 232 investigations and potential trade restrictions, similar to the actions taken on copper earlier this year.
Silver (SLV): Multi-Year Cup & Handle SetupSilver appears to be repeating the same large-scale institutional “Cup and Handle” structure that played out almost perfectly on Gold.
The difference is that in SLV (iShares Silver Trust), the chart history is shorter, so the full formation is not as clearly visible — but if we reference the historical silver chart (since 1802), the pattern becomes unmistakable.
That long-term chart shows a massive multi-decade rounded base — the cup — and now price has already touched the upper boundary, effectively activating the pattern.
🧠 Technical Context
On the long-term silver chart, the handle represents the multi-year consolidation we’ve seen since the 2011 peak.
In SLV, this structure is compressed, but the correlation with physical silver remains ~99%, since the fund is backed by over 90% physical silver holdings.
This makes SLV an ideal instrument for expressing long-term silver exposure — it tracks spot silver almost tick-for-tick, while providing the liquidity and accessibility of an ETF.
Technically, silver has already tested the upper rim of the cup, confirming that the pattern is active.
This breakout will likely be followed by a short-term consolidation (the final part of the handle) before the market enters what could become a multi-year rally phase.
Based on historical fractals and volume structure, the first major pullback is expected toward the $35–25 zone, which corresponds to the previous 4th-wave cluster — a classic accumulation area in Elliott terms.
I’ll be looking to accumulate aggressively in the $35–30 range, scaling in gradually as price approaches those levels.
🎯 Trade Plan
Instrument: SLV (iShares Silver Trust ETF)
Correlation to Spot Silver: ~99%
Primary Support Zone (Accumulation): $25 – $35
Handle Breakout Level: around $50
Long-Term Target: $800+ (silver spot equivalent)
Stop-Loss: per individual risk management
Time Horizon: 5+ years
Once silver completes its consolidation and breaks above $50, the measured move of the Cup and Handle suggests a multi-hundred percent rally that could unfold over the next decade.
The breakout will likely be accompanied by rising institutional volume and strong follow-through momentum.
🧭 Strategic View
I trade silver exclusively through SLV, as it offers the most direct and reliable exposure to the underlying metal.
The fund’s near-perfect correlation with spot silver makes it ideal for implementing long-term accumulation strategies without the operational complexities of futures or CFDs.
This will be one of my core positions for the coming decade.
After the expected correction into the $30–35 range, I plan to build a large position, possibly hedged later on, and hold through the full bullish cycle.
Silver’s technical structure, macro fundamentals, and historical analogs all point toward a potential generational rally once this base completes.
This is the setup I’m positioning for — patiently, systematically, and with conviction.
Summary
Long-term “Cup and Handle” formation now confirmed
Final correction expected before the next secular rally
SLV offers near-1:1 tracking with physical silver
Accumulation zone: $35–25
Target: $800+ over the next decade

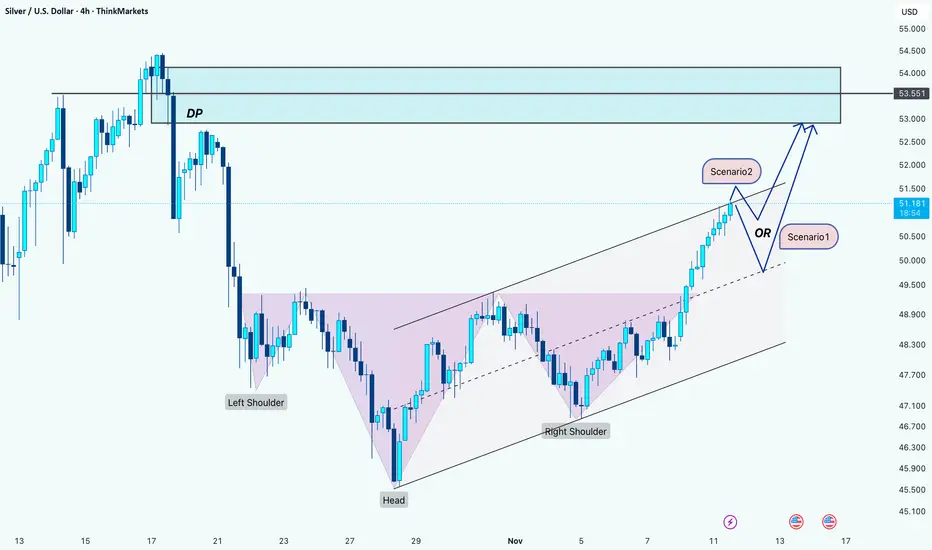
Silver: Approaching Major DP Zone With Two Possible Paths to 53Hi Team!
Silver has completed a clean inverse Head & Shoulders pattern and is climbing steadily within a rising channel. Bullish momentum remains intact as price moves toward the DP (Decision Point) zone, which aligns with a key supply area from the previous breakdown.
As price approaches this zone, two scenarios remain most likely:
Scenario 1:
A rejection from the upper boundary of the channel, leading to a corrective pullback toward the mid-channel or lower trendline, before resuming higher toward the $52.9 target.
Scenario 2:
A shallow pullback or brief consolidation just below the DP zone, followed by bullish continuation that drives price directly into the $52.9 target and possibly beyond.
Regardless of which path plays out, both scenarios point toward the same upside objective at $52.9, as long as the rising channel structure remains intact.
Disclaimer: As part of ThinkMarkets’ Influencer Program, I am sponsored to share and publish their charts in my analysis.
Silver (XAGUSD) 4H – Potential Ending Diagonal in C of (B)Price action in the 4H chart for Silver suggests we’re nearing the completion of a possible zigzag, with wave C possibly building out a clear ending diagonal (wedge) in the final leg of (B). This aligns with classic Elliott Wave behaviour, where a wedge pattern often signals the conclusion of a strong corrective rally before a significant reversal or new trend begins.
The current rally is testing both the upper parallel and key Fibonacci zones (0.618/0.764).
Watch for breakdown triggers below wedge support, which would confirm the reversal and set up a new bearish sequence.
If price keeps grinding higher within the wedge, further subdivisions may occur before wave C/B finally tops.
What’s your view on this structure? Do you expect a deeper reversal or more upside first? Share your ideas below!

#XAGUSD(SILVER):Is Bull Run Over? Major Correction On the Way? Dear Traders,
Silver has experienced a significant decline since the DXY began to recover. The price is likely to continue falling and we believe this may be the commencement of a major decline. We anticipate a smooth drop based on previous price reactions.
**Potential Entry Zone:**
- Enter when the price reaches the FVG area marked with a white box. The initial take profit can be set at $45 and the swing trade at $40.
**Support:**
- We would appreciate your support by liking and commenting on our ideas which will encourage us to post more in the future.
Team Setupsfx

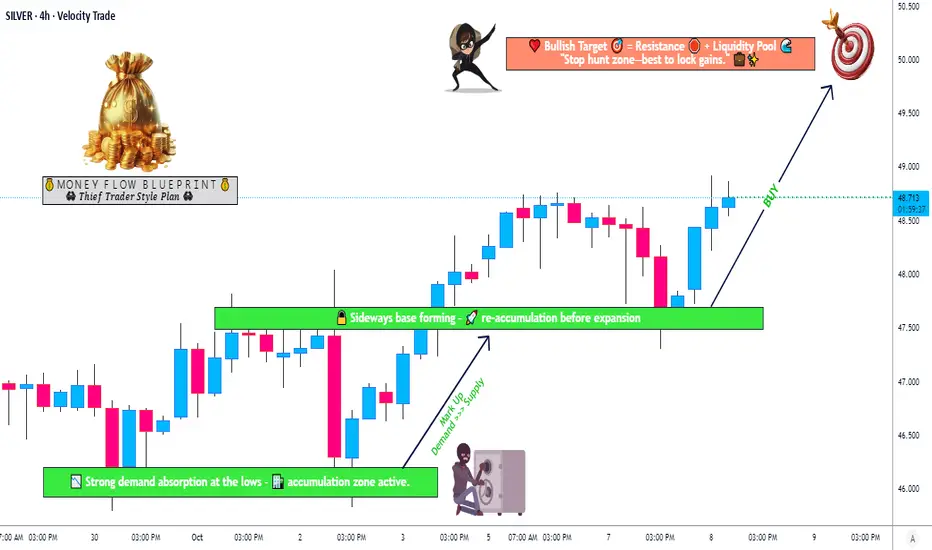
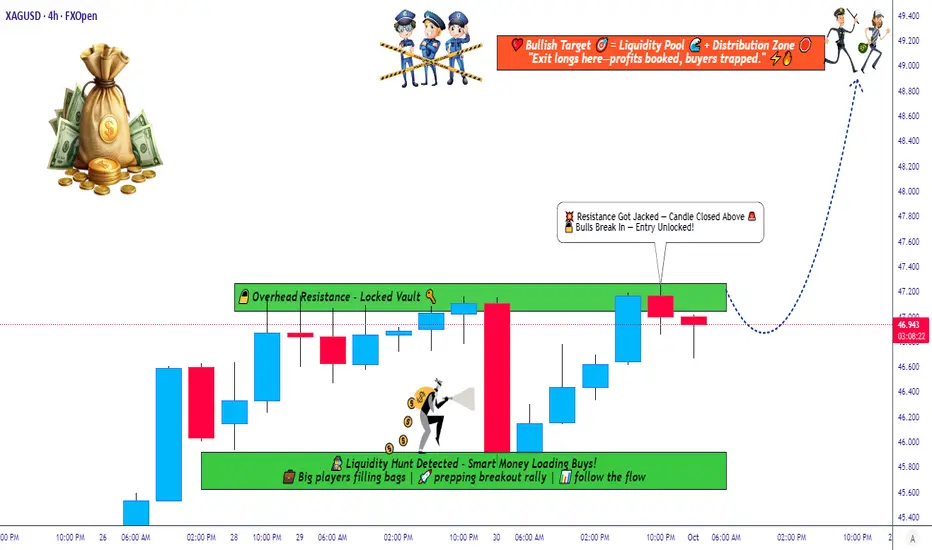
Silver Price Action Update – Smart Money Reaccumulation PhaseXAG/USD "SILVER vs U.S. DOLLAR" — Metal Market Cash Flow Management Strategy 💰
Thief Strategy | Layered Entry | Swing / Day Trade Plan
🧭 Plan Overview
The Bullish momentum in Silver (XAG/USD) has been confirmed through accumulation and re-accumulation phases, signaling a potential continuation move upward.
Smart money appears to be building positions below major resistance — time for us to follow the metal flow. ⚙️
💎 Entry Plan — Thief Layer Style
Thief Strategy = Layered Limit Entries 🧠
We use multiple limit orders to build a smarter position gradually — instead of chasing the price.
Entry Layers:
47.500
48.000
48.500
(You can add more layers based on your own plan and risk appetite.)
🛑 Stop Loss (SL)
This is the Thief SL @47.000.
However, dear Ladies & Gentlemen (Thief OGs) — please manage your own risk.
It’s your money, your strategy, and your exit. 💼
“Make money → Take money → Protect money.”
🎯 Target Zone
A strong resistance zone + overbought conditions may create a trap at the highs.
So, when Silver reaches around $50.000, be smart and secure your profits before the metal traps the late buyers.
Remember: we steal profits, not dreams. 🕶️
💬 Note from the Thief OG
This is a Thief-style strategy — meant for educational fun and insight sharing.
Not a signal service or financial advice.
Use your own judgment and always plan your risk ahead of your entries.
Let’s manage our cash flow, not our emotions. ⚖️
🌍 Related Pairs to Watch (Correlation Check)
OANDA:XAUUSD (Gold) → Often moves in sync with Silver; watch for Gold strength confirmation.
💵 TVC:DXY (U.S. Dollar Index) → Inverse correlation; a weaker USD supports Silver upside.
💰 OANDA:AUDUSD & OANDA:NZDUSD → Commodity-linked currencies; bullish moves support Silver’s strength.
OANDA:XCUUSD → Industrial metals correlation; when Copper rallies, Silver often follows.
Keep your eyes on these pairs — they reveal how liquidity shifts across the metals and forex markets.
✨ “If you find value in my analysis, a 👍 and 🚀 boost is much appreciated — it helps me share more setups with the community!”
⚠️ Disclaimer:
This is a Thief-style trading strategy — shared just for fun and educational purposes.
Always do your own research and trade responsibly. 🧩
#XAGUSD #SilverAnalysis #MetalsMarket #SwingTrade #DayTrading #TechnicalAnalysis #ThiefStrategy #LayeredEntry #CommodityTrading #SmartMoney #BullishSetup #TradingViewCommunity #MarketFlow #TradeResponsibly
Silver - Short Term Buy IdeaH1 - Strong bullish momentum.
No opposite signs.
Until the two Fibonacci support zones hold I expect the price to move higher further.
If you enjoy this idea, don’t forget to LIKE 👍, FOLLOW ✅, SHARE 🙌, and COMMENT ✍! Drop your thoughts and charts below to keep the discussion going. Your support helps keep this content free and reach more people! 🚀
-------------------------------------------------------------------------------------------------------------------

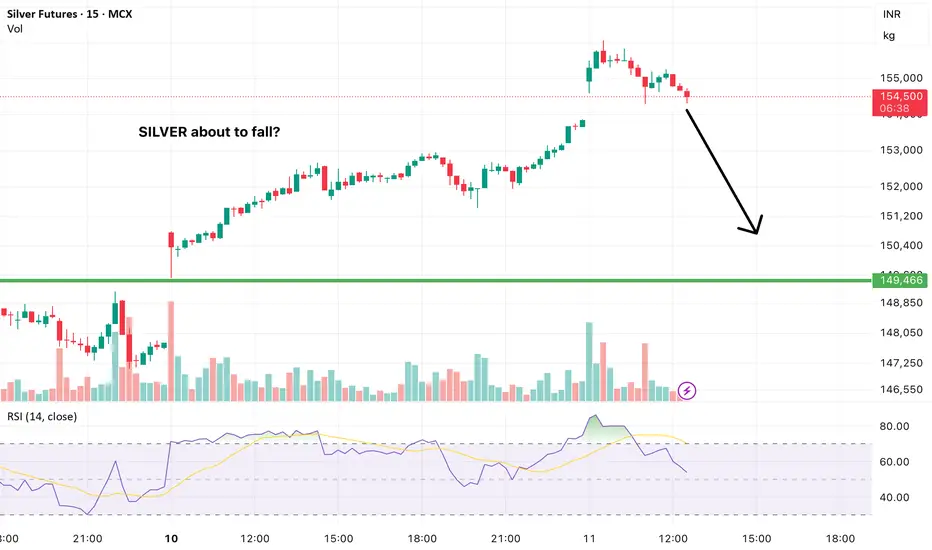
SILVER forming dangerous chart pattern today. Can fall from hereSilver forming negative or weka pattern on 15 minute charts which is indicating pressure from higher levels.
Can fall from here as per this chart pattern
Share this with your friends who trade in Commodities.
This is not an investment advice.
Silver is in the Bullish directionHello Traders
In This Chart XAGUSD HOURLY Forex Forecast By FOREX PLANET
today XAGUSD analysis 👆
🟢This Chart includes_ (XAGUSD market update)
🟢What is The Next Opportunity on XAGUSD Market
🟢how to Enter to the Valid Entry With Assurance Profit
This CHART is For Trader's that Want to Improve Their Technical Analysis Skills and Their Trading By Understanding How To Analyze The Market Using Multiple Timeframes and Understanding The Bigger Picture on the Charts
Silver - The catastrophic rejection!🆘Silver ( TVC:SILVER ) is just collapsing:
🔎Analysis summary:
At this exact moment, Silver is retesting the previous all time highs, which were already rejected about 45 years ago. Considering the extremely bearish rejection on the smaller timeframes, Silver simply fails to break out. This will lead to a devastating reversal.
📝Levels to watch:
$50
SwingTraderPhil
SwingTrading.Simplified. | Investing.Simplified. | #LONGTERMVISION

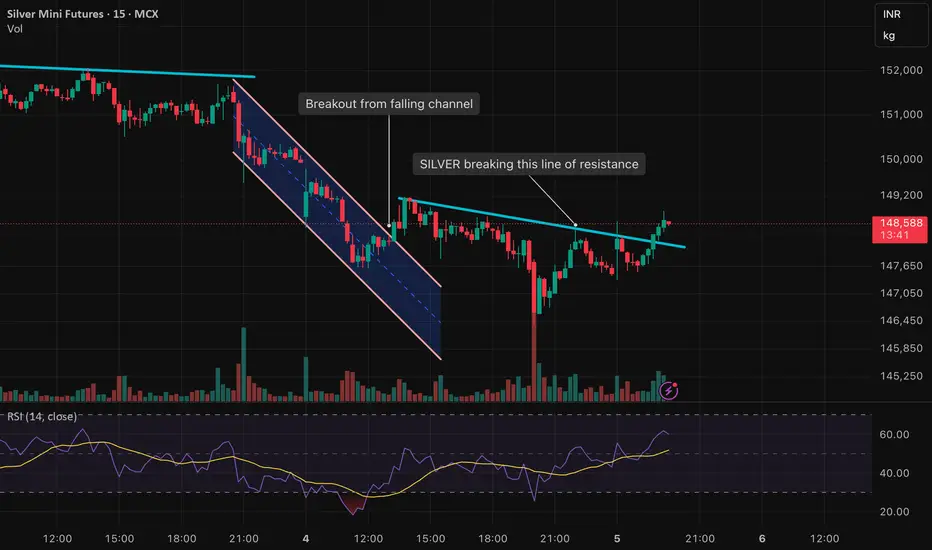
SILVER breaks above Line of ResistanceSILVER price breaks the marked line of resistance. Earlier the chart was respecting this line however this time it broke after US Employment data which is supportive for gold and silvre prices
SILVER forming a wedge pattern ready for either side brakoutPrice action on Silver is getting tighter and is now trading inside a wedge formation, which usually leads to a strong move once price breaks out — either up or down. No bias yet, just preparing for momentum on whichever side gives confirmation.
📌 What I’m watching:
• Trendline breakout with volume
• Retest + continuation for safer entries
• Volatility spike around key levels
• RSI & momentum alignment before execution
⚠️ Not a buy/sell call. This is just market observation for educational purposes.
Trade your own plan, manage risk, and respect position sizing.
If you like clean chart breakdowns, price-action setups and real-time market tracking — hit follow so you don’t miss the next update.
XAGUSD Bullish Continuation: Rectangle Breakout Toward 55Silver (XAGUSD) has cooled after a powerful August–October rally, slipping into a clean 1D rectangle between 46.00 and 50.00. Price sits below the MA20 but above the MA60/MA120, keeping the broader uptrend intact while momentum resets. The recent volatility burst has faded and bands have tightened, which often precedes expansion. The major supply remains the mid-October swing high near 55.00, while structurally important demand rests at 39.50 from the summer base.
Primary path: look for a daily close above 50.00 to confirm a range breakout and resume the trend toward 55.00. If it breaks, bullish exposure can be managed with invalidation on a daily close back below 47.50 (the post-break area), acknowledging MA60 backup near 44.63. Until that trigger prints, the base case is continued chop inside 46.00–50.00 with mean-reversion around the MA20.
Alternative path: a daily close below 46.00 flips the range lower and opens a corrective leg toward 44.60 (MA60) and potentially 42.00. Short setups from a 46.00 break should be invalidated on a close back above 48.00. Bigger-picture invalidation for the bullish structure sits at 39.50 — a sustained break there would negate the uptrend context.
Levels to watch: Resistance 50.00 (breakout) and 55.00; Support 46.00, 44.60, and 39.50. Triggers: 1D close >50.00 (bullish) or <46.00 (bearish). Targets: 55.00 on upside; 44.60/42.00 on downside. This is a study, not financial advice. Manage risk and invalidations.

Silver forming a long-term “Cup and Handle” - as Gold didSilver seems to be repeating the same institutional “Cup and Handle” structure that we recently saw play out perfectly on Gold.
On Gold, the price completed the entire measured move — equal to the depth of the cup — before entering consolidation.
Now, Silver is building a very similar long-term formation, and this setup could define the market direction for the next several years.
🧠 Technical Context
On the higher timeframes (1W and 1M), Silver has formed a clear rounded base — the cup.
The current consolidation area represents the handle, and price is now approaching the upper boundary of that handle.
Once we see a decisive breakout above the handle resistance, institutions will likely defend that zone on the first retest.
This pattern is one of the most reliable continuation formations in long-term trends, especially when accompanied by rising volume near the breakout area.
There’s a very important condition: this pattern becomes active only after the handle breakout.
Before the breakout, it’s just an unconfirmed structure — the pattern is validated only once the handle level is broken.
🎯 Trade Plan
Breakout Level (Handle Resistance): around $50.0 – $51
Usually, the breakout happens on high volume, accompanied by several strong bullish candles
Retest Zone: $30 – $35.0
Target (long-term extension): $600.0+
Stop-Loss: according to your risk management strategy
📊 Summary
If Silver repeats the Gold scenario, we might see a clean breakout–retest–continuation structure with very limited pullbacks once the move begins.
This could mark the start of a multi-year bullish phase in silver.
I’ll be monitoring the breakout confirmation and volume profile closely before entering.
Once confirmed, the upside potential looks substantial compared to the risk.
This is not financial advice. For educational purposes only

Silver H1 | Heading Into 61.8% Fibonacci ResistanceBased on the H1 chart analysis, we could see the price rise to the sell entry, which has an overlap resistance that aligns with the 61.8% Fibonacci retracement and could reverse from this levle to the upside.
Sell entry is at 48.35, which is an overlap resistance that aligns with the 61.8% Fibonacci retracement
Stop loss is at 49.26, whic is a multi swing high resistance.
Take profit is at 46.98, which is an overlap support.
Stratos Markets Limited (tradu.com ):
CFDs are complex instruments and come with a high risk of losing money rapidly due to leverage. 68% of retail investor accounts lose money when trading CFDs with this provider. You should consider whether you understand how CFDs work and whether you can afford to take the high risk of losing your money.
Stratos Europe Ltd (tradu.com ):
CFDs are complex instruments and come with a high risk of losing money rapidly due to leverage. 70% of retail investor accounts lose money when trading CFDs with this provider. You should consider whether you understand how CFDs work and whether you can afford to take the high risk of losing your money.

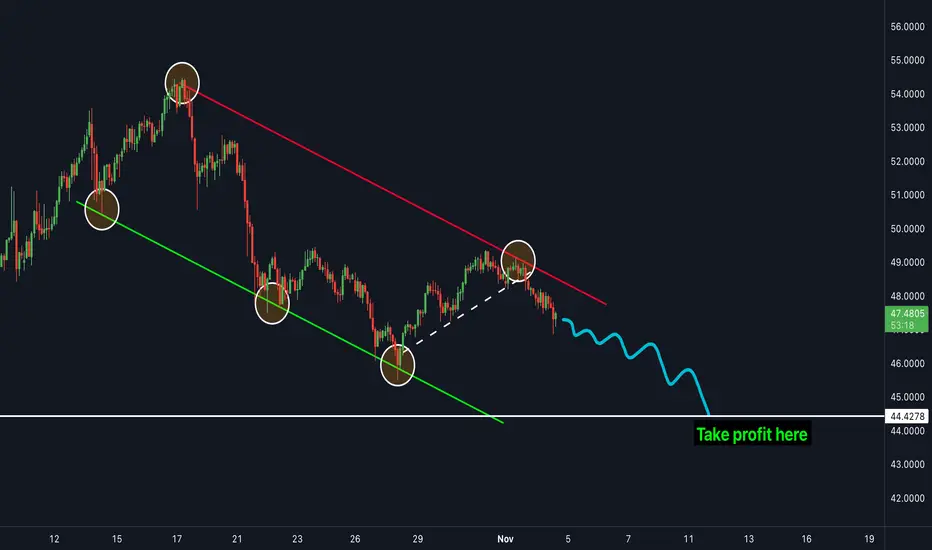
SILVER is ready to drop more - SELL NOW!Silver has been in a clear downtrend for the last few weeks and has struggled to move to the upside. The price is currently in between a bearish channel and is bouncing in-between both resistance and support zones. The price broke the most recent trendline (shown in white) which acted as a support zone. The next target is the white line shown on the chart as "take profit". This is the next major support zone which the price is very likely to hit next.
XAG/USD Analysis: Price Stabilises Below the Psychological LevelXAG/USD Analysis: Price Stabilises Below the Psychological Level
October proved exceptionally volatile for the silver market — the price broke past a historical record, climbing above $50. However, after widespread profit-taking, the market reversed downward.
XAG/USD is currently influenced by several factors:
→ prospects for Federal Reserve policy;
→ the easing of trade tensions between the United States and China;
→ the potential government shutdown and related news.
As indicated by the ATR indicator, volatility is declining — suggesting that supply and demand forces may be finding a balance.
Technical Analysis of the XAG/USD Chart
The broad upward channel remains intact, though it is worth noting that its median line has shifted from acting as support to serving as resistance.
From a bullish perspective:
→ the lower boundary of the channel acts as strong support;
→ the bullish A-B-C-D structure indicates that demand is recovering.
From a bearish perspective: if the silver price continues to rise, it will face resistance at:
→ the psychological $50 mark;
→ the 21 October drop zone, where selling pressure previously dominated.
Given the above, it is reasonable to assume that:
→ in the near term, the price may consolidate around the QL line;
→ if bearish momentum resumes, the alternative downward channel (shown in red) will gain relevance.
This article represents the opinion of the Companies operating under the FXOpen brand only. It is not to be construed as an offer, solicitation, or recommendation with respect to products and services provided by the Companies operating under the FXOpen brand, nor is it to be considered financial advice.

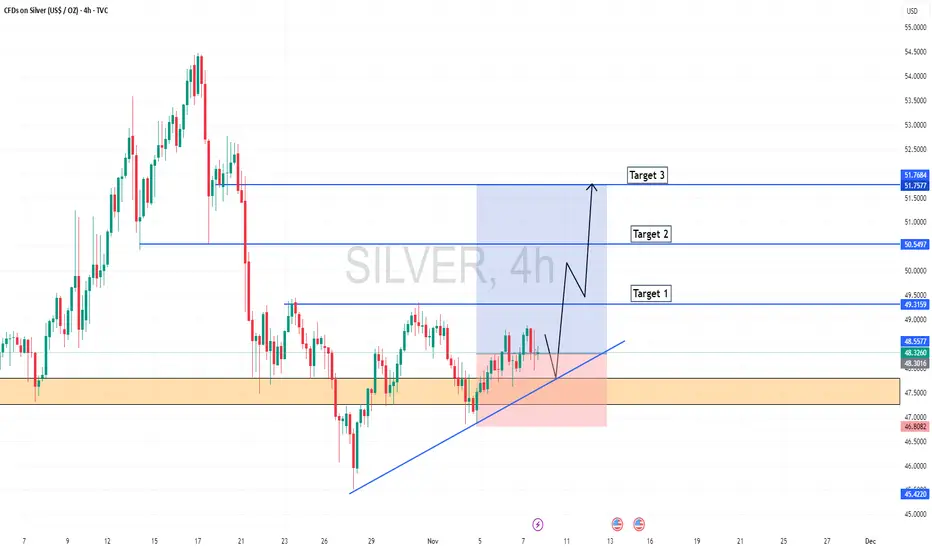
Silver Strategy Map — Thief Layers, Smart Targets, and Risk Zone📊 XAG/USD “Silver vs U.S Dollar” — Metals Market Wealth Strategy Map (Swing/Day Trade)
🔑 Plan: Bullish Setup
This setup follows the “Thief Strategy”, which means using layered limit entries to scale into the trade. Instead of going all-in at one level, we “steal the entries” across multiple layers.
💰 Layered Buy Limit Entries (Example Setup):
46.200
46.400
46.600
46.800
47.000
👉 You can increase layers as per your own plan and risk style.
🛑 Stop Loss (Protective Exit): 45.600
(This is my thief SL — but you’re free to adjust as per your own risk appetite.)
🎯 Target Zone: 49.000
⚠️ Around 49.300, we see a “Police Barricade” (heavy resistance + overbought conditions + potential trap).
That’s where profits should be taken — escape with gains before the trap closes!
Why This Setup?
Support Zones: Strong accumulation zones forming near 45.600–46.000.
Trend Bias: Silver remains bullish in the medium-term metals market outlook.
Layering Strategy Advantage: Reduces entry risk and allows better average fill.
Profit Zone: 49.000 aligns with strong supply area + RSI extension risk.
🔗 Correlation & Related Pairs to Watch
OANDA:XAUUSD (Gold vs USD): Gold often leads Silver’s moves — watch Gold for early signals.
TVC:DXY (US Dollar Index): A weaker USD usually boosts metals.
TVC:PLATINUM & CAPITALCOM:PALLADIUM : Industrial metals correlation — strong moves here can influence Silver sentiment.
TVC:SILVER Futures: Always track COMEX Silver contracts for volume confirmation.
✨ “If you find value in my analysis, a 👍 and 🚀 boost is much appreciated — it helps me share more setups with the community!”
📌 Disclaimer: This is a Thief-style trading strategy, created just for fun and educational sharing. Not financial advice — trade at your own risk.
#XAGUSD #Silver #Metals #TradingStrategy #SwingTrade #DayTrade #ThiefStrategy #Gold #DXY #Forex #Commodities
Weekend Analysis: DXY, BTC, Gold, Silver, Nas100 and SPX500In this video presentation I am expecting the dollar index to continue its uptrend on the lower time frame towards the liquidation level target of 99.500.
Bitcoin is still in a distribution range and currently correcting the sharp sell off from $126,296. I am observing an A-B-C corrective pattern potentially to targets of either $115,044 or $117,653. These are confluence of resistance level and will be expecting a sell off from these levels. If these levels gets invalidated then potentially the all time highs of $126k is in view. However that's not my expectation so a breach of the target level will invalidate the bearish analysis on Bitcoin.
I think Gold and Silver have peaked out for now and smart money is off loading to FOMO retail traders. I am expect Silver to sell off much faster than Gold.
Nas100 and SPX500 clinched to a breakout of new highs but the buying volume is fading out and seems to be a fake out. I will be watching if the breakout levels gets support or breakdown on pullback to decide a long position or short position.
This is my opinion on the market this week and I thank you for your time to visit my publications.
Have a great trading week and don't forget risk and money management is your first job as trader or investor. Cheers!!

Silver is in the Bullish directionHello Traders
In This Chart XAGUSD HOURLY Forex Forecast By FOREX PLANET
today XAGUSD analysis 👆
🟢This Chart includes_ (XAGUSD market update)
🟢What is The Next Opportunity on XAGUSD Market
🟢how to Enter to the Valid Entry With Assurance Profit
This CHART is For Trader's that Want to Improve Their Technical Analysis Skills and Their Trading By Understanding How To Analyze The Market Using Multiple Timeframes and Understanding The Bigger Picture on the Charts

Short in silverAs you can see there is shorting opportunity in silver as well as gold so what is your view on this??????

SilverXAGUSD
- Completed " 12345 " Impulsive Waves
- Demand Zone
- Fibonacci Level - 50.00% / 61.80%
- RSI - Divergence
- Bullish Channel as an corrective pattern in Short Time Frame
