SILVER: Price is going strong! Likely To Go Over $100Dear Traders,
If current price action continues, silver is likely to surpass $100 within two weeks. Strong fundamentals are essential to support this view and we believe they’ll continue to bolster our position in the coming days. Our initial target is $100 followed by a swing target at $110, our final target.
If you like our idea, please like and comment for more!
Team Setupsfx_
Silverlong

Silver - Looking To Buy PullbacksH1 - Strong bullish move.
Currently it looks like a pullback is happening.
Until the two Fibonacci support zones hold I expect the price to move higher further.
If you enjoy this idea, don’t forget to LIKE 👍, FOLLOW ✅, SHARE 🙌, and COMMENT ✍! Drop your thoughts and charts below to keep the discussion going. Your support helps keep this content free and reach more people! 🚀
--------------------------------------------------------------------------------------------------------

#SILVER: Swing Buying Up To Yearly End Target Of $100XAGUSD(SILVER) ANALYSIS🎇
🔺After a big rally, silver took a dip, dropping about $70 from its high of $82. But don’t worry, it’s bounced back from $70 and is now trading at $80, with a chance to hit $85 by the end of January. The market is a bit wild right now, mostly because of recent political stuff.
🔺We’ve got three potential goals for this swing trade: we’re aiming for a first target at $85, then a second at $90 and a final one at $100. This plan is for a longer stay, maybe even a year. But since things have been so up and down lately, we’re betting the price will keep climbing.
🔺If you think our analysis is helpful, please give us a thumbs up and share your thoughts in the comments.
SetupsFX Team👨💻🏆

Silver: short term bullish, short term support at $82.6Par SAR: buy
EMA cross: buy
Supertrend: buy
Stoch RSI: buy
MACD: buy
Fundamentals are strong

Silver - This metal is blowing up now!💣Silver ( OANDA:XAGUSD ) is rallying even higher:
🔎Analysis summary:
Just a couple of months ago, we witnessed another bullish break and retest on Silver. It was quite obvious that Silver will rally accordingly and just recently, we experienced another +150% rally. However, looking at the higher timeframe, Silver is still not done.
📝Levels to watch:
$100
SwingTraderPhil
SwingTrading.Simplified. | Investing.Simplified. | #LONGTERMVISION

Silver Long Setup – Support Zone in Play The Silver 4H chart🪙 Silver Long Setup – Support Zone in Play
The Silver 4H chart (XAGUSD) is flashing a compelling long opportunity as price rebounds from a well-defined Support Zone. After a corrective dip, bulls are stepping in near the 74.55–73.73 region, which aligns with structural support and prior accumulation. With volume stabilizing and price reclaiming momentum, this setup offers a clean risk/reward profile for upside continuation.
🟢 Trade Setup Details
- Buy Zone: 74.5592 to 73.7359
- Max. Stop Loss: 73.7359 (conservative SL at 73.8163 also valid)
- Take Profit Targets:
- 🎯 TP1: 79.4363
- 🎯 TP2: 80.5171
- 🎯 TP3: 81.3697
The current price action around 77.98 suggests bullish intent, with a breakout above the descending trendline adding fuel to the move.
🔍 Technical Highlights
- Price has respected the Support Zone, forming a base for potential reversal.
- A descending trendline has been breached, signaling a shift in short-term sentiment.
- Volume shows accumulation behavior, supporting the bullish thesis.
- The profit zone offers a risk/reward ratio near 2:1, ideal for swing entries.
📈 Bullish Scenario
If Silver holds above the support base, we could see a steady climb toward TP1 and TP2, with TP3 as an extended target. Watch for:
- Bullish candles with strong body and volume confirmation
- Retest of broken trendline as support
- Momentum indicators crossing into bullish territory
⚠️ Risk Management
- SL placement below 73.73 protects against deeper pullbacks.
- Consider partial exits at TP1 and TP2 to secure gains.
- Avoid chasing if price runs too far—wait for pullbacks or consolidation near breakout zones.
💡 Summary: Silver is bouncing off a key Support Zone, with bullish structure forming and upside targets clearly mapped. With TP1–TP3 offering layered exits and a tight SL, this setup blends precision with potential.
📊 Whether you're trading the breakout or riding the wave toward 81+, this setup deserves your attention.

XAGUSD (Past) - Too Quicksilver! :(~+ Fed is to change the chairman soon, the new one is expected to be dovish
+ Soft US Data (ISM, Retail Miss; Unemployment Beat)

SilverSilver prices found support around $75, and if they rebound from there, they could potentially reach new highs.
However, they will also encounter resistance around $78 and $81.
If the support level is broken, prices will fall back to between $72 and $69.

Silver Analysis
4h analysis shows the reaction on resistance area and price could hold itself above it. which is %70 of the bearish move. So bullish signal (blue box)
Daily candle closed above all other days. another bullish signal. (yellow line)
According to ichimoku and fibo this area is important so signal of bullish.
we are close to the top of first channel, will publish update later.
Stay tuned for our next updates.

Gold surges 2.75% on Venezuela, weak dollar! Eyes on new recordsGold has surged 2.75% on Monday and continues higher on Tuesday, now trading around $4,465 and eyeing a retest of record highs at $4,550. This rally is fuelled by Venezuelan tensions, a weaker US dollar, and soft manufacturing data—but is this a breakout or a trap before NFP?
We analyse why the weaker dollar—not pure safe-haven demand—is the dominant driver, as both gold and stocks are rallying together. We then map out the critical Fibonacci levels that will determine whether gold breaks to new highs or corrects back toward $4,400.
Key drivers
- Venezuela tensions & dovish Fed : Gold got a safe-haven bid following Trump's aggressive stance on Venezuela, but the real driver is dollar weakness after Fed Governor Kashkari's dovish comments about slow disinflation and rising unemployment risks.
- Weak Manufacturing PMI : US ISM PMI dropped to 47.9 from 48.4 expected, reinforcing the soft-landing narrative and pushing the dollar lower.
- Dead Cat Bounce invalidated : Price has broken above both the 50% and 61.8% Fibonacci retracements ($4,447), invalidating the bearish "dead cat bounce" scenario that suggested another leg down.
- Upside targets : The immediate hurdle is the 78.6% Fib at $4,490. A break here strongly suggests new record highs toward $4,550 before the NFP report on January 9. Above that, $4,600 and $4,750 are psychological targets.
- Downside risks : Key support is the weekly open at $4,430 (or gap fill at $4,455). A breakdown below the 50% Fib at $4,412 would shift sentiment bearish and open the door to deeper corrections.
- NFP wildcard : Markets are cautious heading into Thursday's jobs report. A weak NFP could fuel another leg higher, while a strong print may trigger profit-taking.
Are you buying the breakout toward $4,550 or waiting for a pullback? Share your gold strategy in the comments and follow for NFP coverage later this week.
This content is not directed to residents of the EU or UK. Any opinions, news, research, analyses, prices or other information contained on this website is provided as general market commentary and does not constitute investment advice. ThinkMarkets will not accept liability for any loss or damage including, without limitation, to any loss of profit which may arise directly or indirectly from use of or reliance on such information.

Silver Analysis
Daily candle closed above tha last 3 days, bulish signal. (purple line)
4h analysis shows the reaction on resistance area (blue) that sellers were not strong enough to bring the price to lower low, additionally this area is valid if we use Ichimoko indicator too, so if candle close above this area we can join buyers.
Stay tuned for our next updates.

Paper Silver back in the channel Physical silver to the mooon!!! If you can't hold it you dont own it!

SILVER - Wait for dips. Amazing run ahead. Are you ready?SILVER
After an amazing rally in 2025; SIlver is cooling off from the Fibo extension targets of $78.44 and $72.725. Looking for dips till $60 for fresh entry.
Targets: Looking for a further extension of $110/$124 in 2026.

Silver Analysis (XAG/USD)CAPITALCOM:SILVER
Chart Structure
From December 6 to 26, the price followed a strong uptrend.
On December 27, silver peaked near $84 and then corrected sharply.
A strong support zone around $70 formed after the drop.
The current price is $74.53, and a recovery appears to be forming with bullish candles.
Key Support & Resistance Levels:
Level | Price
Resistance 1 | ~$76.5
Resistance 2 | ~$80
Support 1 | ~$72
Support 2 | ~$70 (major)
Patterns & Price Behavior:
Higher Lows are forming → indicating bullish structure.
A V-shape recovery pattern is visible → suggesting a strong rebound.
Buyers are stepping in aggressively after the pullback.
Fundamental Analysis
Factor | Status | Impact on Price
Global Inflation | Still elevated | Bullish for silver
Fed Interest Rate Outlook | Expected cuts in early 2026 | Bullish for silver
Geopolitical Tensions | Ongoing risks in ME/EU | Increases safe haven demand
Industrial Demand for Silver | Stable or increasing | Supports price
China’s Economic Recovery | Gradually improving | Boosts industrial demand
Conclusion: The fundamental outlook supports bullish continuation for silver.
Momentum Analysis
Strong bullish momentum after bouncing off the $70 support.
Recent candles show high volume and strong green bodies, signaling fresh buying interest.
If momentum holds, resistance at $76.5 could be tested and potentially broken.
XAG/USD Price Forecast
Timeframe | Expected Move
Short-Term | Likely move to $76.5–$78
Medium-Term | If resistance breaks, $80–$82 target
Long-Term (Weeks) | $88–$92 possible with strong fundamentals
Warning:Any losses are entirely your own responsibility. This is solely an analysis and **not** a recommendation to buy or sell.

SilverF) Bullish trend analysis Read The captionSMC Trading point update
Technical analysis of Silver Futures (SI) – 1H chart using SMC + Fibonacci OTE + EMA trend continuation.
⸻
Market Context
• Bias: Bullish continuation
• Strong impulsive rally → clear break in structure (BOS)
• Price is holding above EMA 50 & EMA 200
• Current price action = consolidation / pullback, not distribution
⸻
Why Price Is Pulling Back
• After the impulse, price is pausing near short-term equilibrium
• This is a rebalancing move before continuation
• Pullback is occurring inside discount, which favors longs
⸻
Key Buy Zone (Blue Area)
~71.80 – 72.30
This zone is high-probability due to:
• SMC demand / order block
• Fib OTE zone (0.705 – 0.79)
• EMA 50 support (≈72.03)
• Prior impulsive origin (base of the move)
This is where smart money typically reloads longs.
⸻
Fibonacci Logic
Measured from the most recent impulse low → high:
• 0.5 / 0.62 = shallow pullback
• 0.705 – 0.79 = optimal trade entry (OTE)
Ideal for trend continuation setups
⸻
Trade Idea (Continuation Long)
Buy on confirmation inside demand
• Entry: 71.90 – 72.30
• Stop Loss: Below demand (~71.30)
• Targets:
• TP1: 74.00 (range high / structure)
• TP2: 77.65 (first marked target point)
• Final TP: 80.05 (upper liquidity / extension target)
Risk–Reward: ~1:3 to 1:5
⸻
Confirmation Triggers (Important)
Wait for at least one:
• Bullish engulfing or strong rejection wick from the zone
• Lower-timeframe CHoCH
• Failure to accept below the OTE zone
• Momentum expansion after tapping demand
⸻
Invalidation
• 1H close below ~71.30
• Acceptance below EMA 50 + demand zone
If this happens → bullish idea is invalid, and price may rotate deeper.
⸻ Mr SMC Trading point
Summary
This is a textbook bullish continuation setup:
• Strong impulse
• OTE + demand + EMA confluence
• Clear upside liquidity targets
Please support boost this analysis

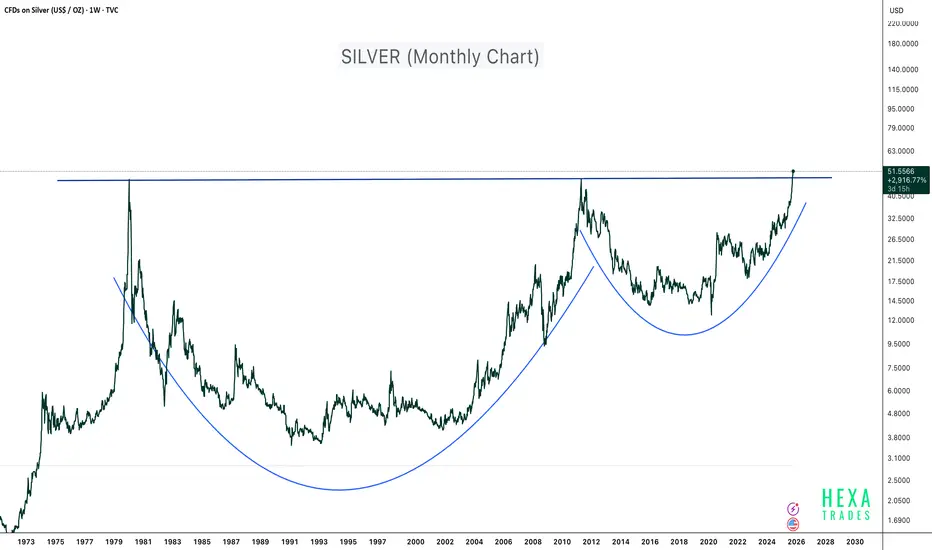
Silver - 45 Years of Breakout!Silver has just completed one of the largest and longest cup and handle patterns in financial history, spanning more than four decades. The metal has officially broken above the 1980 and 2011 highs, signaling a potential supercycle breakout on the monthly timeframe.
This type of long-term technical structure typically marks the beginning of a massive secular bull run, often driven by macroeconomic shifts such as inflation cycles, fiat currency debasement, and rising demand for hard assets.
Technical Highlights:
- Pattern: 45-year Cup and Handle formation
- Breakout Zone: Above $50 confirmed (Weekly chart)
- Structure: Deep base formation showing multiple accumulation phases (1981–2001 and 2012–2023)
Macro Perspective:
Silver is benefiting from:
- Increased industrial demand (especially in solar, EV, and electronics sectors)
- Inflationary monetary policies and growing global money supply
- Renewed investor interest in tangible and real assets
This breakout could mark the start of a multi-year bull run for silver. Long-term investors may view this as an opportunity to accumulate and hold for 10–15 years, aligning with the magnitude and duration of the pattern.
If the price experiences short-term pullbacks in the coming months, use DCA (Dollar-Cost Averaging) to build long-term exposure.
Conclusion:
After 45 years of consolidation, silver is finally breaking free. The chart points toward a historic structural breakout, potentially setting the stage for the next precious metals supercycle.
Cheers
Hexa
Disclaimer:
This analysis is for educational purposes only and does not constitute financial advice. Always conduct your own research and manage risk responsibly.
Silver- Monthly TFLook at how far we are extended above the 21 SMA on the monthly TF, the same is the case for any TF- weekly included. Usually such huge divergences even out, the last time we were at $50 peak in 2011, it was similar and we know what happened. It may not play out the same over the next 14 years, but we have to be wary especially if holding bags and in gains or if trying to enter now, which has more risk v reward imho

Silver is in the Bullish directionHello Traders
In This Chart XAGUSD HOURLY Forex Forecast By FOREX PLANET
today XAGUSD analysis 👆
🟢This Chart includes_ (XAGUSD market update)
🟢What is The Next Opportunity on XAGUSD Market
🟢how to Enter to the Valid Entry With Assurance Profit
This CHART is For Trader's that Want to Improve Their Technical Analysis Skills and Their Trading By Understanding How To Analyze The Market Using Multiple Timeframes and Understanding The Bigger Picture on the Charts

Silver Breakout Confirmed or False Move Ahead?💎 PROFESSIONAL SILVER BLUEPRINT: XAG/USD BREAKOUT STRATEGY 💎
Day & Swing Trade Opportunity | Metals Market Analysis
🎯 TRADE SETUP SUMMARY
Asset: XAG/USD (Silver vs US Dollar)
Bias: Bullish Breakout
Timeframe: 4H & Daily Charts
Strategy Type: Momentum Breakout with Risk Management
📊 ENTRY & EXECUTION PLAN
⚡ ENTRY CONDITIONS (MUST HAVE ALL):
Price Breakout above 66.900 with 4H candle close
Volume Confirmation – Higher than average volume on breakout
Momentum Alignment – RSI above 50 (but not overbought >70 on entry)
🎯 PRIMARY TARGET: 69.000
Why this level? Previous major resistance turned support
Multiple confluence:
Fibonacci 61.8% extension from recent swing
Psychological round number
Overbought zone on weekly chart
🛡️ RISK MANAGEMENT PROTOCOL
Stop Loss: 65.500 (1.4% risk from entry)
Alternative SL options for different risk profiles:
Aggressive: 66.200 (1.05% risk)
Moderate: 65.500 (2.1% risk)
Conservative: 64.900 (3.0% risk)
🔍 MARKET CONTEXT & RATIONALE
📈 TECHNICAL CONFLUENCE:
Pattern Recognition: Ascending triangle breakout on 4H
Moving Averages: Price above 50 & 200 EMA on daily
Momentum: MACD histogram turning positive on daily
Volume Profile: High volume node at 66.50 supports bullish bias
🎭 MARKET PSYCHOLOGY:
"Police Barricade" at 69.000: Institutional resistance zone where profit-taking intensifies
Overbought Trap Risk: RSI likely to hit 75+ at target – smart money exits early
Retail Sentiment: Currently neutral – room for bullish momentum
🌐 CORRELATION MATRIX – RELATED ASSETS
1️⃣ PRIMARY CORRELATION: XAU/USD (Gold)
Correlation Coefficient: +0.85 (Strong Positive)
Key Insight: Silver often amplifies gold moves (2-3x volatility)
Watch For: Gold breaking $2,350 = Accelerated silver rally
Divergence Alert: If gold rises but silver lags → Caution needed
2️⃣ USD INFLUENCE: DXY (US Dollar Index)
Relationship: Inverse (-0.70 correlation)
Critical Levels: DXY below 104.50 = Bullish for silver
Data to Monitor: Fed statements, CPI data, employment reports
3️⃣ CURRENCY PAIRS WITH HIGH CORRELATION:
EUR/USD (+0.65) – Euro strength often mirrors silver strength
AUD/USD (+0.60) – Australia = major silver producer
USD/JPY (-0.55) – Risk sentiment indicator
4️⃣ COMMODITY & EQUITY CORRELATIONS:
Copper (+0.75) – Industrial demand proxy
S&P 500 (+0.50) – Risk-on environment supportive
US Treasury Yields (-0.60) – Real yields critical for non-yielding metals
⚖️ FUNDAMENTAL BACKDROP
🦅 MACRO DRIVERS SUPPORTING SILVER:
Monetary Policy: Dovish Fed pivot expectations
Industrial Demand: Green energy transition (solar panels, EVs)
Geopolitical: Safe-haven flows during uncertainty
Inflation Hedge: Persistent inflation concerns
⚠️ RISK FACTORS MONITORING:
USD Strength Surprise
Rate Hike Resurgence
Economic Slowdown impacting industrial demand
ETF Outflows (SLV holdings)
📋 TRADE MANAGEMENT PROTOCOL
A-SCALE EXECUTION (RECOMMENDED):
Position Size: 1-2% account risk per trade
Scale-In: 50% at breakout, 50% on retest of 66.900 as support
Scale-Out: 50% at 68.200, 50% at 69.000
Trailing Stop: Move to breakeven at 67.800
B-SCALE ADJUSTMENTS FOR MARKET CONDITIONS:
High Volatility: Reduce position size by 30%
Low Volume Breakout: Wait for confirmation candle
News Event Day: Consider entering after news settles
📊 CONFLUENCE CHECKLIST – BEFORE ENTERING
✅ Price > 66.900 (4H close)
✅ Volume > 20-day average
✅ DXY < 104.80
✅ XAU/USD trending upward
✅ No major economic news in next 4 hours
✅ Risk defined (max 2% of account)
"Are you trading silver this week? Bullish or bearish?"
"What's your silver target for Q2?"
"Which correlation do you find most reliable: gold or DXY?"
✨ LIKE if this adds value! FOLLOW for systematic trade blueprints! ✨
💬 COMMENT your silver outlook or trade adjustments below!
🔄 SHARE to help fellow traders navigate volatile markets!

Silver is in the Bullish directionHello Traders
In This Chart XAGUSD HOURLY Forex Forecast By FOREX PLANET
today XAGUSD analysis 👆
🟢This Chart includes_ (XAGUSD market update)
🟢What is The Next Opportunity on XAGUSD Market
🟢how to Enter to the Valid Entry With Assurance Profit
This CHART is For Trader's that Want to Improve Their Technical Analysis Skills and Their Trading By Understanding How To Analyze The Market Using Multiple Timeframes and Understanding The Bigger Picture on the Charts

Silver Bullish Continuation Expected After PullbacksH4 - Strong bullish move
No opposite signs
Until the two support zones hold I expect bullish continuation
👉 If you enjoy this analysis, please Like, Follow, and Support the profile! Your engagement motivates us to share more quality setups.

Silver - Looking To Buy Pullbacks H4 - Strong bullish move.
Currently it looks like a pullback is happening.
Until the two Fibonacci support zones hold I expect the price to move higher further.
If you enjoy this idea, don’t forget to LIKE 👍, FOLLOW ✅, SHARE 🙌, and COMMENT ✍! Drop your thoughts and charts below to keep the discussion going. Your support helps keep this content free and reach more people! 🚀
--------------------------------------------------------------------------------------------------------

SILVER Long IdeaWe have a unconfirmed ascending triangle formation at silver. After the daily close on the red lines , formation will be confirmed and we can target easly to the blue area as shown
