Gold 8h Chart BUY TradeWe have araound 15 hours for the end of the week so that means that in 2 candles close the day and we can take a trade with a good ratio around the price 1280.00$ looking for the 1289.90 Monthly zone for take profit and 1272.00$ for the Stop Loss
Simple

Simple chart on how bitcoin movesThe chart does all the talking. Some Highlights:
RSI indicator: We fail to enter the bull run according to the RSI indicator. We are in the void zone(neutral). Most likely we will go down in the RSI to the bear zone.
Historically, the bear market last about 20 months. I predict the bull will come in in June, July or no later than August.

GBPAUD-BUYOverall Lower Highs and Lower Lows within a nice Descending Structure. Another Descending Channel is now formed within the Higher Time Descending Structure. Anticipating a buy as it reaches the higher timeframe strucuture.


Supply and Demand Long Term areasThese levels show Major momentum indicating that there is high supply/Demand Imbalance!
Think like the banks if you wants to compete with them!

USDJPY SELLthe price comes in bearish trend and brings line of trend with 3 touches broke its previous support and it is testing quite this pulling several wicks the price is losing strength and would be the level being 61.8%

NZDUSD BUYThe price has just broken a strong bearish trend line and this bullish formation broke its previous resistance and is trying to set it up as a floor, since its new floor is also at a fibo level

EURUSDDouble top formed, and price is resisting the area marked orange. I do believe there will be one more bounce at the bottom of the trend line so take profit could be set lower.
Keep it simple and be one step ahead.

GBPUSD LongTrendline has been touched again, further news will be manipulated in order to reach the selloff zone (marked orange). Nice simple low risk trade.
Be one step ahead.
Keep it simple.

Dollar Bearish
Monthly chart shows the completion of a right shoulder. Bearish momentum starting now.

USDCAD 4HR SHORT TERM PROJECTIONPrice chopping around a few key levels, USD high impact news announcements coming in tomorrow. Will be watching while keeping a close eye on the dollar index. Short-term view remains long, as of now.


USD/JPY LONG?
Here we have a possible BUY trade @ 111.820 setting up. We are still in a bullish market for now as long as we are above my Breach Line. We see BUYERS came back into the market very strongly @ 111.770. We will be looking to take this trade to 112.780 and analyze price movement at this threshold. If we can't get a breach look out for a major reversal Daily Breach @ 111.385. #SIMPLETRADING

USD/JPY Long Very Simple TradeA clear uptrend on the hourly chart and a simple long position hoping to reach resistance line!


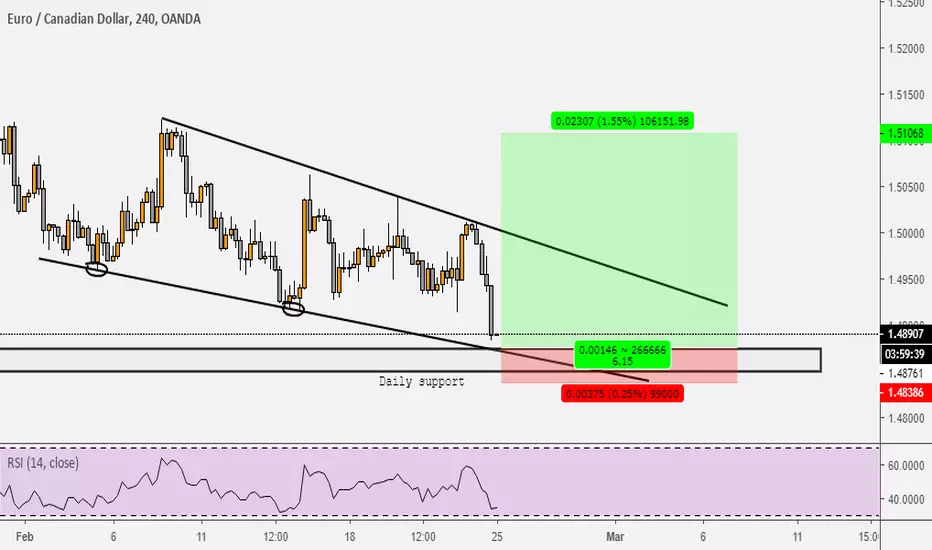
Falling wedge 6:1 RRExpecting the 3rd touch to wedges bottom to be bounce up and after that finally a break above trend line to retest highs. Rectangle represents daily supply zone , where smart money has buy orders. CPI at Thursday should fundamentally support this idea.
Enough talking, trading is simple manage your money and risk.
Trendline and resistance levelYou really cant ignore the strength of this set up, candles are at both a TL and resistance level, so to me this looks like a very clear short oportunity.


Sell Idea on goldPotential sell setup on GOLD. The only thing to be cautious about is that GOLD is in an uptrend on the daily. The DXY (Dollar Index) is also in consolidation on the Daily so we very well could see GOLD rise.


