EURUSD BIG SHORTFollowing my previous post, EURUSD using the news as momentum, chose to break through the daily trendline, hold and then continue on with it's bearish movement.
As I suggested in my previous post if this was to happen we could look for the EURUSD to continue short all the to the weekly trend support line.
Currently the pair is pulling back in preparation for its upcoming short impulse.
TARGETS SET AT 1.5000
A break of the current pullback should leave options for a second entry or a first if you havent already got a position.
Simple

USDJPY shortsupport on 114.350 formed double top, divergence spotted on stoc (9,3,3), signal shape candle is forming, once the candlestick closed and confirmed as a signal candle, target short to fibo 50% and 38.2% current price is at 113.933
SL- 114.500
TP1- 111.367
TP2- 110.662


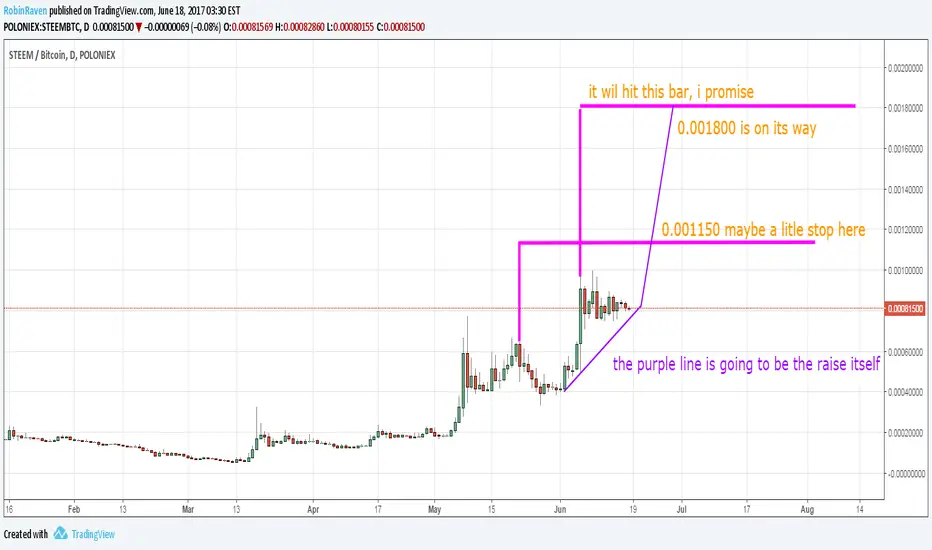
STEEM/BITCOIN PREDICTION, SIMPLICITY IS REWARDINGi can dream what is going to happen because i sleep with the charts, i think my analysis is going to be perfect, no doubts, steem will hit around 1800 mark my words, maybe 1200 while it is on its way to 1800.
idk why, i just analyze on my own way, i dont seek for reasons, the paterns repeat themself, like day an night.
EUR/USD, Continuation?Chart speaks for itself. It need to get back above ~1.1160 and above the trendline to confirm. Just an idea, not an advice!

CADJPY 1M OutlookKeep Your charts clean and simple, breakout of descending trendline, price came back to retest and formed an indecision candle at 32% retracement

I think LTC wants to go upHere's my reasoning: People who own LTC want it to be worth more money. And people who buy LTC also want it to be worth more money.

Target 1 Bat Pattern WinnerHey all,
Heres a Bat pattern that I forgot to publish but was a trade taken. It's a small Bearish bat pattern on USDJPY. We managed to roll over very pain free to target 1 however then moved back up to break even stopping us out.
For those who don't know, I like to trade 2 positions per trade with 2 targets. Once target 1 is hit, I then move the stop loss on target 2 to break even so it becomes a risk free trade. Still bagged us a nice +47 pips.
Fibsii

AUDUSD Potential CypherHey all,
Here is a potential short Cypher pattern forming on AUDUSD 4H. It still has quite a while to go however we are now on the final C-D leg and looking to break above the B leg structure point.
If we do get a pattern completion, we will be looking for the usual 38.2 and 61.8 fibonacci targets. The risk reward on this pattern gives us approx a 1:1 to target 1 and 1:4 to target 2 so it's pretty good!
Will be watching this pattern moving into next week,
Fibsii

Harmonic setup on EU dailyWe can see that price is currently in an uptrend, heading to 1.0980: a key level, 0.618 of the latest weekly swing down, and completion point for an AB=CD pattern. Looking for a daily candle signal at this zone to enter any shorts, riding the wave up until then.

Flag Pattern on AUDNZDHi guys,
here on AUDNZD we have no structure looking left on the higher timeframe. In cases like this i start looking for simple pattern formations, like flags, triangles and wedges in the trend direction.
On the chart above you have what could be considered a flag pattern that's been broken to the upside. Price is now retracing back and giving us a better risk to reward ratio.
Stops below the previous lows, target1 at the retest of the highs, target2 to be determined (could go very far).
If you want to share your viewpoint or ask questions, feel free to comment below.
Otherwise, see you in the next chart!

Short wave 4. Buy wave 5Simple analysis on gold. Price has finished 3 waves to the upside and will now continue this short term bearish trend until the 38.2 levels. Afterwards we should see the final wave 5 push to the upside

Decision point on EURNZD! Up or down?Hi guys,
just wanted to let you know that i'm watching attentively to this pair, since price is testing a very important structure level that acted as support and resistance many times in the past.
As of now, i'm looking for weaknesses in order to short the market: notice that we're deeply in overbought condition and price is testing a psychological number (along with structure) so any other candlestick signal would make me sell at market.
Nonetheless we should be ready to change our mind if price breaks the structure yellow zone so that we can take advantage of both the situations.
Never be unprepared! Think ahead!
I'll keep you updated.
If you want to share your standpoint, feel free to comment below.
Otherwise, see you in the next chart!

USD/CHF (BUY)Daily time frame: 100% trail your stop loss with this pair BUT do not move that stop loss until atleast 50% of that green area has been breached my key target for this pair is potentially hitting 1.0500 past this green area so it's your choice how you take this trade I know what I am doing.

EURAUD LONG SETUPENTRY: 1.37 ~ 1.38 Key LT Weekly Support Zone
The first strong bullish bounce inside the zone indicates there are some buying momentum
Wait for pullback around the swing low area @ 1.3730 to go long
STOP: below swing low @ 1.3730 and 1.37 PRN
TARGET: 1.400 (potential+5R)

Potential Short Opportunity on NZDUSDTraders believe that one should always have a prediction. However, trading is not like that, at least that is not the way I, or any of the traders I work with, do it.
I analyze the market and create a "Killzone" or zone where I want to get involved, and IF the market gets there, THEN I look for a reason to get involved. Sometimes, the market never gets there, and that is something I have to deal with. However, it is way better to stay one step in front of the market and wait for it to come to you than be one step behind and chase it. If you do the latest, you are just reacting, and you will most likely lose money.

GOLD Daily gold prices has fell to a two week low today as the dollar strengthens as yellen stated the importance of increasing rates and possible hike in march ,currently trading with an intra-day high at 1228 and a low at 1216, still looking for price to push up to 1254 before heading back down to 1200s then 1180

Updated AAPL "low complexity chart" using long term trends.Fundamentals show that Apple have had a linear and continuous growth since the launch of the iPhone. No actual data suggest that this will change anytime soon. Meanwhile the AAPL stock is highly impacted by a succession of self-realized prophetic hype cycle...
My very dumb guess, that however had been proven true already 3 times in the past, is that 2009 linear trend is a really major and strong resistance line. However when a stock is over-evaluated, even by the greatest analyst, correction ensue.
The chart should be pretty crystal clear about why this might be a very good time if you seek for an entry point for long term. However stay aware that it still may shake a lot until and after quarterly results.


Wedge pattern on AUDUSDHey guys,
today i want to share with you another opportunity on AUDUSD. For those who are not familiar with simple patterns, this is a wedge pattern (rising). This kind of formation usually occurs after a very steep movement; you can identify this by drawing two trendlines on the chart. You see the bottom one is steeper than the upper. This means price is going up but with less strenght than before. This is also confirmed by RSI divergence (bottom of the chart) that certifies that bulls' fuel is running out. For those reasons i'm going to watch carefully to this setup waiting for price to break to the downside and then selling the first retracement.
In this particular setup we have plenty of room to the south, thus the risk to reward ratio would be very nice (target2 may be all the way down to 0,720)
Let's see if it comes true.
If you have any question, feel free to write it below.
Otherwise, see you in the next chart!

Flag pattern on EURGBPHey guys,
another simple pattern on my radar today. This time i'm right on time because the break has just happened. You can see the big impulsive leg that broke multiple structure levels on the 4hr chart. Like i said on the previous idea usually after impulses like this price put brief form of consolidation like flag, triangles and pennants.
You can trade in two different ways: the first is to sell the close of the breaking candle, but in this case in order to have a better than 1:1 RR you have to set your target1 below structure (maybe lining up with 1.27 extension), the other way (the one i'm using) is to wait for a pullback and then sell as soon as you get a 1:1 RR at the retest of the lows. And then maybe you can split your position and take target2 at the extension.
It's up to you.
Feel free to comment below if you want to share your viewpoint or ask some questions.
See you in the next chart!

NZDUSD Long CypherHey all,
Haven't seen much activity in the markets this week. Checked NZDUSD this morning though and found an at market Cypher pattern. This pattern has already pressed lower than the .786 retracement entry but is still valid which means we can get involved with a better risk reward.
Only a small risk on this trade so should be open to most traders. This is also a pattern following the underlying trend so would be hoping for further bullish movement.
Keep an eye out,
Fibsii Team
