Small Caps Pause on Tariffs – Key Levels to Trade IWMAMEX:IWM Daily Outlook 📈
Tariff headlines cooled the hot streak, but structure stays bullish while above 261.32. Small caps still showing relative strength vs SPY/QQQ — this is chop, not a trend reversal (for now).
🔑 Key Levels
• Pivot: 261.32 🎯
• Resistance: 265.75 → 267.18 🚧
• Support: 259.27 → 258.24 🛡️
🧭 Trade Thesis
Bull Case 🟢
– Reclaim 265.75 → run to 267.18
– Dips holding 261.32 = buy structure
– Best look: VWAP reclaim + OR hold
Bear Case 🔴
– Acceptance below 261.32 flips bias
– Targets 259.27 → 258.24
– Below 258 opens 255 zone
🎯 Plan
Buy weakness > chase highs
Flip short only if 261 fails
Risk defined at the pivot
Levels > Noise
Smallcaps

What to expect of the Russel 2000 since the end of QT (20% move)The Russell 2000 is officially in the "Post-QT" window.
Historically, 120 days after the Fed ends Quantitative Tightening (QT)—the process of pulling money out of the system—small caps catch a massive liquidity wave and prices go up, right now we're seeing an everything upside market and the Russel is about to explore higher highs.
21% on average is the return after 120 days the USA stopped reducing their balance sheet
Current IWM Price: $258.20 Projected Price Mark: $296.88 (by late March)
Small caps are currently at 25-year valuation lows vs large caps. The coiled spring is about to pop, this could send higher all small caps, including cryptocurrencies. AMEX:IWM

Aclarion, Inc ($ACON) - @MyMIWallet #TradeReview📈 MyMI Wallet Trade Review — Aclarion, Inc. ( NASDAQ:ACON )
NASDAQ:ACON is showing strong pre-market momentum, printing a high of $9.35 after an aggressive expansion move. Price has reclaimed prior resistance and is now trading above multiple short-term EMAs, confirming trend continuation strength into the open.
🔍 Technical Notes
Pre-Market High: $9.35
Immediate Resistance: $9.50 → psychological
Key Upside Target: $11.19 (prior supply / extension zone)
Support to Hold: $8.80–$9.00 (VWAP / EMA confluence)
Momentum: Extended but still constructive — watching for healthy pullbacks, not breakdowns
📊 Structure & Flow
Price accelerated out of prior consolidation with strong volume confirmation, suggesting active participation rather than a low-liquidity spike. Momentum indicators are beginning to cool, which is normal after expansion — continuation depends on how well buyers defend higher lows near VWAP.
⚠️ Risk Awareness
After sharp pre-market runs, expect:
Volatility at the open
Possible pullback to test support
Continuation only if volume steps back in
🎯 Game Plan
Bullish above VWAP with volume
Cautious if it loses $8.80 early
Watching for continuation setups toward $10+ and $11.19
NASDAQ:ACON is one of today’s Top Pre-Market Movers on MyMI Wallet, and it’ll be interesting to see how it behaves going into Market Open.
📌 Not financial advice. Always manage risk.
#ACON #Premarket #StockMarket #DayTrading #MomentumStocks #SmallCaps #TradingView #MyMIWallet #TheFutureOfFinance

$OTHERS Crushed Against $BTC - WARNING!Small Cap Alts continue to be pummeled against CRYPTOCAP:BTC
CRYPTOCAP:OTHERS needs to find a bottom very soon and break above .14 otherwise they are cooked for the cycle.
I feel very sorry for people who have 80% + of their portfolio allocated to these.
Gonna create a ton of ₿itcoin-Maxis next cycle that's for sure

OCGN: Strong Bounce From Higher Low and Trend Reversal SetupOCGN has moved about 20 percent up from the recent higher low near the 1.18 zone. The downtrend has slowed and the price is showing a strong reaction from support. If the price breaks above the short term trend line, a reversal toward 1.90 may start. A move above 1.90 can open the way toward the 2.40 to 2.60 area. Watching for confirmation of trend change.

VKTX Viking Therapeutics Exploding Higher TodayVKTX surges higher today after pulling back again near 200-day EMA. Not sure what the news is that's driving the big move higher. The news I did find talks about the following:
1) Viking Therapeutics completed a drug clinical trial stage earlier than expected last week
2) VKTX is on lists of hot stocks to buy for 2026 and could be a takeover, acquisition target
3) VKTX is recommended by 15 Wall Street Ranked analysis who give stock 12-month consensus average price target of $92
4) VKTX is on lists of stocks with high short interest (over 20% short interest) TO BUY because they are vulnerable to getting short-squeezed
Let's talk about the 4th item above. Just imagine VKTX continues to move higher on good news about clinical trials or possibly getting acquired by a larger company. This would push the stock even higher and will force traders who have big short positions on the stock to quickly cover, creating a snowball effect that frantically drives VKTX even higher and completely surges! This is reminiscent of what happened to Game Stop (GME) a few years back. I hope that this happens because I am long on several rather large call option positions on VKTX!
Whatever you all decide to do..... Good Luck!

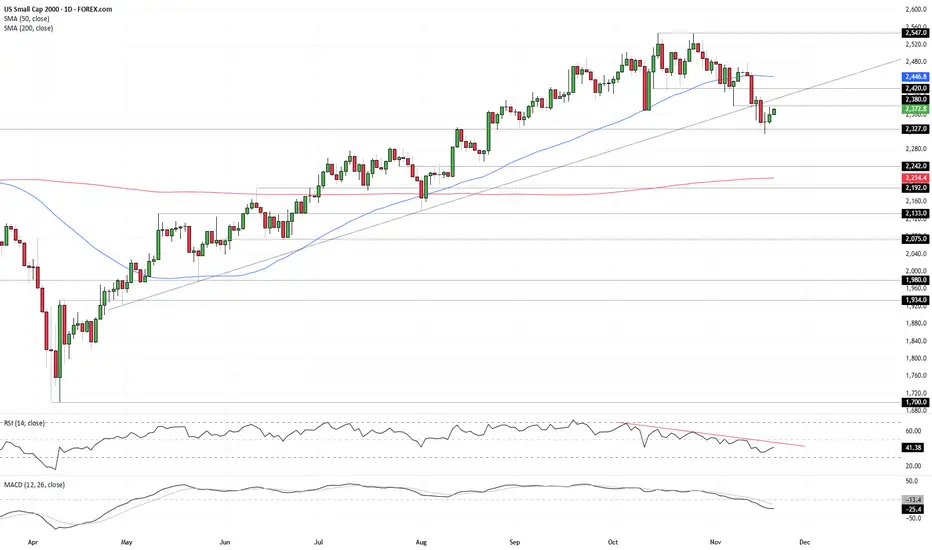
Momentum Weak Despite Nvidia BoostShould small-cap U.S. equities be rallying because AI giant Nvidia just delivered another blowout earnings update? Sure, risk sentiment has improved, and continued AI investment comes with some immediate broader economic benefits, but the move still comes across as a little suspect, especially with the prospect of near-term Fed rate cuts dwindling by the day. While the price signals for our small-cap contract are pointing to upside risks, momentum indicators are not confirming, suggesting selling into strength may be the way to play it, especially if we see a reversal pattern.
Looking at the daily chart, we see a clear morning star bullish reversal pattern printed this week, with follow-through buying after the Nvidia results. However, as was the case in the prior session, the price has been unable to take out 2380 so far, marking the low struck on November 7. It’s only a minor level, but it has seen price action on either side of it this month, making it relevant when assessing setups.
Despite the bullish price signal, RSI (14) and MACD remain firmly bearish. RSI continues to trend lower beneath 50, indicating downside pressure remains even if it’s weakened a touch in recent days. MACD also sits in negative territory, having already crossed the signal line from above in late October. It too is showing signs of turning, but for now the combined message remains one where selling into strength may be the better way to play it.
Should the price be unable to breach and hold above 2380, shorts could be considered beneath the level with a stop above for protection, targeting 2327 support initially. Should that and Tuesday’s low give way, 2275 or 2242 screen as other downside targets.
Of course, if the price can push above and hold 2380, longs could also be considered, allowing for a stop to be placed beneath to protect against reversal. Such a move may see momentum indicators tilt neutral rather than bearish. If that were to occur, the merits of long trades would be improved. 2400, where the price was capped prior to the latest leg lower, looks as an appropriate initial target, with the 50DMA the next after that.
Good luck!
DS
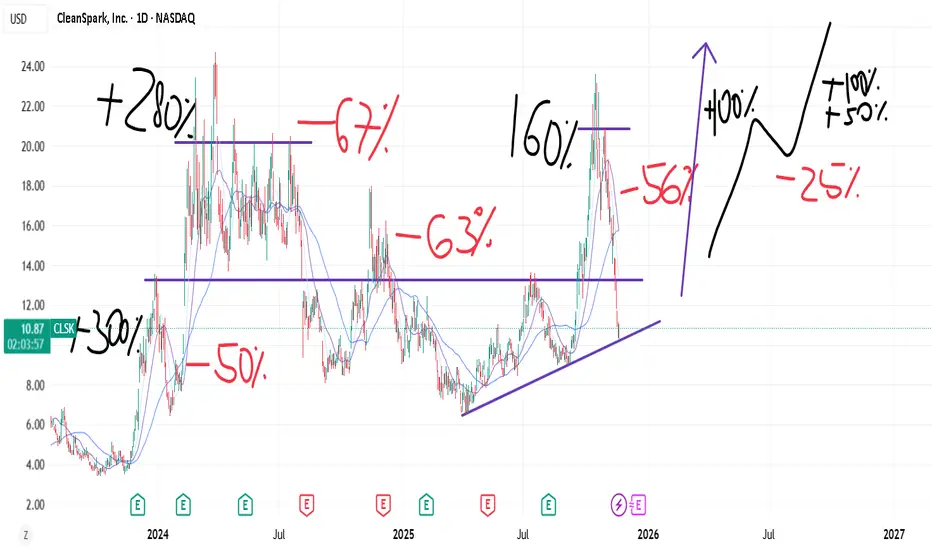
CLSK: Based on momentum principles.As long as BITSTAMP:BTCUSD delivers and AMEX:BLOK is relatively strong, and obviously NASDAQ:NVDA strong.
NASDAQ:CLSK every correction shows less damage (%) which I think is a bullish sign.
Momentum based on Dan Zanger principles. If you had a 160% rally. Even if trend was broken, I dont think you can kill a momentum this easily. Hence, at least "some" strength should follow. There are many examples, that I can show/fact proof.
The risks: I think TVC:TNX rallying is not good and TVC:DXY rally would both be a head wind.
Good: Gold topping should be defacto bottom for BTC near term? ie the driver for rotations. % chasing.
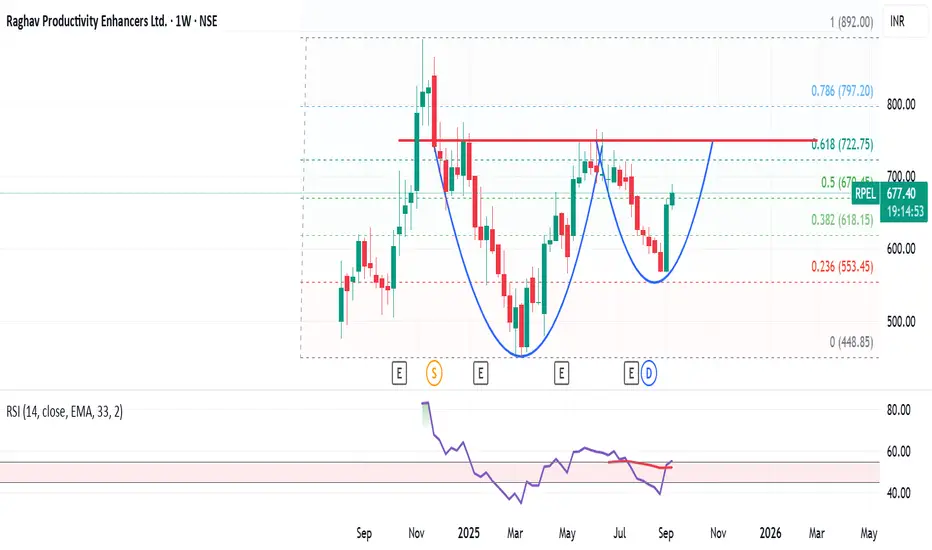
Cup n Handle pattern will work?Let's see if Cup n Handle pattern give some movement to this unknown stock. PE vs ROCE is not good, but technical pattern is showing some promise
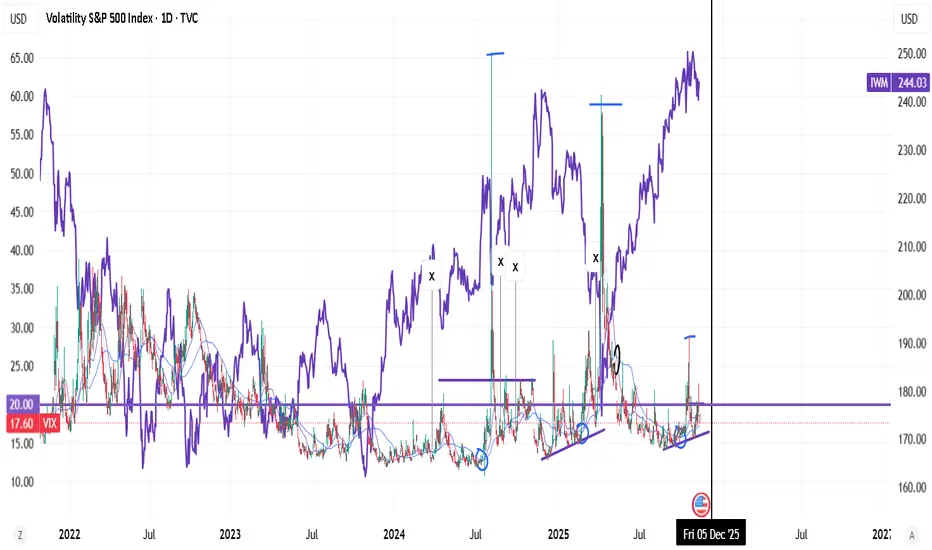
Upswingy VIX in patterns is bad for Small cap returns.Where VIX gets 10/20/50 upswings, goes in patterns (structure). it seems it's a bad period for small caps.
Also, rising $TNX. which is the case now .
x- stands for bullish weekly macds.
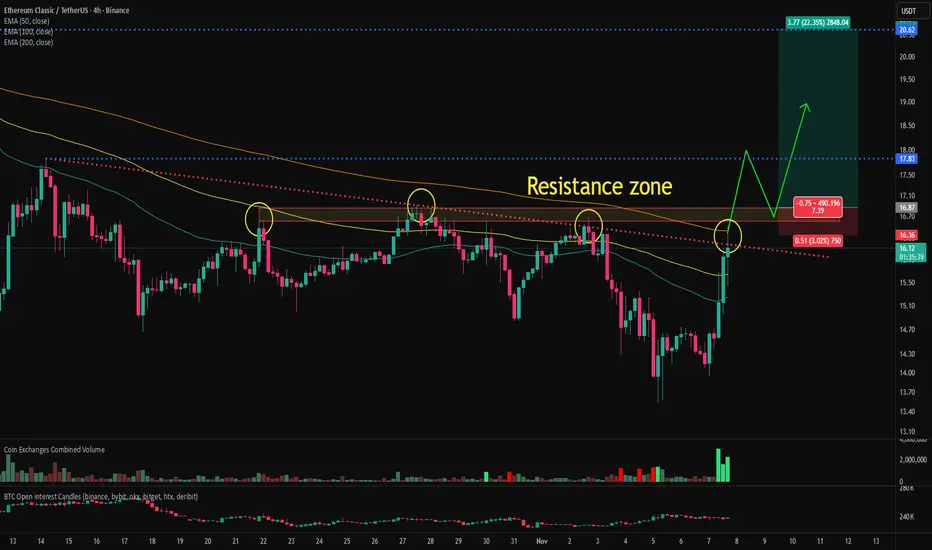
ETC(ehereum classic) chart analysis and bullish signalEthereum Classic is currently attempting to break above the 200-period moving average, a key resistance level, and a major supply zone on the 4-hour chart. Although it’s facing resistance at the moment, a decisive breakout through these overlapping resistance zones could provide an attractive long-entry opportunity with a favorable risk-to-reward ratio.
Given that this resistance area has rejected multiple breakout attempts in the past, the probability of a successful breakout this time appears relatively high.
The ETC/BTC chart has also cleared several major resistance levels, suggesting that ETC could follow a similar pattern to recent strong performers such as ZEC, DASH, and 1INCH.
The bullish alignment on the ETC/BTC chart also indicates that Ethereum Classic is outperforming Bitcoin.
If Ethereum Classic confirms a breakout above the resistance zone, I will share an updated analysis on the subsequent price outlook.
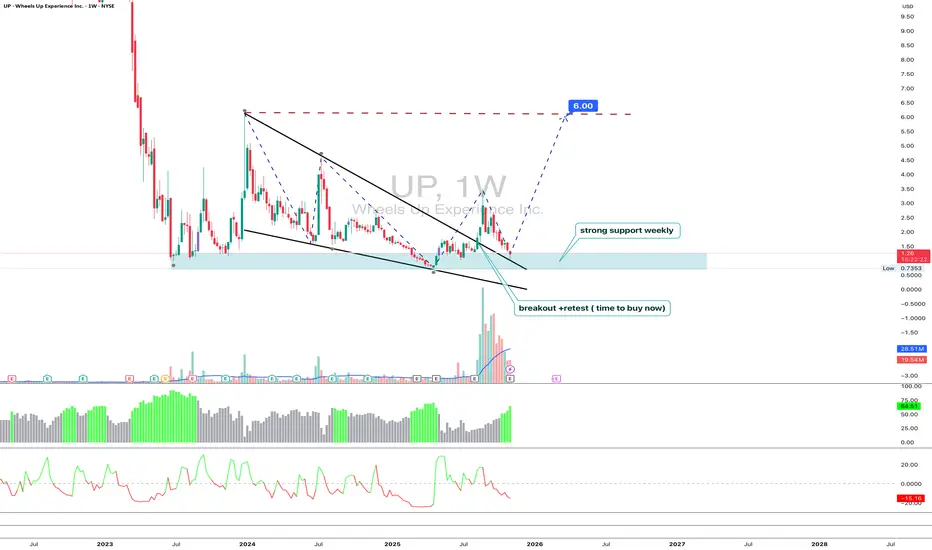
UP 1W-business jet without autopilot, but the runway looks clearTechnically, Wheels Up (UP) broke out of a long falling wedge and returned to the wide demand zone around $1.00–$1.30, where weekly support has formed. Volume expansion and bullish divergence signal that accumulation is taking shape. As long as price stays above $1.05, the structure remains constructive with initial upside targets at $1.60 and $1.80, while a breakout above $2.00 could open the door toward $6.00.
Fundamentally , the company continues its transformation after the liquidity crisis and strategic partnership with Delta Air Lines. Management has shut down unprofitable low-margin programs, refocused on high-yield corporate and frequent-flyer clients, and introduced a leaner “asset-light” model by outsourcing part of its fleet to partner operators. Q3 2025 results showed revenue near $185 million with solid gross bookings growth and improved operational efficiency - 99 % flight completion and 89 % on-time performance mark the best metrics since restructuring began. Losses and negative cash flow remain, but cost discipline is improving, and the Delta integration is slowly turning into a real commercial synergy. If corporate demand keeps strengthening and free cash flow moves toward breakeven, UP may turn into a rare small-cap comeback story in the aviation sector.
Tactically , the plan remains simple - hold above $1.05, look for movement toward $1.60 and $1.80, take partial profits near $2.00, and re-enter on retests around $1.20–$1.30 if volume confirms. A weekly close below $0.95 would invalidate the bullish scenario.
The market has heard “we’re taking off” before but this time, there’s at least a real runway under the wheels.
$IWM: BEARS ARE GAINING CONTROL AMEX:IWM appears to be performing worse than the $SPY. The narrowing channel, which looks like a wedge, has broken, and the price has fallen below the December high support level, indicating a potential failure to achieve the new ATH. To make matters worse, it is also dropping below the 10-week simple moving average (SMA) this week. The next level of support is at 237.
When Generals Run and Soldiers Nap — The Market’s Odd ParadeEver seen an army march where the generals sprint ahead, but the soldiers just yawn and stay behind?
That’s exactly what’s happening in the U.S. futures battlefield right now.
The ES, NQ, and YM — our large-cap “generals” — opened the week above their prior highs, looking ready for victory speeches. But the RTY, representing small caps, is still lagging like it hit the snooze button.
The Breadth Problem
Healthy rallies need everyone on board. When small caps don’t join the charge, it’s like running a marathon with only one leg — you might move forward, but not for long.
That’s why this gap between the big guys and the small ones is called bearish divergence — momentum without muscle.
How Deep Could It Go?
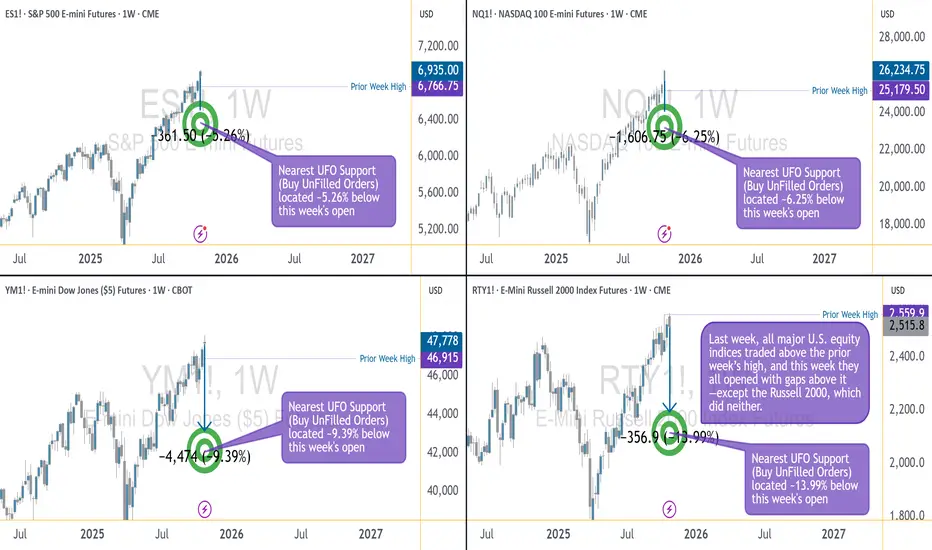
Under the surface, liquidity pockets (UFO supports) show the “landing zones” below price:
ES: ~5% lower
NQ: ~6% lower
YM: ~9% lower
RTY: ~14% lower (!)
Translation: if the market trips, the generals may bruise a knee — but the soldiers could roll down the hill.
Tick, Margin, and Scale
CME index futures come in two flavors — E-minis for the pros, Micro E-minis for precision control:
S&P 500 (ES/MES): tick 0.25 → $12.50 / $1.25; margin ≈ $21K / $2.1K
Nasdaq 100 (NQ/MNQ): tick 0.25 → $5 / $0.50; margin ≈ $30K / $3K
Dow Jones (YM/MYM): tick 1 → $5 / $0.50; margin ≈ $13K / $1.3K
Russell 2000 (RTY/M2K): tick 0.10 → $5 / $0.50; margin ≈ $9K / $0.9K
(Approximate numbers, educational only.)
The Lesson
Breadth divergences don’t “predict” the end of the rally — they just whisper: “Careful, this parade’s out of sync.”
So before chasing the next breakout, remember:
even the best generals can’t win a war if their soldiers stay in camp.
Want More Depth?
If you’d like to go deeper into the building blocks of trading, check out our From Mystery to Mastery trilogy, three cornerstone articles that complement this one:
🔗 From Mystery to Mastery: Trading Essentials
🔗 From Mystery to Mastery: Futures Explained
🔗 From Mystery to Mastery: Options Explained
When charting futures, the data provided could be delayed. Traders working with the ticker symbols discussed in this idea may prefer to use CME Group real-time data plan on TradingView: www.tradingview.com - This consideration is particularly important for shorter-term traders, whereas it may be less critical for those focused on longer-term trading strategies.
General Disclaimer:
The trade ideas presented herein are solely for illustrative purposes forming a part of a case study intended to demonstrate key principles in risk management within the context of the specific market scenarios discussed. These ideas are not to be interpreted as investment recommendations or financial advice. They do not endorse or promote any specific trading strategies, financial products, or services. The information provided is based on data believed to be reliable; however, its accuracy or completeness cannot be guaranteed. Trading in financial markets involves risks, including the potential loss of principal. Each individual should conduct their own research and consult with professional financial advisors before making any investment decisions. The author or publisher of this content bears no responsibility for any actions taken based on the information provided or for any resultant financial or other losses.
Russell 2000: Is the lagging small-cap about to charge higher?Russell 2000 is the laggard, while the S&P 500, Nasdaq, and Dow scale new record highs.
Could small caps be next to break out?
While all major US equity indices are hitting new all-time highs, the Russell 2000 is still consolidating just below resistance. This sets up a pivotal moment for traders as the Fed decision looms and Q4 earnings heat up.
Price is holding above the lower trendline of a potential ascending triangle pattern, with buyers defending support and momentum building for a potential breakout above peak resistance.
RSI on a daily basis sits in the mid-50s (neutral), but with room for renewed upside if a breakout occurs. Alternatively, a reset down to oversold could lead to a short-term decline of around 5% to the prior bottom.
But October’s strong earnings and increased bets on Fed rate cuts provide a positive tailwind for small caps this quarter.
Watch for a shift in flows from big tech and mega-caps to small caps if market breadth improves post-Fed.
Keep an eye on the top, as a breakout could open the door to new all-time highs and fresh momentum for the Russell 2000. Don’t miss the rotation potential as Q4 trading picks up.
This content is not directed to residents of the EU or UK. Any opinions, news, research, analyses, prices or other information contained on this website is provided as general market commentary and does not constitute investment advice. ThinkMarkets will not accept liability for any loss or damage including, without limitation, to any loss of profit which may arise directly or indirectly from use of or reliance on such information.

Generals Charge, Soldiers Stall: Reading Bearish Divergence1. Context: The Battle Line Between Large and Small Caps
This week’s futures landscape paints a striking contrast between leadership and hesitation. In the CME equity index universe, the large caps — ES (E-mini S&P 500), NQ (E-mini NASDAQ 100), and YM (E-mini Dow Jones) — advanced as a united front, all opening above their prior week’s highs. The market generals were charging confidently uphill.
Yet, on the same battlefield, the RTY (E-mini Russell 2000) lagged behind. The small caps failed to take out the prior week’s high and opened below the aggressive gaps that marked their larger counterparts. In trader terms, breadth was narrowing. In storyteller terms, the generals were calling “forward!” — but the soldiers weren’t following.
Such divergences in participation often mark transition zones in market psychology. When large caps push while small caps stall, it doesn’t necessarily mean the campaign is lost — but it does mean confidence among the broader troops is weakening.
2. Reading the Divergence: When Breadth Narrows
The relationship between large-cap and small-cap indices often reveals more than just price action — it exposes the structure of conviction. In sustained bullish environments, small caps tend to lead or at least confirm the move. Their participation signals that risk appetite is healthy across the field, not confined to the biggest names.
When that breadth fades, the advance becomes fragile. A rally driven only by mega-cap components (the generals) can stretch further, but with decreasing participation, it becomes increasingly vulnerable to shocks. Traders who watch intermarket behavior know this phenomenon as bearish divergence — higher highs in the generals, lower or flat highs in the soldiers.
From a practical standpoint, narrowing breadth implies that fewer sectors are carrying the index higher. In other words, the market’s engine is running on fewer cylinders. This is not a timing trigger on its own, but it is a powerful contextual clue suggesting that volatility could expand when the leadership stumbles.
3. Quantifying the Risk: Supports and Market Depth
Looking beneath price, Order Flow (UnFilled Orders) provides a sense of where liquidity may reside once the current rally pauses. Key UFO support zones, acting as potential demand clusters, reveal how far the market might travel before encountering fresh buy interest.
From this week’s open:
ES shows its next support roughly 5.26% below current levels.
NQ sits around 6.25% below.
YM’s cushion lies approximately 9.39% beneath.
RTY, however, faces a much deeper air pocket — the next notable UFO support sits nearly 13.99% lower.
This asymmetry is critical. If markets retreat, small caps have the most unprotected downside terrain before reaching meaningful support. In other words, the generals may fall back a few miles, but the soldiers could tumble down the hill.
These percentages don’t guarantee a move — they outline the potential amplitude of correction if risk-off flows accelerate. The deeper the distance to support, the larger the volatility zone beneath.
4. Strategic View: Large Caps Lead, but Are They Overextended?
The current setup puts traders in a classic tactical dilemma:
Are the generals inspiring a new advance, or are they overextended and exposed?
Two plausible scenarios emerge:
Continuation scenario: If the small caps (RTY) regain strength and take out their prior week’s high, the breadth gap could close. This would validate the generals’ move and reestablish a broad-based advance.
Correction scenario: If RTY continues to stall while ES, NQ, and YM fail to sustain their gaps, it would confirm a divergence-led weakening. A close back below prior week’s highs could trigger a retreat toward the support zones identified earlier.
The idea is not to predict a reversal, but to prepare a framework in case weakness unfolds.
5. Contract Overview: E-mini and Micro Versions
To analyze or engage these markets, traders can study both E-mini and Micro E-mini contracts listed on the CME. These contracts represent standardized ways to participate in U.S. equity index movements, but at different notional sizes.
E-mini contracts (ES, NQ, YM, RTY) are the long-standing institutional benchmark instruments that track major U.S. equity indices with efficient liquidity and tight spreads.
Micro E-mini contracts (MES, MNQ, MYM, M2K) provide the same exposure pattern at one-tenth the size, offering more granularity in risk management and flexibility for smaller accounts or precise hedging.
It’s important to understand that these futures allow directional and hedging applications without requiring ownership of the underlying equities. However, as with any leveraged product, margin requirements can amplify both gains and losses. Traders should familiarize themselves with margin-to-equity ratios and maintenance requirements before participation.
S&P 500 – ES / MES
Minimum tick: 0.25 points
Tick value: $12.50 (E-mini) | $1.25 (Micro)
Typical margin: ≈ $21K (E-mini) | ≈ $2.1K (Micro)
NASDAQ 100 – NQ / MNQ
Minimum tick: 0.25 points
Tick value: $5.00 (E-mini) | $0.50 (Micro)
Typical margin: ≈ $30K (E-mini) | ≈ $3.0K (Micro)
Dow Jones – YM / MYM
Minimum tick: 1 point
Tick value: $5.00 (E-mini) | $0.50 (Micro)
Typical margin: ≈ $13K (E-mini) | ≈ $1.3K (Micro)
Russell 2000 – RTY / M2K
Minimum tick: 0.10 points
Tick value: $5.00 (E-mini) | $0.50 (Micro)
Typical margin: ≈ $9K (E-mini) | ≈ $0.9K (Micro)
Please note that all margin requirements are approximate and may be adjusted.
6. Risk Management Spotlight
Breadth divergences can test patience and positioning discipline. Managing exposure becomes as important as analyzing the signal itself.
Here are three core reminders:
Position Sizing: Adjust to volatility. If the distance to the nearest support is wide, scale down accordingly to maintain a consistent risk percentage per trade.
Stop-Loss Discipline: Predetermine exit points based on technical invalidation, not emotion.
Capital Preservation: Capital is ammunition; running out of it limits participation when true opportunity returns.
In the end, risk management isn’t about avoiding loss; it’s about surviving long enough to thrive when clarity returns. When markets are divided between generals and soldiers, maintaining balance becomes a trader’s greatest edge.
7. Educational Takeaway
The “generals vs. soldiers” analogy reminds us that market structure is not just about price—it’s about participation. When large caps surge but small caps lag, it signals a potential exhaustion point in the broader advance. The healthiest rallies are those in which all troops move in sync.
For traders and investors, breadth divergences serve as an early-warning system, not a countdown clock. They encourage a review of exposure, tighter stop placement, and a shift toward risk-awareness rather than return-chasing.
At this stage, the technical setup across U.S. index futures reads like a fragile truce: ES, NQ, and YM maintain their gains above prior-week highs, while RTY still lingers below. Should the soldiers eventually follow, confidence could rebuild. But if the generals start retreating first, the path toward their UFO supports could unfold quickly.
The core takeaway: breadth divergences don’t predict timing—they illuminate imbalance. Recognizing that imbalance early allows traders to respond intelligently instead of react emotionally when volatility expands.
When charting futures, the data provided could be delayed. Traders working with the ticker symbols discussed in this idea may prefer to use CME Group real-time data plan on TradingView: www.tradingview.com - This consideration is particularly important for shorter-term traders, whereas it may be less critical for those focused on longer-term trading strategies.
General Disclaimer:
The trade ideas presented herein are solely for illustrative purposes forming a part of a case study intended to demonstrate key principles in risk management within the context of the specific market scenarios discussed. These ideas are not to be interpreted as investment recommendations or financial advice. They do not endorse or promote any specific trading strategies, financial products, or services. The information provided is based on data believed to be reliable; however, its accuracy or completeness cannot be guaranteed. Trading in financial markets involves risks, including the potential loss of principal. Each individual should conduct their own research and consult with professional financial advisors before making any investment decisions. The author or publisher of this content bears no responsibility for any actions taken based on the information provided or for any resultant financial or other losses.

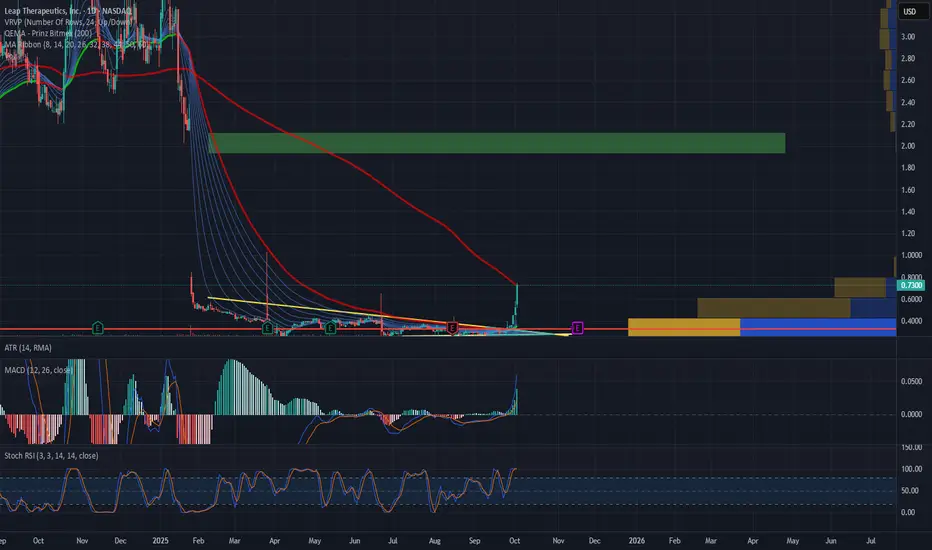
LPTX A Small Cap With Institutional Interest, Buy The PullbackI have held some options on this stock. Like all gems, I wish I had more invested. Hindsight is 20/20...
Leap Therapeutics (LPTX) currently presents a strong bullish narrative rooted in recent clinical, technical, and structural catalysts.
Clinical Data and Upcoming Catalysts
LPTX's lead drug, sirexatamab (DKN-01), continues to show promise in Phase 2 DeFianCe results for colorectal cancer, with a 32% higher overall response rate and a 3.5-month increase in progression-free survival for high-DKK1 patients—affirming its clinical relevance and market potential.
The company is poised to present final data at ESMO Congress on October 19, 2025, a major catalyst that has already fueled significant price and volume spikes in anticipation, with the options market reflecting extreme implied volatility as traders price in a potential breakout.
Additional pipeline advancement—most notably, FL-501 moving into clinical trials for cancer cachexia in 2026—offers long-term optionality and diversification of risk.
Technical Setup and Market Dynamics
LPTX has a relatively low float (around 33 million shares), which, combined with a recent influx in average trading volume and a short float of approximately 4.3%, creates a prime setup for outsized moves on positive news or momentum surges.
The stock is trading with aggressive options activity, particularly in November 2025 calls, indicating high market expectations ahead of clinical catalysts and event-driven volatility.
Institutions and funds own over 30% of the float, with notable net inflows over the past 12 months, suggesting smart-money accumulation during periods of weakness.
Structural Improvements and Resilience
Despite historical cash burn and workforce cuts, management has implemented cost-saving initiatives, extending their operational runway amid an improving clinical outlook.
LPTX recently received a compliance extension from Nasdaq until March 2026, removing near-term delisting risk and stabilizing the capital structure
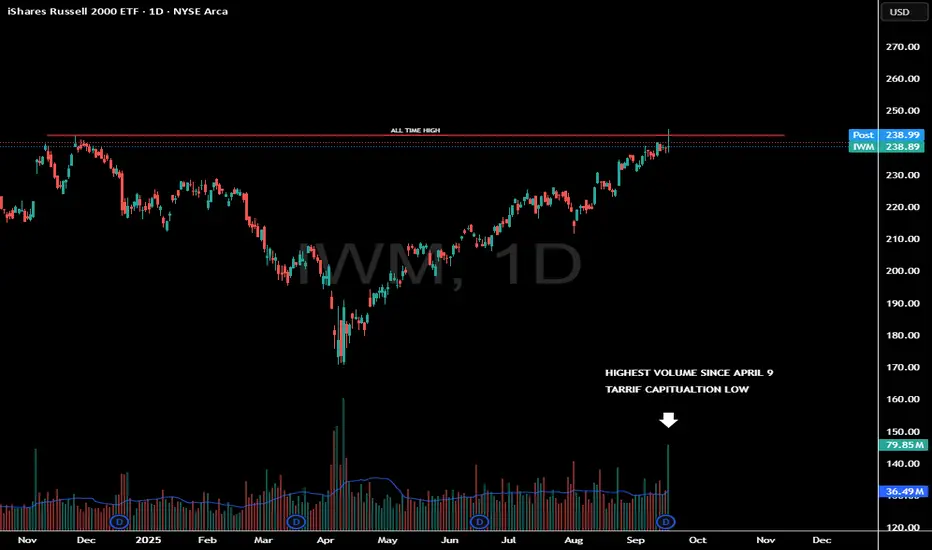
Highest Volume Candle Since Tarriff LowIWM saw a nasty reversal off the all time highs today.
A potential weekly topping tail is building.
What important about this reaction is the amount of volume that was traded.
This was the highest candle since April 9th.
High Volume reversals need to be monitored closely as it does show large money distributed into this strength.
A high volume candle marked the tariff bottom.
Will a high volume candle signal a near term top?
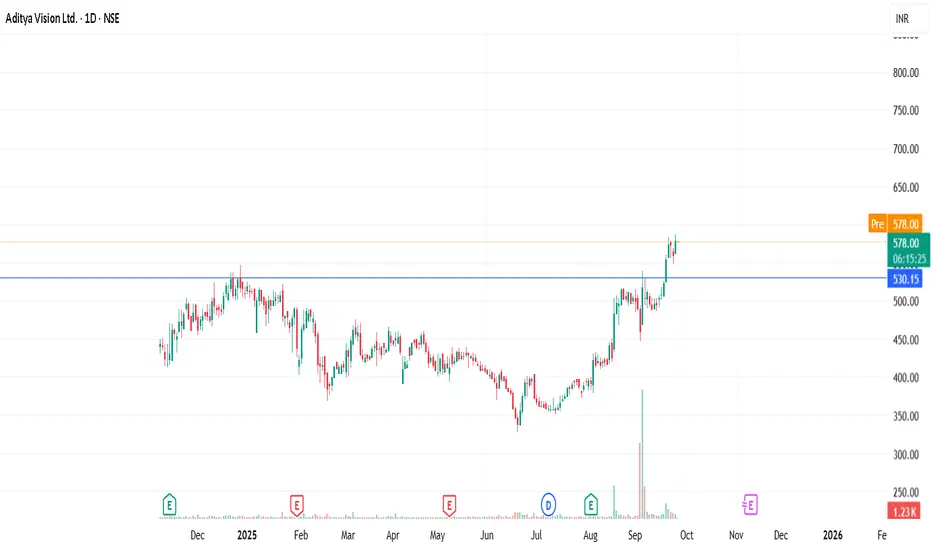
Aditya Vision Ltd. — Long Setup After BreakoutChart: Daily timeframe
Technical View
listing, the stock went through a long consolidation phase, forming a base.
Recently, price broke out above ₹530 resistance with strong volume, confirming institutional participation.
The breakout has been followed by healthy price action — higher highs & higher lows.
Volume during the breakout was significantly higher compared to the consolidation period, which adds conviction.
After breakout it is in consolidation zone.
Entry Zone: Around ₹560–580 (current breakout retest zone).
Long term target can be ₹700-800.
Stop loss is just below breakout line. Good risk reward ration stock.
This looks like a classic post-IPO consolidation breakout with volume confirmation. If retest holds, it offers a solid swing entry with favorable risk/reward.
Disclaimer:
This analysis is shared for educational and informational purposes only. It should not be considered financial advice or a recommendation to buy/sell any security. Trading and investing involve risks, and you should do your own research or consult with a qualified financial advisor before making decisions. Past performance does not guarantee future results.
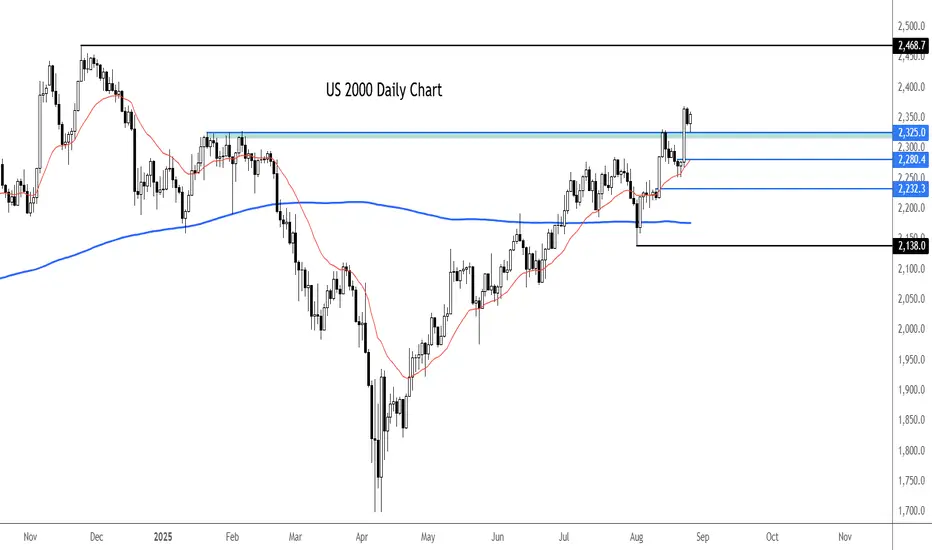
Russell continues to paint bullish PA for small capsSmall caps have surged higher in recent days as investors warm towards companies most exposed to the domestic US economy, in part thanks to rising expectations for interest rate cuts.
The Russell is also showing clean price action from a bullish point of view: breaking key levels and defending them. Once such level was around 2325 which it took out on Friday in response to a dovish Powell. That level has turned into support today after Monday's slight pullback. Though it is possible we could see a break below this level and for the index to test longer term levels, that wouldn't necessarily be the end of the bullish run. Below this level, the next support to watch is around 2280 followed by 2232.
Resistance is now seen around round handles like 2,400 and the previous high of 2468. That could be the target for the bulls from here.
By Fawad Razaqzada, market analyst with FOREX.com
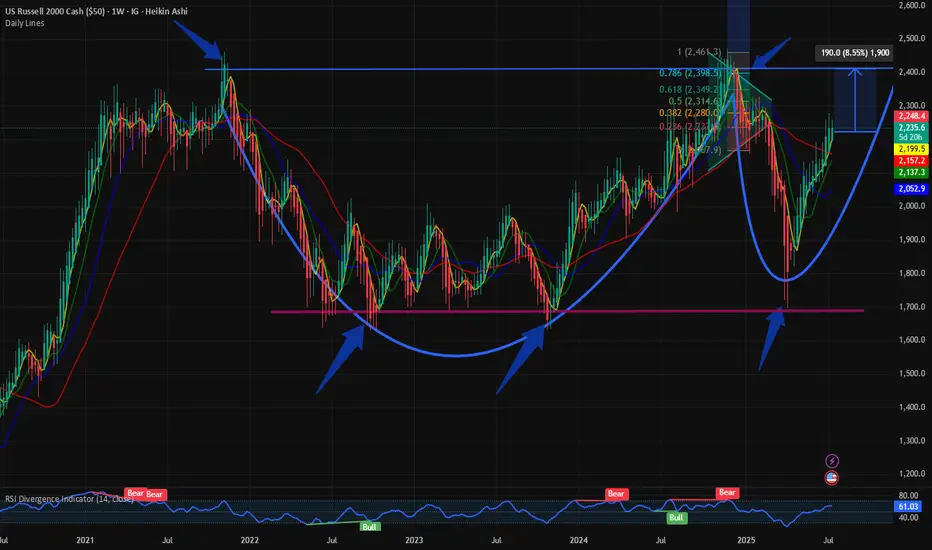
$RUSSEL: Completion of Cup and Handle formation or higher?The small cap index $RUSSEL has had a good past couple of months and has bounced back from its lows. We visited the small cap index on May 1st when we identified the trend reversal. The $RUSSEL was in the recovery mode after the Liberation Day capitulation.
IG:RUSSELL in a bounce back mode. But upside is capped @ 2400 for IG:RUSSELL by RabishankarBiswal — TradingView
This cup and handle pattern is still on hold, and I also predicted that the upside is capped @ 2400. Currently the $RUSSEL is @ 2222.
So how much upside can we expect from here with TVC:DXY making new lows? My assumption is that $RUSSEL will fail to break above 2400, and the handle part will not break out of the reverse neckline. So, the upside in the small caps is capped @ 2400 which seems to be a major resistance indicating a 9% upside from here.
Verdict : $RUSSEL Cup and handle pattern nearing completion. 2400 is the upper resistance. Still some more room to run.
$IWM is set for a Blow-Off Top - 34% UpsdieAMEX:IWM is about to have a blow-off top moment!
Catch up mode engaged...
- Breakout of downward trend
- Volume shelf launch
- Rate cuts inbound
- Suppressed for 4 years
PTs: $244/ 259/ 276 (MM)

$VKTX Gann VKTX has a beautiful symmetry. Ones it breaks the next arc, it will gravitate to the next one!
