IS ELF BEAUTY FINALLY BOTTOMING OUT?! LET'S SEE!NYSE:ELF is at a key S/R zone and has shown buyers will step in well before this thing try's to dip under $100! That's great news as that gives us a great risk/reward ratio area!
MACD, RSI, and the Stochastic are all starting to curl upward off the bottom, indicating the start of a bottoming reversal. My trade setup and execution details are below. Not Financial Advice.
Entry: $118 Break
PT1: $152
PT2: $175
Final PT: $220
S/L: Break below $100 at $97.72.
Smallcaps

$SOUN :Is Sound Hound AI the next small cap to SURGE?! 98% move!NASDAQ:SOUN
Is Sound Hound AI the next small cap to SURGE?!
I believe this stock is gearing up for a 98% move higher! So, let's dive into my video below, which talks about the NASDAQ:SOUN stock charting setup for a SURGE to the upside and how it meets my 5/5 trading setup! (My personal trading strategy)
Not financial advice.
Like ❤️ Follow🤳 Share 🔂
Comment what stock you want to see charting analysis on below.

ALTCOINS TOTAL3 Altcoins have struggled in the last 5-6 months since BTCs slowdown.
Some alts are down 80% from their highs but are now displaying a promising pattern for the bulls. The chart shows the daily support that intersects 3 points that make a head and shoulders pattern. This H&S pattern is an important reversal structure that if gets completed would signify the bottom of the downtrend and the beginning of an uptrend.
Since this H&S reversal TOTAL3 has flipped the 1D 200EMA and is now at diagonal resistance. Should this resistance be broken and accepted above as well as the WEEKLY S/R then the next target is DAILY RESISTANCE. This would be great for smaller can alts especially the newer projects that have not experienced a Bullrun yet.
In terms of a trade setup. I would place an SL below the local low as this would be a trend break and could signify a further sell-off.
Take profits @ DAILY RESISTANCE, $720B & $780B.

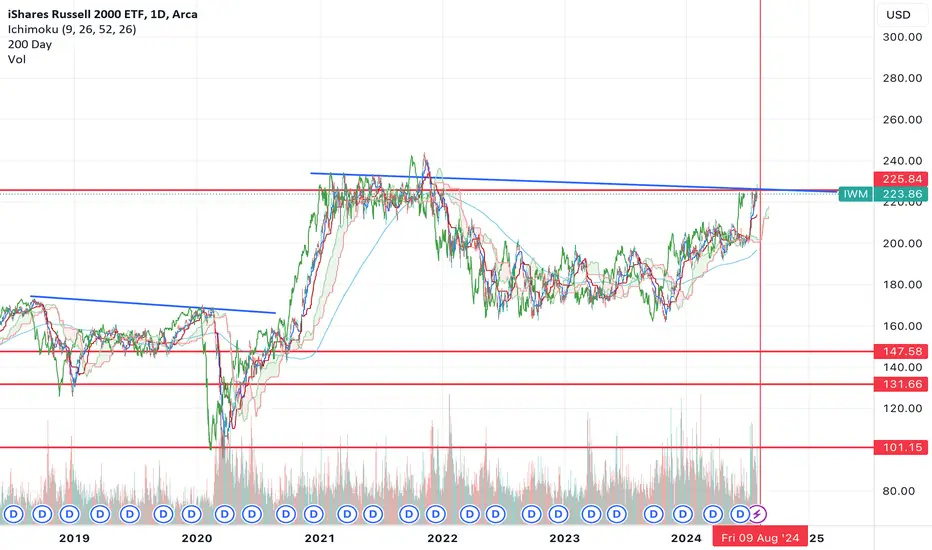
Russell 2000 On verge of breakoutof a continuation inverse head & shoulders
these projections are IMHO likely to be the final nail in the coffin for this massive bull run
one of the complaints from Analysts is the lack of breath in the market
well when the russell reaches these projections
these analysts will likely claim victory and say see NOW we have a real bull market
which is when you should be seeking shelter as when the last bears are bullish it means there is no one left to convince.
And after 16 years from the 2009 bottom would be a fitting end to the secular bull
With a Trump victory likely ..
The Dems will in all likelihood prefer to leave him a big mess to clean up than a booming economy.

$IWM $RTY : Small Caps Ready to Explode! 💥 Small Caps Ready to Explode! 💥
We will be at ATH's this week: AMEX:IWM AMEX:TNA CAPITALCOM:RTY
While everyone is buzzing about NASDAQ:TSLA CRYPTOCAP:BTC and how they will continue to skyrocket if election results stick and continue to favor Trump, no one’s talking about SMALL CAPS! Remember, during his last term, small caps had an impressive run. Let’s dive into the technicals in my latest video.
In this video, we cover:
1️⃣ Technical Analysis: We’ll analyze charts and multiple indicators, all pointing to AMEX:IWM heading HIGHER. 📈
2️⃣ Patterns: A massive multi-year cup and handle pattern with an ascending triangle breakout is in play.
Drop a comment below if you learned something new or want to explore any topics further.
Stay tuned for more insights and show some love!
LIKE | FOLLOW | SHARE
CAPITALCOM:RTY AMEX:IWM AMEX:TNA
NFA

Mid/Smallcap || Recovery As Expected, What now? The Midcap and Small Cap Index have shown signs of recovery as anticipated in my previous analysis. The index is now trading above the 20 EMA Band in the 2-hour timeframe (TF). However, several key conditions must still be met before we can confirm a sustained bull run:
1. 2-hour RSI should cross above 75 to signal strong upward momentum.
2. Daily timeframe (DTF) RSI needs to exit the Bear Zone.
3. NIFTY50 is still awaiting confirmation to move out of the Bear Zone, which would provide broader market support.

$QS : A QUANITIFIED SWING SETUP! 80%+ MOVE LOOMING! NYSE:QS A QUANITIFIED SWING SETUP! 👊
NASDAQ:TSLA DEAL INBOUND?!
3 Reasons Why in this Video: 📹
1⃣ My "High Five Trade Setup" strategy
2⃣ Catalyst: #QuantumScape started shipping Battery cells to carmakers and had price target increased to $7
3⃣ Symmetrical Triangle Breakout (MM: 80%+)
Company Overview:
QuantumScape Corp, a company focused on developing next-generation battery technology for electric vehicles (EVs) and other applications.
Video analysis 3/5 dropping today. Stay tuned!🔔
Like ♥️ Follow 🤳 Share 🔂
Are they gonna be a batter cell goliath in this space?! Comment below if you are a believe in NYSE:QS
Not financial advice.
AMEX:IWM NASDAQ:QQQ AMEX:SPY NASDAQ:TSLA NASDAQ:IBRX NASDAQ:UPXI NASDAQ:WULF #ElectricVehicles #TradingSignals #TradingTips #options #optiontrading #StockMarket #stocks

Russell 2k looks very good, even with rising YieldDaily
The TVC:RUT looks okay, slowly grinding higher.
Spreading the chart out, it's still forming the, usually bullish, Inverse Head & Shoulder pattern.
Had this on a daily & weekly but the chart we see here is for the monthly (see profile for more info on where to get more data)
it is easier to see the pattern on the Weekly chart. Interesting.
However, we see something interesting on a monthly.
Monthly it looks similar to 2008 to 2010
AMEX:IWM

$CHSN Short signal (my trading dairy)I will short trade NASDAQ:CHSN today if it started to rise after open, here is my reason:
1. Market maker sold out:
the price reached the resistance level from previous high with high volumes, which means half shares of the market cap has already sold. personally, i think those sold shares belong to the market maker.
2.Negative news:
SEC has ordered a suspension of trading in the company's securities on Oct 9, 2024 due to price manipulation activities.
3.Huge remained short volume
Compared to the volume and daily short volume of Oct 4th, Oct 7th, and Oct 22th, we could discover there is huge remained short volume.
Therefore I will short trade it tonight if it follow my expectation.

AMBER ENTERPRISES-Weekly Breakout with Strong MomentumBreakout Confirmation: Amber Enterprises has given a decisive breakout above the crucial Fibonacci 23.6% level (₹5,206), with a significant price surge. This breakout was accompanied by heavy volume , indicating strong bullish momentum and participation.
Fibonacci Levels:
The stock retraced from its highs at ₹6,256.7, respecting the Fibonacci levels:
38.2% retracement at ₹4,557.35.
50% retracement at ₹4,032.40.
61.8% retracement at ₹3,507.50, which acted as a strong support before the stock resumed its upward movement.
The breakout above ₹5,206 now opens the path towards the previous highs around ₹6,256.7.
Bullish Trendline Support: The stock has been respecting an ascending triangle pattern, marked by higher lows, which reflects accumulation and strengthening of the uptrend. The recent breakout from this triangle pattern gives further bullish confirmation.
Targets Ahead:
Near-term target : Based on the breakout and the height of the triangle, the immediate target is around ₹6,256, which aligns with the 0% Fibonacci level.
Potential upside projection : Using the measured move from the breakout, the stock has a potential to reach ₹6,900-7,000 levels, reflecting a 30-40% upside from the breakout point.
RSI Momentum : The RSI has broken above the 70-mark, entering the overbought zone, which confirms strong bullish momentum. However, the overbought condition may suggest some consolidation in the short term before the next leg up.
Support Levels : On any pullback, strong support lies around the Fibonacci 38.2% level at ₹4,557.35, followed by ₹4,032.40 (50% level). As long as these supports hold, the overall trend remains bullish.
Conclusion : Amber Enterprises is showing a powerful breakout with high volume, indicating a potential bullish rally in the coming weeks. Traders can look for opportunities on pullbacks or momentum continuation above ₹5,500, with a near-term target of ₹6,256 and a possible extension towards ₹6,900.

Aleph Zero - A smallcap gem for the Altcoin season!Welcome to another analysis, where I dive into the latest developments with Aleph Zero and explore the potential paths ahead.
With over 8 years of experience in crypto trading, I use the best strategies I've learned to actively manage my portfolio and carefully select coins for optimal long-term gains. We all want to buy low and sell high, and Aleph Zero has been on my watchlist for a while. Now, we're seeing a potential break from this long downtrend, making it time to pay closer attention.
Fundamentals: Aleph Zero currently sits at a $100M market cap. The project boasts a solid team, ongoing development, and a fast blockchain, focusing on privacy-oriented products across multiple verticals—from DeFi applications to gaming and enterprise solutions. As we approach the upcoming altcoin season, its emphasis on scalability and privacy creates a compelling opportunity.
In an era where data security and user privacy are paramount, Aleph Zero’s advanced features allow users to transact without compromising personal information. This enhances user trust and aligns with increasing regulatory demands for data protection. The platform’s unique combination of DAG (Directed Acyclic Graph) technology and a speed-oriented consensus mechanism positions it well for mass adoption. Additionally, the growing development team and community signal a strong foundation for future growth. As investors seek innovative solutions to meet rising demand, Aleph Zero could emerge as a hidden gem worth watching.
Technical: Aleph launched its blockchain in early 2022 and has navigated a bumpy ride through this bear market. After reaching an all-time high of around $3, it has since dropped to approximately $0.40. Following an initial downward move, Aleph saw a pump before experiencing a second decline, testing the first major trendline we broke out of. We’ve now held that trendline as support and set a higher low in the short term. We are currently battling the second move trendline; a breakout could signal another strong leg up.
While it's too early to definitively call the bottom, the current price action looks promising with rising volume. If we perform a full Fibonacci extension up to the 3.618-4.236 levels, we could see a solid 20X return on our investment. I've analyzed numerous projects and charts, and I believe those with a strong fundamental foundation will perform best in the upcoming altcoin season. The BTC dominance chart is also facing heavy resistance, suggesting a favorable environment for altcoins to shine.
I will keep updating as Aleph Zero moves into a better buy zone. I’m looking to buy after a breakout of the downward trendline when we re-test.
Thanks for reading! Good luck with your trades, and make sure to follow me on TradingView and X:@PuppyNakamoto for more updates and analysis as we move forward.

XSO and Interest cutsIt's easy to get caught up in all the hype around interest rate cuts and thinking of all the money that will start flowing back into smaller caps and risk assets in general. Taking a look back at the 3 previous periods of easing rates, we can see that this isn't necessarily the case.
This graph is overlaying US cash rates as I believe it's a bit of an early indicator, AUS cash rates will typically follow suit but potentially after markets have peaked. Whilst I do believe that low interest rates are good for small caps, it can clearly be a painful decline before the next leg up. These dips in the market do appear to be bottoming out quicker and quicker but this is mainly due to cash stimulation by the government, ultimately leading back to more inflation.
I don't rule out that this time could play out slightly differently, however it's also never bad to mitigate risk and have appropriate risk measures in place.

M2K: SmallCap May Get a Big Lift with Rate Cuts UnderwayCME: Micro E-Mini Russell 2000 Futures ( GETTEX:M2K )
Global financial market orbits around Federal Reserve’s interest rate decisions. Hiking interest rates means monetary tightening while cutting them signals easing.
In the past three years, we have witnessed a full cycle of Fed hikes and now its reversal.
• In March 2022, as inflation rose rapidly, the Fed started a series of rate increases, pushing the Fed Funds rate up by 525 basis points from 0-0.25% to 5.25-5.50%.
• In September 2023, after 11 consecutive rate hikes, the Fed put the brake on. It kept the Fed Funds unchanged for a full year in eight FOMC meetings.
• Last Wednesday, the Fed finally entered the long-awaited rate cut cycle. It slashed interest rates by a supersized half point, or 50 basis points, in its first cut since 2020.
According to the Bureau of Labor Statistics (BLS), the latest reading of headline CPI is 2.5% in August, down 6.6% from its peak in July 2022. We may conclude that the Fed has largely completed its mission of combating inflation.
The BLS data shows that the U.S. unemployment rate has risen to 4.2% in August 2024 from 3.6% two years ago in August 2022. Fed’s easing signals its pivot to the second mandate, to support full employment. Lowering interest rates could reduce borrowing costs, and in return help business expansion and employment.
Russell 2000: SmallCap may get the biggest Boost
The discounted cash flow (DCF) model estimates the present value of an investment based on its expected future cash flows. A lower cost of capital (CoC) shall cause the price of the investment to go up, other things equal.
Small companies would gain the most compared to larger corporations. In the preceding rate hike cycle, they were hit hard as credit standards got tightened and credit spreads expanded. We will now see the reversal.
Russell 2000 is the benchmark stock market index for US small companies. CME Micro E-mini Russell 2000 futures ( GETTEX:M2K ) were settled at 2,252.6 on Friday, up 10.05% year-to-date.
For a comparison, the S&P 500 gained 19.50% YTD as of Friday, while the Nasdaq 100 was up 17.59%. In my opinion, the major stock indexes rose on the back of the AI-driven technological breakthroughs, where Big Tech dominated but few Small Cap companies could benefit. In this new cycle, lowered borrowing costs and the abundance of credit could help small businesses improve their balance sheets.
The Fed is expected to continue cutting rates in the next two years. Corporate bond yields could likely return to the 2-3% range. The credit spreads, including Baa-Bbb, Baa-Bb, and Baa-Ccc, would likely get smaller. This could bring further boost to the Russell index.
Could we quantify the impact of rate cuts? Let’s illustrate this with a $1 million payment, to be received in five years.
• Applying the BBB corporate bond yield of 4.88% as the CoC, present value of $1 million will be $788,019.
• If the CoC moves down by 250 bps to 2.38%, the PV will be increased to $889,046.
• This shows that a 2.5% reduction in CoC could boost the PV by 12.8%.
The same concept would work on the Russell index. CoC could drop either due to interest rate decrease or because of the narrowing of credit spread, which favors smaller companies. The result would be an increase in the market value of Russell component companies.
For someone with a bullish view of the Russell 2000, he could establish a long position in CME Micro E-mini Russell 2000 futures. The contract has a notional value at $5 times the index. At Friday closing price of 2,252.6, each December contract (M2KZ4) is worth $11,263. CME Group requires an initial margin of $760 for each M2K contract, long or short.
The Fed will next convene on November 5th-6th and meet one last time in 2024 on December 17th-18th. In my opinion, if the Fed continues lowering rates in these two meetings, Russell 2000 could likely move up further.
Hypothetically, if the Russell is 5% higher by December, the 113-point increase would translate into $563 (=2252.6*0.05*$5) gain per contract for the long holder.
The risk of long futures is the index going down. If inflation spikes unexpectedly, the Fed could possibly pause its rate cuts, casting doubt on the future rate trajectory. For more experienced traders, put options on the E-Mini Russell 2000 futures could be deployed to hedge the downside risk.
Happy Trading.
Disclaimers
*Trade ideas cited above are for illustration only, as an integral part of a case study to demonstrate the fundamental concepts in risk management under the market scenarios being discussed. They shall not be construed as investment recommendations or advice. Nor are they used to promote any specific products, or services.
CME Real-time Market Data help identify trading set-ups and express my market views. If you have futures in your trading portfolio, you can check out on CME Group data plans available that suit your trading needs www.tradingview.com

DigitalOcean ($DOCN) | Cloud Computing Powerhouse - AWS for SMBsNYSE:DOCN
DigitalOcean remains the only pure cloud computing company for small-to-medium-sized businesses (SMBs), offering a robust solution similar to AWS, but with a specific focus on cost-effectiveness and ease of use for smaller enterprises. The introduction of GPU droplets further strengthens its position in the market, catering to the growing need for AI and machine learning workloads.
Despite struggles with corporate governance, the company’s technology is top-tier, making NYSE:DOCN an attractive acquisition target for larger tech players. The stock has doubled in volume recently, indicating bullish momentum is building, and we believe this sets up for a breakout.
This is a long-term hold for those looking for high growth in the cloud sector. GPU droplets could accelerate this growth, positioning DigitalOcean as a critical player in a market poised for massive expansion. It is not too late to enter as we are just beginning to breakout. Should macro-driven events pull down the market, especially SMBs, we will be adding at key levels.
Our entries: $24.50, $31.50, $35, Breakout over $39
Targets: $50, $70, $80
DigitalOcean is not just a small player in the cloud space; it has a specific niche that positions it for explosive growth. As SMBs increasingly adopt cloud technologies, and with GPU droplets creating a new revenue stream, DigitalOcean is set to rise. While near-term volatility exists, the long-term growth story remains intact. Investors should look at this as a multi-year play, with opportunities to accumulate during any market weakness.

$JMIA | First on the Scene, Aiming for 5x-10x BaggerNYSE:JMIA
Jumia, often referred to as the "Amazon of Africa," presents a unique opportunity for long-term investors to tap into the rapidly expanding e-commerce landscape in Africa. Our analyst, Shay Boloor, was one of the first analysts to recognize its potential, and while the company has faced challenges, the long-term thesis remains intact. We have been scaling into position between $3.50 and $4.50 as well as adding Jan 2026 $5 Calls. Trading under $5, this is a steal for investors willing to endure the volatility that comes with small caps in an emerging market. For those with patience, the reward could be substantial, with the potential for a 5-10x return over the next five years.
Key Strengths and the Opportunity:
Capital Strength: Jumia has raised $200 million in capital, significantly reducing solvency risk, which now stands at near zero. This financial cushion provides the company with the flexibility needed to continue its strategic growth.
Long-Term Play: The stock might take time to reflect its true value as the narrative shift, much like we saw with companies like Snowflake and Unity Software, unfolds. Jumia's expansion will need time, but the thesis remains unchanged.
Small Position Allocation: Due to the inherent volatility of small caps, Jumia is a small position. However, it offers massive upside potential for those who can ride out the short-term fluctuations.
Market Context and Timing: We are currently in a phase of seasonal market weakness, where investors shift focus toward large-cap, defensive stocks. This shift makes small caps like Jumia more volatile and higher-risk in the near term. However, for the long-term investor, this is the moment to accumulate a position while others stay on the sidelines.
Range to Watch:
$5.40 to $14: This initial range represents the next key resistance levels as Jumia works its way up.
$14 to $21: Liquidity zone where price can move quickly.
Above $21: Should the stock break above this level, expect significant movement with liquidity zones extending to $27, $33, and potentially $40+.
This stock has remained a high-conviction play. Although Jumia remains a volatile stock, it is well-positioned to capture long-term growth in the African market, making it an excellent buy-and-hold for patient investors looking to capitalize on the next big e-commerce wave. This is a prime opportunity to snag the bottom for the next run-up.

US2000 Selloff | Small Caps Looking FrailLot's going on in this picture, my apologies for all the noise.
Consistent with the overall market and recently published indexes, I am looking for more downside in US Domestic small-cap stocks.
If you thought or if you were influenced that this inflation bubble economy would persist forever, I advise you consider a different source of information. "Do your own research" does NOT mean, go find something that agrees with your preferences.
Rather, #DYOR as the kids say, is an opportunity for individuals and teams alike to look deep within themselves and ask if they have what it takes to achieve: honesty, humility, and truth.

IWMTheory is we have another leg higher to IWM here before we submit to the C wave on the very HTF cycle wave 4. I suspect this will be an expanding flat and wave B will hit close to $260-$300 before wave C runs all the wave back down to $110 finishing the 4th. Then we start the HTF wave 5 to $450-$600 per share

Russell may rock n’ roll on rate cut and soft landing hopesRussell 2000 futures sit on uptrend support, making Friday’s close important following Jerome Powell’s speech at Jackson Hole.
To get excited about US small caps, you need a soft economic landing and lower borrowing costs given many of its constituents are unprofitable and reliant on capital markets. Given Powell will discuss rate cuts and flag confidence in the Fed’s ability to stick a soft landing, it comes across as recipe for upside.
With the uptrend nearby, traders could initiate longs around these levels or even a touch lower with a stop loss below the level for protection. Should the price break 2186.4, there’s little in the way of visible resistance until the record highs.
If the trade works in your favour, consider raising you stop to entry level or higher, providing a free hit on upside. Good luck!
DS

Was that it for $IWM? Do we correct before the real run?While I do think that IWM is the place to be over QQQ , I think this run has gotten a little ahead of itself.
I noticed something interesting today on the chart, if you look at it on the 6hr or 4hr, you'll noticed we tried to break above resistance on the 9am candle, and rejected hard back below it.
This leads me to believe that the next move from here is actually down, not up.
If we zoom out, the chart looks extremely similar to how it did before the covid crash. We formed a high, went down and v bottomed up into what looked like a breakout (Feb 2020), but instead formed a double top and then rolled over hard.
Now we've pretty much made the same move, we formed a high in 2021, corrected, v bottomed in Oct 2023 and now we're at the exact level where a double top could take place from the high that was formed in Jan 2022 before price broke down.
So will we have another covid style crash that brings price back to $150 or lower? TBD, but I have that feeling...
Small Caps Dead?AVUV from Avantis has outperformed the S&P since its opening in 2020. It recently dipped below the S&P for a brief moment before skyrocketing back above it. AVUV is not strictly a small cap fund because screens for value, profitability and momentum exposure. The recent surge in small caps has shown that diversified exposure to equities factors not present in the S&P 500 can be beneficial for those investing with long time horizons. Choosing funds with higher expected returns like AVUV might be difficult when the Mag 7 is driving the market, but you'll be very happy with your portfolio at times like this.

Navigating Frothy US Equities with S&P SpreadsNavigating frothiness in US equities requires both caution and tact. With the S&P 500 nearing its all-time high amid flashing recession signals, investors must be vigilant with volatility during upcoming earnings season, driven by outsized expectations.
This paper explores the persistent recession indicators and forces at play during upcoming earnings. The paper posits a spread trade using CME’s Micro E-Mini futures (Long S&P 500 and Short Russell 2000) to maintain upside potential with reduced downside risk.
RECESSION RISKS PERSIST AS RATES REMAIN HIGH
On Friday, the PCE Price Index (Fed’s preferred gauge) showed inflation cooling to 2.6% in May, in line with expectations. Price pressures are slowly abating.
Numbers aside, the broader economic landscape presents a complex picture.
Signals from the job market point to unemployment claimants at a record high for the past two and a half year with job openings shrinking drastically. Personal earnings were higher than anticipated in May (0.5% vs 0.4%), but spending was below expectations. Consumers are being more cautious. Mint Finance covered these nuances in a previous paper .
Housing is flashing weakness as new housing starts hit a four-year low in May. Soaring prices and steep mortgage rates are weighing on demand.
The Fed’s policy path remains unconfirmed. However, consensus point to a rate cut as early as September. Even if that happens, rates are expected to decline gradually.
Source: CME FedWatch
Despite risk of recession, the S&P 500 has had an exemplary showing this year, trading near their all-time high. YTD performance of 15% in 2024 has been far higher than the 74-year average of 4%.
Yet, the performance has been increasingly top-heavy. Nvidia, Apple, and the rest of the tech titans have contributed much of the gains in the broad S&P500 index as it is market cap weighted. The index is heavily reliant on and sensitive to the performance of these mega-caps.
The equal-weighted S&P 500 index is up only by 4% in sharp contrast. The spread between the S&P 500 and its equal-weighted counterpart is near its highest point since 2008. The spreads between the S&P 500 and both the Russell 2000 and S&P Midcap indexes have reached multi-decade highs.
Outperformance was re-affirmed after the recent earnings season. Mega-caps crushed EPS and revenue expectations and reported phenomenal guidance while other stocks, especially utility and energy sector reported revenue and EPS figures below estimates according to FactSet report .
Rallies in mega-cap stocks are being driven by idiosyncratic tailwinds, such as advancements in AI. Meanwhile, slowing consumer spending in the US is raising concerns for the broader market.
RISK OF SHARP CORRECTION WARRANTS SPREAD POSITION
According to FactSet , Q1 earnings season was positive. Only 19% of firms reported earnings below expectations. Actual average EPS YoY growth for the index was 5.9% (above 3.4% expected as of March 31).
Frothiness in the equity market is palpable. Consistent outperformance by mega caps is baked into investor expectations. Strong earnings are already factored into prices, as evidenced by the S&P 500's P/E ratio of 28.38x (far higher than the 10-year average of 20x translating to a 42% above average earnings expectations). Average P/E ratio in the best performing tech sector is even higher at 37.47x.
Even minor shortfalls in guidance or revenue/earnings can lead to significant corrections in such a climate. The FactSet reports that 31.8% of firms which beat earnings EPS estimates by up to +5% saw average price decline of -0.9%.
Source: FactSet Research
In fact, overall, positive earnings only drove a 0.9% increase in price (1% 10Y historical average) while a negative earnings report led to 2.8% drop (-2.3% 10Y historical average).
Source: FactSet Research
Market frothiness elevates risk of a sharp price correction in single names during Q2 earnings. Analysts are concerned as expectations for Q2 EPS YoY growth have been lowered from 9% on 31/March to 8.8% as of 22/June.
Despite this, mega-caps remain in solid position. Robust demand for AI, buoyant advertising revenue, globalized revenue streams, and substantial market dominance have positioned them to continue growing at a disproportionate rate.
In case the upcoming Q2 results pan out similarly to Q1 in favor of mega-caps, the S&P 500 will continue to outperform the broader market indices.
HYPOTHETICAL TRADE SETUP
The S&P 500, with its high concentration of mega-cap stocks, is likely to perform better than broader market indices in the coming earnings season. However, recession signals are also flashing.
The S&P 500 does not perform well during recessions. Over the last four recessions, it has declined an average of -14%. Comparatively the spread between S&P 500/Russell 2000 spread has increased 1.7%.
The S&P 500/Russell 2000 spread has also outperformed during the six-month preceding recessions.
Given the S&P 500-Russell 2000 spread's historical outperformance during recessions, a spread position presents less downside risk compared to an outright long position in the S&P 500.
This strategy also maintains a bullish outlook on the top-heavy S&P 500's potential to outperform in the upcoming season.
Moreover, the spread trade preserves the upside potential in the ongoing rally, as its performance has been comparable to an outright long position in the S&P 500.
A view on the spread between the S&P 500 and Russell 2000 can be expressed using CME Micro E-Mini Equity futures. At 1/10th the size of the full-size E-mini futures, the Micro contracts allow for smaller trades with more granular exposure.
A long position in the Micro E-Mini S&P 500 futures expiring in September (MESU2024) can be offset by a short position on 2 x Micro E-Mini Russell 2000 futures expiring in September (M2KU24). This position is highly margin-efficient as CME offers margin credit for this spread.
Hypothetical trade set up in summary requires entry at 2.69x, with a target at 2.78x coupled with stop loss at 2.6x.
The simulated payoffs are described below.
MARKET DATA
CME Real-time Market Data helps identify trading set-ups and express market views better. If you have futures in your trading portfolio, you can check out on CME Group data plans available that suit your trading needs www.tradingview.com
DISCLAIMER
This case study is for educational purposes only and does not constitute investment recommendations or advice. Nor are they used to promote any specific products, or services.
Trading or investment ideas cited here are for illustration only, as an integral part of a case study to demonstrate the fundamental concepts in risk management or trading under the market scenarios being discussed. Please read the FULL DISCLAIMER the link to which is provided in our profile description.

CVNA continuationCVNA is looking like a solid continuation setup. Strong earnings gap, then pullback to trend seems to be a pattern with this name similar to the other circled areas.

#HEG ltd Cup & handle pattern 20-30% upmove dega kya?HEG ltd cmp 1882, market cap 7264 cr, company is leading manufacturer and exporter of graphite electrodes.
PE vs ROCE ratio is better as compared to another leading player graphite India. My concern is the fall in Operating margin trend. Holding% Dec'23 promoter 55.77( 59.62 Mar'21), FII 6.85(9.43 Mar'21), DII 8.85(7.41 Mar'21). Infact some new mutual fund players entered in feb'24 also so Mar'24 DII numbers should be up.
Technically the chart is making cup n handle kind of pattern on weekly time frame and breakout above 1931 can bring fast movement. Upside levels can be 1)2335 2) 2470 3) 2575 4) 2763(imp level) 5) 3108. Once 2763 is crossed I will bring sl of remaining qty at 2470 and try to ride the trend till 3661/4557.
