GBP-AUD Long From Support! Buy!
Hello,Traders!
GBPAUD taps into horizontal support, clearing sell-side liquidity. Buyers step in at discount, suggesting a reaction toward 2.0414 as price seeks to rebalance inefficiency left above.Time Frame 3H.
Buy!
Comment and subscribe to help us grow!
Check out other forecasts below too!
Disclosure: I am part of Trade Nation's Influencer program and receive a monthly fee for using their TradingView charts in my analysis.
Smartmoneyconcept

NZD_USD BEARISH BREAKOUT|SHORT|
✅NZD_USD price breaks key support zone, confirming bearish orderflow. Smart Money shows breakout with liquidity run, targeting lower demand near 0.5810 as sellers take control after structure shift.
SHORT🔥
✅Like and subscribe to never miss a new idea!✅

EUR-USD Support Below! Buy!
Hello,Traders!
EUR-USD price sweeps liquidity below demand, tapping into discount zone. Smart Money expects reversal with bullish orderflow targeting 1.1755, aligning with structure shift and mitigation of imbalance.
Buy!
Comment and subscribe to help us grow!
Check out other forecasts below too!
Disclosure: I am part of Trade Nation's Influencer program and receive a monthly fee for using their TradingView charts in my analysis.

GBPUSD overhead supply keeps pressure, downside targets in focusGBPUSD once again tested the main supply zone around 1.3740, from where the market has repeatedly reversed lower. On the daily chart, the pair shows a series of lower highs, and the close below local support signals growing seller pressure.
The first downside target is near 1.3350, where initial profit-taking may occur. The next area is 1.3175, a stronger support level established earlier in the year. If bearish momentum develops further, 1.2900 becomes the key downside target to watch.
From a fundamental perspective, the pound remains under pressure due to Bank of England policy uncertainty, weak UK economic data, and the relatively hawkish stance of the Federal Reserve supporting the dollar. As long as the market trades below 1.3740, the bias remains toward the downside.

NZD_JPY FREE SIGNAL|SHORT|
✅NZD_JPY is going down currently
As the pair broke the key structure level around 86.600
Which is now a resistance, so we are bearish
Biased and therefore we can enter a following short trade:
Entry: 86.500
Stop Loss: 86.700
Take Profit: 86.100
SHORT🔥
✅Like and subscribe to never miss a new idea!✅

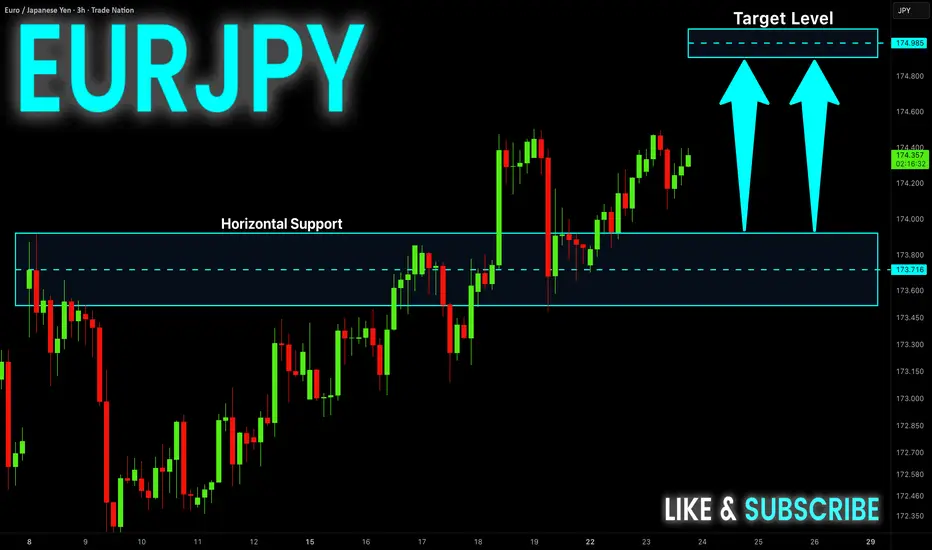
EUR-JPY Will Keep Growing! Buy!
Hello,Traders!
EUR-JPY is trading in an
Uptrend and the pair is
Already making a nice
Rebound from the horizontal
Support level of 173.800
So we are bullish biased and
A further bullish move up
Is to be expected
Buy!
Comment and subscribe to help us grow!
Check out other forecasts below too!
Disclosure: I am part of Trade Nation's Influencer program and receive a monthly fee for using their TradingView charts in my analysis.
EUR_AUD GROWTH AHEAD|LONG|
✅EUR_AUD is going down now
But a strong support level is ahead around 1.7800
Thus I am expecting a rebound
And a move up towards the target of 1.7923
LONG🚀
✅Like and subscribe to never miss a new idea!✅

EUR-GBP Will Grow! Buy!
Hello,Traders!
EUR-GBP is trading in an
Uptrend and the pair is
Going down to retest
The horizontal support
Around 0.8709 so after
The retest we will be
Expecting a further
Bullish move up
Buy!
Comment and subscribe to help us grow!
Check out other forecasts below too!
Disclosure: I am part of Trade Nation's Influencer program and receive a monthly fee for using their TradingView charts in my analysis.

DXY LOCAL LONG|
✅DXY is going down to retest
A horizontal support around 97.200
Which makes me locally bullish biased
And I think that we will see a rebound
And a move up from the level
Towards the target above at 97.440
LONG🚀
✅Like and subscribe to never miss a new idea!✅

GBP-CAD Will Go UP! Buy!
Hello,Traders!
GBP-CAD is going up now
And the pair is consolidating
Above the key horizontal level
Of 1.8670 and as we are
Bullish biased we will be
Expecting a further
Bullish move up
Buy!
Comment and subscribe to help us grow!
Check out other forecasts below too!
Disclosure: I am part of Trade Nation's Influencer program and receive a monthly fee for using their TradingView charts in my analysis.

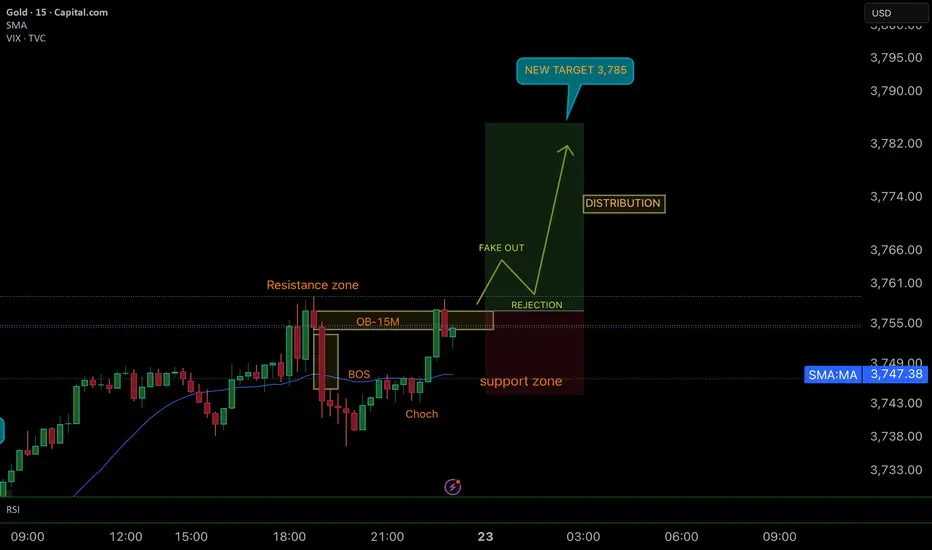
SMART MONEY CONCEPT (SMC)📊 Bullish SMC Trade Recap – GOLD
1. Resistance Break → Price cleanly broke the resistance zone, confirming bullish strength.
2. Fake Out & Liquidity Grab → Institutions swept liquidity above resistance, trapping early sellers.
3. Rejection Entry → The rejection gave the perfect confirmation for entry.
4. Explosive Move → Price launched directly toward the new target.
5. Target 3,785 Hit 🎯 → Institutions drove the market to fresh Higher Highs, just as projected.
6. Distribution Phase → After hitting target, price consolidates in distribution, showing smart exit points.
✅ Conclusion: Patience, confirmation, and structure once again proved the power of institutional trading. A clean, textbook example of SMC in action.
GOOD JOB TRADERS…… ;)

SMART MONEY CONCEPT (SMC)📊 Bullish SMC Analysis – GOLD
1. Resistance Break & Confirmation
Waiting for a clean breakout above the resistance zone to confirm bullish intention.
2. Liquidity Grab (Fake Out)
A fake out is expected after the breakout, designed to trap sellers and sweep liquidity.
3. Rejection Entry
Entry would be ideal at the rejection from the liquidity grab, aligning with institutional order flow.
4. Support Zone & Stop Loss
Stop loss is wisely placed below the support zone, giving the trade structure-based protection.
5. Targeting New Highs (HH)
Once rejection confirms, the momentum should aim toward new highs with the next target at 3,785.
✅ Conclusion: This plan is perfectly aligned with institutional footprints — waiting patiently for confirmation, entering on rejection, and protecting the position with a clean SL under support. Excellent setup for a high R:R trade. GOOD LUCK TRADERS ;)
NZD_CAD LOCAL SHORT|
✅NZD_CAD has retested
A key resistance level of 0.8120
And as the pair is already
Making a bearish pullback
A move down to retest the
Demand level below
At 0.8090 is likely
SHORT🔥
✅Like and subscribe to never miss a new idea!✅

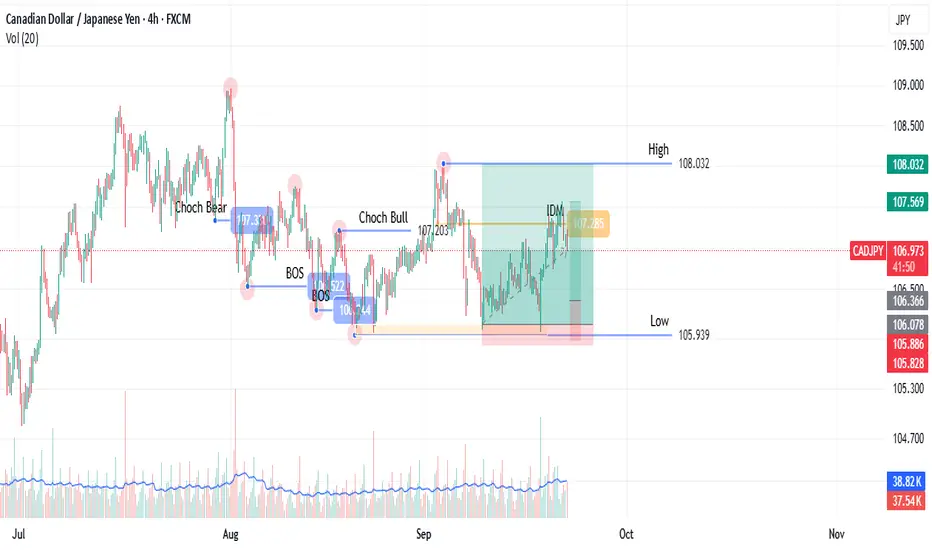
SMC Concept: Defining the Trading Range (Step 1) On CADJPYCAD/JPY, 4H Timeframe (as demonstrated)
This post outlines the first step in a methodology focused on identifying key market structure levels. The goal is to objectively define a trading range, using CAD/JPY as the example.
The Process: Of a bullish Structure
Identify the range Low: Locate the last retracement from the previous high, the low is deepest price level retraced to.
Find the Inducement: Mark the low of the most recent pullback (retracement) before the price made a new high.
Wait for Confirmation: The high is only confirmed once price returns to hit this inducement level. This validates the high as an official range boundary.
A break of the confirmed high is a break of structure (BOS). A break of the confirmed low suggests a change of character (CHoCH), shifting sentiment.
This is the foundational step for identifying future points of interest. The next step involves plotting POIs based on this confirmed range.
This methodology is based on one that I learned from someone else on Youtube, but I have changed many details to suit my style. As a thank you note, I have referred to this person on other paltforms, but unfortunately, I don't think I can do this here as I might be violating this platform's rules.
I will be posting the next steps that would lead to deciding on a trading position on step by step basis.
I am already making videos but I might be using this platforms video option for later posts.
CHF-JPY Will Keep Growing! Buy!
Hello,Traders!
CHF-JPY is trading in an
Uptrend and the pair made
A retest of the horizontal
Support level of 186.000
And a is already making
A bullish rebound so we
Are bullish biased and
We will be expecting a
Further bullish move up
Buy!
Comment and subscribe to help us grow!
Check out other forecasts below too!
Disclosure: I am part of Trade Nation's Influencer program and receive a monthly fee for using their TradingView charts in my analysis.

GBP_CAD RESISTANCE AHEAD|SHORT|
✅GBP_CAD has been growing recently
And the pair seems locally overbought
So as the pair is approaching
A horizontal resistance of 1.8669
Price decline is to be expected
SHORT🔥
✅Like and subscribe to never miss a new idea!✅

GBP-JPY Bearish Breakout! Sell!
Hello,Traders!
GBP-JPY made a bearish
Breakout of the rising
Support line and now
Made a retest of the new
Rising resistance and made
A pullback so we are
Bearish biased and we
Will be expecting a
Further bearish move down
Sell!
Comment and subscribe to help us grow!
Check out other forecasts below too!
Disclosure: I am part of Trade Nation's Influencer program and receive a monthly fee for using their TradingView charts in my analysis.

USD-CHF Local Long! Buy!
Hello,Traders!
USD-CHF made a retest
Of the horizontal support
Around 0.7920 from
Where we are seeing
A local bullish reaction
Already and we will be
Expecting a further
Bullish move up
Buy!
Comment and subscribe to help us grow!
Check out other forecasts below too!
Disclosure: I am part of Trade Nation's Influencer program and receive a monthly fee for using their TradingView charts in my analysis.

AUD_USD LONG FROM SUPPORT|
✅AUD_USD is going down now
But a strong support level is ahead at 0.6560
Thus I am expecting a rebound
And a move up towards the target of 0.6600
LONG🚀
✅Like and subscribe to never miss a new idea!✅

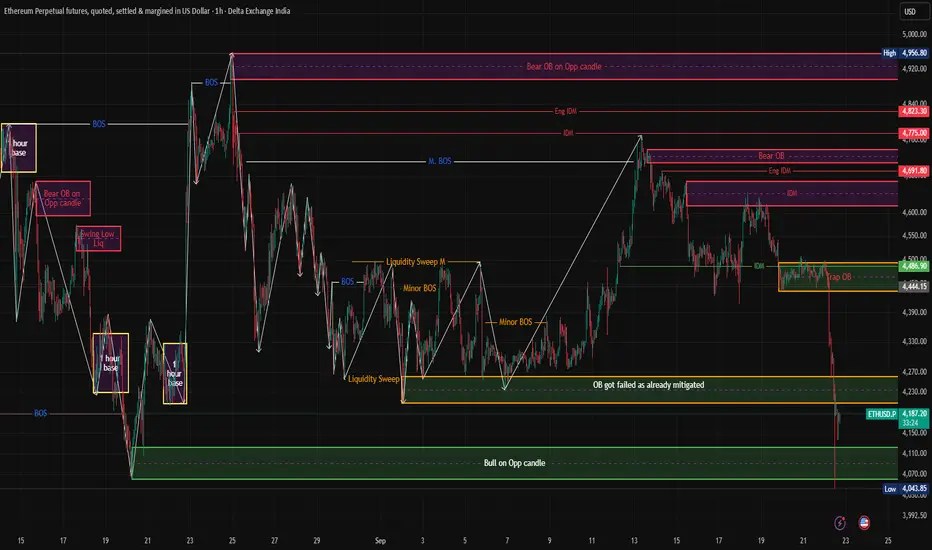
A Clear Bullish set up is getting ready in ETH ETH is showing a bullish setup after recent liquidity sweeps and reaction from the higher-timeframe demand zone.
🔑 Key Observations:
Price tapped into the Bullish Opposite Candle Order Block (4040–4100 zone) and reacted strongly.
A Liquidity Sweep & smart money is likely accumulating.
The Trap Bear OB around 4440–4480 acts as the first magnet for price.
If momentum continues, the next liquidity pool sits higher near 4690–4820, where multiple Bear OBs + IDM overlap.
📌 Trading Plan (Sniper Style):
Entry Zone: 4040–4100 (Bull OB)
Stop Loss: Below 4030 (invalidation)
Target 1: 4440–4480 (Trap OB)
Target 2: 4690–4820 (Major Supply / Bear OB cluster)
💡 Bias: Bullish as long as 4040 demand holds. A clean close below would invalidate the setup.
SMART MONEY CONCEPT (SMC)📊 Bullish Analysis on GOLD (XAU/USD)
1. Market Context
• Price recently showed a ChoCh (Change of Character) followed by a clear BOS (Break of Structure), confirming bullish momentum and institutional interest.
• The highlighted OB-1H zone acts as a decision point where a retracement is likely.
2. Trade Plan
• Rejection Zone: Expecting price to retest the OB-1H and confirm liquidity before continuation.
• Fake Out: A possible liquidity grab may occur, trapping sellers before the real move.
• Institutional Distribution: After clearing liquidity, price is likely to resume its bullish path strongly.
3. Target & Risk Management
• 🎯 New Target: 3,730 (potential creation of a Higher High – HH).
• 📍 Support Zone: Marked as invalidation area if price breaks lower.
• 🛡️ Entry on rejection provides a strong Risk/Reward setup supported by institutional order flow.
4. Conclusion
This setup highlights institutional buyers’ interest in driving price higher. The key is patience wait for confirmation at the rejection zone before entering to catch the move toward 3,730.
GOOD LUCK TRADERS….. ;)

CRUDE OIL LONG FROM SUPPORT|
✅CRUDE OIL is going down to retest
A horizontal support around 61.80$
Which makes me locally bullish biased
And I think that we will see a rebound
And a move up from the level
Towards the target above at 62.80$
LONG🚀
✅Like and subscribe to never miss a new idea!✅

EUR-GBP Strong Brekaout! Buy!
Hello,Traders!
EUR-GBP is trading in an
Uptrend and the pair made
A bullish breakout of the
Key horizontal level
Around 0.8700 area
So we are locally bullish
Biased and we will be
Expecting a further move
Up on Monday
Buy!
Comment and subscribe to help us grow!
Check out other forecasts below too!
Disclosure: I am part of Trade Nation's Influencer program and receive a monthly fee for using their TradingView charts in my analysis.
