GBP_CAD BEARISH BREAKOUT|SHORT|
✅GBP_CAD broke the key structure level of 1.8580
While trading in an local downtrend
Which makes me bearish
And as the retest of the level is complete
Bearish continuation will follow
SHORT🔥
✅Like and subscribe to never miss a new idea!✅
Disclosure: I am part of Trade Nation's Influencer program and receive a monthly fee for using their TradingView charts in my analysis.
Smartmoneyconcept

EUR-AUD Bearish Breakout! Sell!
Hello,Traders!
EUR-AUD was trading along
The rising support line but
Now we are seeing a bearish
Breakout so we are bearish
Biased and we will be expecting
A further bearish move down
Sell!
Comment and subscribe to help us grow!
Check out other forecasts below too!
Disclosure: I am part of Trade Nation's Influencer program and receive a monthly fee for using their TradingView charts in my analysis.

EURUSD – Bearish Reversal Confirmed After Structural BreakEURUSD has shifted out of its bullish environment after a sustained rally inside a clean ascending channel. Price recently rejected a resistance zone that capped previous buying pressure and has now started to rotate downward. This marks the first serious challenge to the trend and sets the tone for a potential bearish phase.
Channel Breakdown and Price Behavior
The ascending channel had been respected for several sessions, guiding price upward with consistent higher highs and higher lows. The recent breakdown from this structure is significant, as it shows the market is no longer willing to support higher prices within that controlled environment. This type of breakout often signals a loss of momentum and increased volatility in the opposite direction.
Break of the Low and Shift in Structure
After breaking the channel, price also took out a major internal low, which had previously held during retracements. This is a key signal of a structural shift, confirming that the uptrend has been interrupted. When price breaks a low that buyers had been defending, it shows sellers have stepped in with conviction and are likely aiming lower targets.
Short-Term Target and Reaction Zone
The first area of interest sits just below current price where a support shelf and price inefficiencies line up. This zone, marked with the dollar sign symbol on the chart, may attract a short-term reaction. If buyers are still present, this is where they would likely try to step in. However, the rejection from resistance and the structural break suggest this level could eventually give way.
Imbalance Zone Below and Liquidity Target
If that support fails, the next high-probability draw is the large untested imbalance sitting further below. This zone has remained untouched since the rally began and represents unfinished business for the market. Price often seeks out these inefficiencies, especially after trend shifts, making it a natural target for sellers if momentum continues.
Conclusion
EURUSD is showing clear signs of bearish pressure after rejecting resistance, breaking structure, and leaving behind unmitigated downside targets. As long as we remain below the broken low, the path of least resistance points lower. The imbalance zone below remains the key destination unless the market shows signs of reversal higher.
Disclosure: I am part of Trade Nation's Influencer program and receive a monthly fee for using their TradingView charts in my analysis.
___________________________________
Thanks for your support!
If you found this idea helpful or learned something new, drop a like 👍 and leave a comment, I’d love to hear your thoughts! 🚀

EUR_GBP BULLISH BIAS|LONG|
✅EUR_GBP broke the key
Structure level of 0.8620
While trading in an local uptrend
Which makes me bullish
And I think that after the retest
Of the broken level is complete
A rebound and bullish continuation will follow
LONG🚀
✅Like and subscribe to never miss a new idea!✅
Disclosure: I am part of Trade Nation's Influencer program and receive a monthly fee for using their TradingView charts in my analysis.

AUD-USD Very Strong Uptrend! Buy!
Hello,Traders!
AUD-USD is trading in a
Very strong uptrend and
The pair broke a key horizontal
Level around 0.6540 which
Is now a support and we
Are already seeing a rebound
So we are bullish biased
And we will be expecting
A further move up
Buy!
Comment and subscribe to help us grow!
Check out other forecasts below too!
Disclosure: I am part of Trade Nation's Influencer program and receive a monthly fee for using their TradingView charts in my analysis.

BITCOIN STRONG RESISTANCE AHEAD|SHORT|
✅BITCOIN is going up now
But a strong resistance level is ahead at 112,000$
Which is also an All-Time-High
Thus I am expecting a pullback
And a move down towards the target of 107,300$
SHORT🔥
✅Like and subscribe to never miss a new idea!✅
Disclosure: I am part of Trade Nation's Influencer program and receive a monthly fee for using their TradingView charts in my analysis.

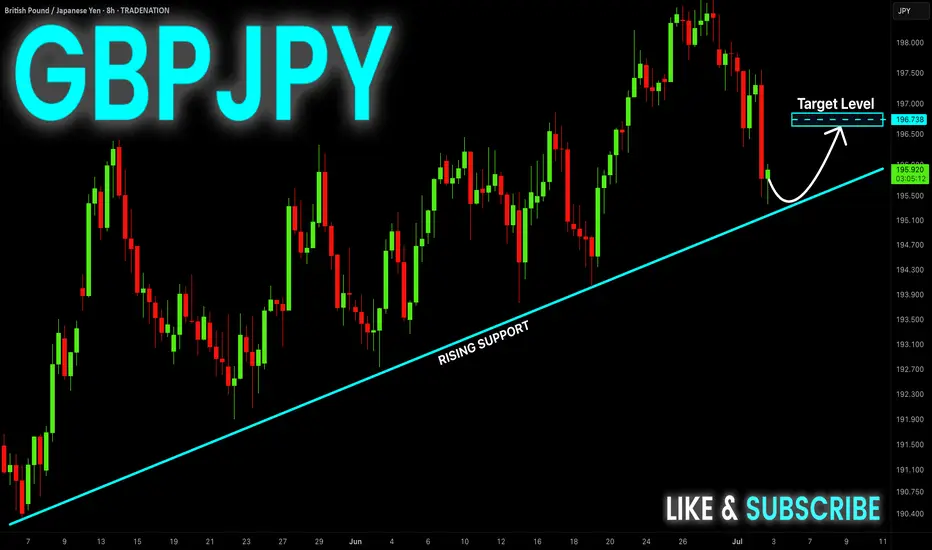
GBP-JPY Correction Ahead! Buy!
Hello,Traders!
GBP-JPY will soon make
A retest of the rising support
Line and as we are bullish
Biased we will be expecting
A local bullish correction
Buy!
Comment and subscribe to help us grow!
Check out other forecasts below too!
Disclosure: I am part of Trade Nation's Influencer program and receive a monthly fee for using their TradingView charts in my analysis.
GOLD BROKEN WEDGE|LONG|
✅GOLD was trading in an
Opening wedge pattern and
Now we are seeing a bullish
Breakout so we are bullish
Biased and we will be expecting
A further bullish move up
LONG🚀
✅Like and subscribe to never miss a new idea!✅
Disclosure: I am part of Trade Nation's Influencer program and receive a monthly fee for using their TradingView charts in my analysis.

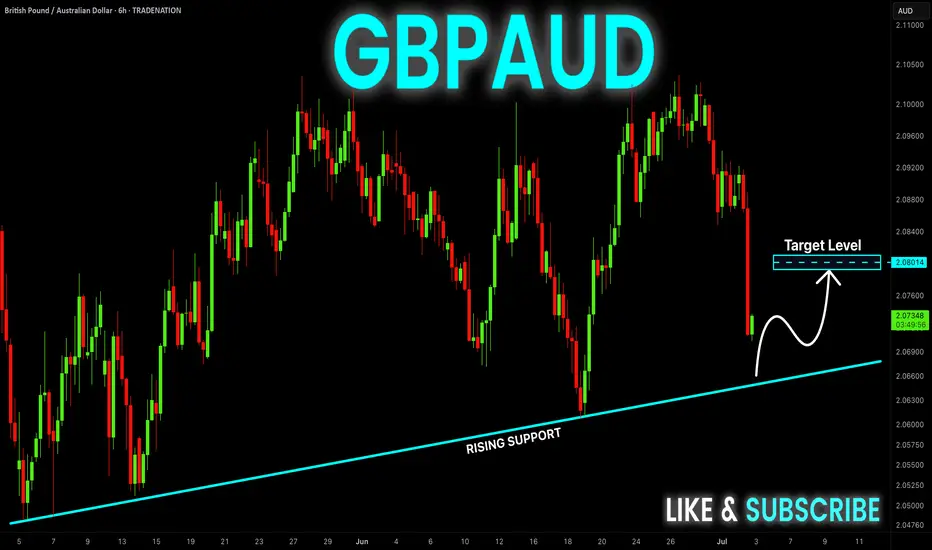
GBP-AUD Rising Support Ahead! Buy!
Hello,Traders!
GBP-AUD made a sharp
And sudden move down
And the pair is oversold
So after it retest the rising
Support line we will be
Expecting a local bullish
Correction and a move up
Buy!
Comment and subscribe to help us grow!
Check out other forecasts below too!
Disclosure: I am part of Trade Nation's Influencer program and receive a monthly fee for using their TradingView charts in my analysis.
GBP_CAD WILL KEEP GROWING|LONG|
✅GBP_CAD is trading in an
Uptrend and the pair made a
Retest and a rebound from the
Horizontal support of 1.8675
So we are bullish biased and
We will be expecting a
Further bullish move up
LONG🚀
✅Like and subscribe to never miss a new idea!✅
Disclosure: I am part of Trade Nation's Influencer program and receive a monthly fee for using their TradingView charts in my analysis.

NZD-CAD Swing Short! Sell!
Hello,Traders!
NZD-CAD keeps growing
In an uptrend but the pair
Will soon retest a wide
Horizontal resistance level
Around 0.8350 so after the
Retest we will be expecting
A bearish pullback
Sell!
Comment and subscribe to help us grow!
Check out other forecasts below too!
Disclosure: I am part of Trade Nation's Influencer program and receive a monthly fee for using their TradingView charts in my analysis.

AUD_CHF BEARISH BREAKOUT|SHORT|
✅AUD_CHF is going down currently
As the pair broke the key structure level of 0.5240
Which is now a resistance, and after the pullback
And retest, I think the price will go further down
SHORT🔥
✅Like and subscribe to never miss a new idea!✅
Disclosure: I am part of Trade Nation's Influencer program and receive a monthly fee for using their TradingView charts in my analysis.

EUR-CHF Long From Support! Buy!
Hello,Traders!
EUR-CHF is trading in a
Parallel range and we see
A rejection from the horizontal
Support area below around 0.9293
And we are already seeing a bullish
Reaction so a further move up
Is to be expected
Sell!
Comment and subscribe to help us grow!
Check out other forecasts below too!
Disclosure: I am part of Trade Nation's Influencer program and receive a monthly fee for using their TradingView charts in my analysis.

Bitcoin - Rejection From Major Resistance, Eyes on 103.8K SupporBitcoin is once again reacting to a major resistance zone around 108.8K, a level that has consistently rejected price in the past. The market attempted a breakout but failed to sustain momentum, forming multiple wicks and signs of weakness near the highs. This repeated rejection suggests that sellers are still in control up here and that this zone remains a strong ceiling for price.
Immediate Downside Scenario
With bearish pressure building at resistance, price is now pulling back and eyeing the first key support level around 103.8K. This zone previously acted as a significant base, with an imbalance overlap and structural demand from past price action. If price taps into this zone and buyers defend it, we could see a recovery bounce and potentially another retest of the upper resistance.
Breakdown Risk and Bearish Expansion
However, if 103.8K fails to hold, this opens the door for a deeper correction. The next logical downside target would be in the 98K region, where a higher timeframe imbalance sits and where price last found strong demand during the last major push up. This would also align with a full sweep of recent liquidity build-ups below.
Bullish Recovery Path
In the bullish case, holding 103.8K could initiate a rebound back toward the 108.8K resistance. This would likely depend on a solid reaction and displacement from the support zone, potentially forming a new higher low structure. For bulls to regain full control, we would need to see a clean breakout above the resistance zone with continuation.
Key Zones to Watch
The red resistance zone near 108.8K remains the clear invalidation for further upside, while the grey support block around 103.8K is the first major level that could decide the short-term trend. If that breaks, the purple demand zone near 98K is a high-probability area for price to find support again.
Conclusion
Bitcoin is still stuck between a strong resistance ceiling and a critical mid-range support zone. The rejection from the top signals that we may see downside in the near term, but whether this turns into a full reversal or just a retracement depends entirely on how price reacts around 103.8K. Hold it and we bounce, break it and we likely drop toward 98K. Keep watching how price behaves at these levels to gauge momentum and direction.
___________________________________
Thanks for your support!
If you found this idea helpful or learned something new, drop a like 👍 and leave a comment, I’d love to hear your thoughts! 🚀

GOLD Short From Resistance! Sell!
Hello,Traders!
GOLD made a bullish
Rebound from the support
Below just as we predicted in
Our previous analysis but
Gold is still trading in the
Downtrend as the lower lows
And higher highs are intact
And the structure is healthy
So after the price retested the
Horizontal resistance above
Around 3,310$ we are
Likely to see a further
Bearish move down
Sell!
Comment and subscribe to help us grow!
Check out other forecasts below too!
Disclosure: I am part of Trade Nation's Influencer program and receive a monthly fee for using their TradingView charts in my analysis.

CAD_CHF WILL KEEP FALLING|SHORT|
✅CAD_CHF broke the key structure level of 0.5840
While trading in a strong downtrend
Which makes me bearish
And I think that after the retest of the broken level is complete
A rebound and bearish continuation will follow
SHORT🔥
✅Like and subscribe to never miss a new idea!✅
Disclosure: I am part of Trade Nation's Influencer program and receive a monthly fee for using their TradingView charts in my analysis.

CAD-JPY Bullish Bias! Buy!
Hello,Traders!
CAD-JPY keeps trading
In an uptrend along the
Rising support line and
We are already seeing a
Bullish rebound so we are
Bullish biased and we will
Be expecting a further
Bullish move up
Buy!
Comment and subscribe to help us grow!
Check out other forecasts below too!
Disclosure: I am part of Trade Nation's Influencer program and receive a monthly fee for using their TradingView charts in my analysis.

GOLD WILL FALL|SHORT|
✅GOLD is trading in a
Downtrend and the price is
Making a typical rebound but
After the horizontal resistance
Level above around 3,300$ is
Retested we will be expecting
A further bearish move down
SHORT🔥
✅Like and subscribe to never miss a new idea!✅
Disclosure: I am part of Trade Nation's Influencer program and receive a monthly fee for using their TradingView charts in my analysis.

GBP-CHF Bearish Breakout! Sell!
Hello,Traders!
GBP-CHF formed a H&S
Pattern and now we are
Seeing a strong bearish
Breakout of the neckline
Key level around 1.0933
Area and as the breakout
Is confirmed we will be
Expecting a further bearish
Move down towards the
Target below around 1.0867
Sell!
Comment and subscribe to help us grow!
Check out other forecasts below too!
Disclosure: I am part of Trade Nation's Influencer program and receive a monthly fee for using their TradingView charts in my analysis.

EUR/USD - Liquidity grabbed! Move towards the 4H FVG next?This chart illustrates a short-term bearish outlook on the EUR/USD currency pair, using smart money concepts like liquidity grabs, fair value gaps (FVGs), and structural levels such as support and protected lows. It is based on the 1-hour timeframe and references a higher timeframe (4H) for added confluence.
Liquidity Sweep
At the top of the recent price movement, a "Liquidity sweep" is marked, suggesting that the market pushed above recent highs to trigger stop-losses of short positions or entice breakout traders before reversing. This kind of move is common in smart money concepts and typically precedes a directional shift, which in this case, is anticipated to be downward. This sweep likely removed buy-side liquidity and indicates that institutional traders may now seek to target sell-side liquidity below recent lows.
Support Zone
The green shaded area labeled "Support" represents a previous consolidation or demand zone that temporarily held price after the liquidity sweep. This zone is seen as a short-term reaction point where price may consolidate or bounce slightly before continuing lower. However, the dashed black line projection suggests that this support is not expected to hold long-term, as price is forecasted to break below it.
Protected Low
A previous low is labeled "Protected low," implying that it hasn’t been violated during recent downward moves. This term often refers to a structural level that, if broken, confirms a shift in market structure. In this context, the projection anticipates that price will break below this protected low, indicating a bearish intent and unlocking further downside movement.
4H Fair Value Gap (FVG)
The large blue zone labeled "4H FVG" marks an imbalance or inefficiency on the 4-hour chart. This zone is referred to as a "Strong bullish 4h FVG," suggesting that once the sell-side liquidity is taken and the lower targets are met, this area is expected to act as a high-probability demand zone. Institutional traders often look for price to fill these FVGs before reversing, as they represent unmitigated institutional orders. The projected path implies that this is the ultimate downside target where price may react bullishly.
Conclusion
Overall, this analysis outlines a bearish short-term scenario for EUR/USD. After sweeping liquidity above recent highs, price is expected to respect the bearish order flow, break through the current support level, and move below the protected low. The ultimate downside target lies within the strong 4H FVG, where a significant bullish reaction might occur. This suggests a classic smart money play, manipulate (sweep liquidity), shift (break structure), and mitigate (return to FVG)—offering a well-structured trade idea for both intraday and swing traders.
Disclosure: I am part of Trade Nation's Influencer program and receive a monthly fee for using their TradingView charts in my analysis.
Thanks for your support.
- Make sure to follow me so you don't miss out on the next analysis!
- Drop a like and leave a comment!

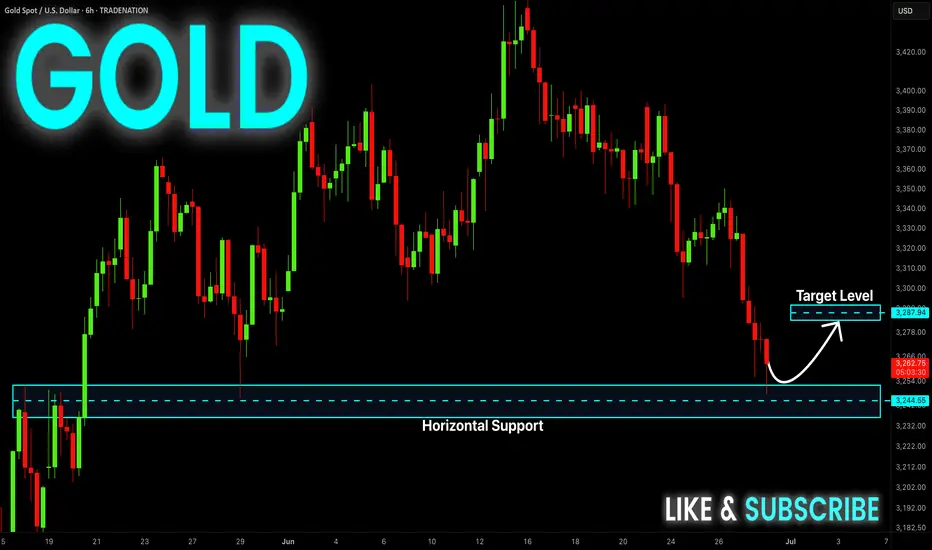
GOLD Support Ahead! Buy!
Hello,Traders!
GOLD keeps falling just
As I predicted but the price
Will soon hit a horizontal support
Around 3235$ from where we
Will be expecting a local
Bullish rebound
Buy!
Comment and subscribe to help us grow!
Check out other forecasts below too!
Disclosure: I am part of Trade Nation's Influencer program and receive a monthly fee for using their TradingView charts in my analysis.
EUR_AUD LOCAL SHORT|
✅EUR_AUD is going up now
But a strong resistance level is ahead at 1.8018
Thus I am expecting a pullback
And a move down towards the target of 1.7900
SHORT🔥
✅Like and subscribe to never miss a new idea!✅
Disclosure: I am part of Trade Nation's Influencer program and receive a monthly fee for using their TradingView charts in my analysis.

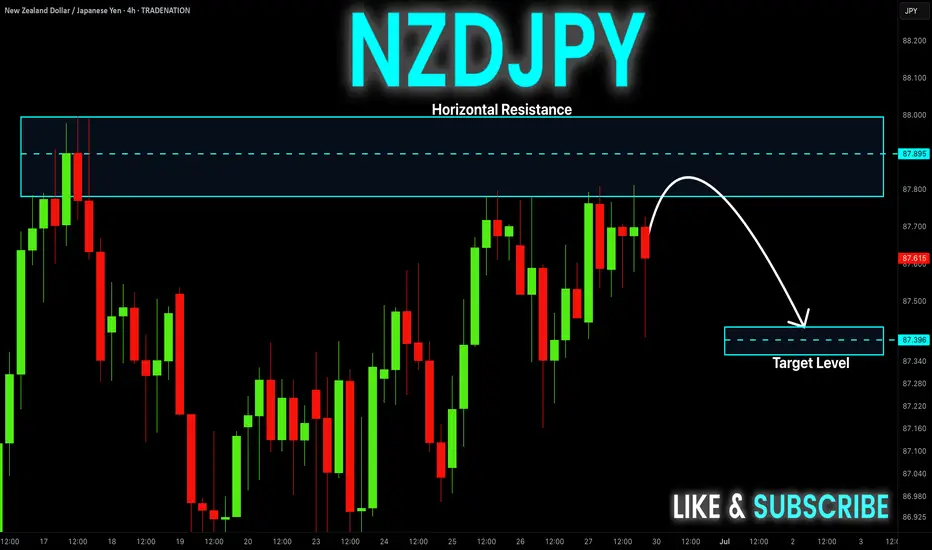
NZD-JPY Potential Short! Sell!
Hello,Traders!
NZD-JPY is slowly approaching
A horizontal resistance level
Around 87.994 so despite
The strong uptrend
We will be expecting a
Local bearish pullback on Monday
Sell!
Comment and subscribe to help us grow!
Check out other forecasts below too!
Disclosure: I am part of Trade Nation's Influencer program and receive a monthly fee for using their TradingView charts in my analysis.